20 Beste Netzwerküberwachungssoftware im Test für 2026

Bestes Netzwerküberwachungssoftware-Shortlist
Hier ist meine Shortlist der besten Netzwerküberwachungssoftware:


Das Management eines Netzwerks kann herausfordernd sein. Sie jonglieren mit mehreren Geräten, sorgen für Datensicherheit und stellen sicher, dass alles reibungslos funktioniert. Netzwerküberwachungssoftware kann bei diesen Herausforderungen helfen, indem sie Einblick und Warnmeldungen bietet – so kann sich Ihr Team auf das Wesentliche konzentrieren.
Ich habe viele dieser Tools getestet und bewertet, um Ihnen einen unvoreingenommenen Überblick über die besten verfügbaren Optionen zu bieten. In diesem Artikel finden Sie eine ausführliche Bewertung der führenden Netzwerküberwachungssoftware, die die Anforderungen Ihres Teams erfüllen kann.
Ich lege Wert auf gut recherchierte, vertrauenswürdige Informationen, damit Sie fundierte Entscheidungen treffen können. Schauen wir uns an, wodurch sich diese Tools auszeichnen und wie sie Ihr Team unterstützen können.
Why Trust Our Software Reviews
We’ve been testing and reviewing software since 2023. As tech leaders ourselves, we know how critical and difficult it is to make the right decision when selecting software.
We invest in deep research to help our audience make better software purchasing decisions. We’ve tested more than 2,000 tools for different tech use cases and written over 1,000 comprehensive software reviews. Learn how we stay transparent & our software review methodology.
Netzwerküberwachung – Zusammenfassung
| Tool | Best For | Trial Info | Price | ||
|---|---|---|---|---|---|
| 1 | Best for endpoint management and patch compliance | Free trial + free demo available | Pricing upon request | Website | |
| 2 | Best for visual representations of networks | 14-day free trial available | Pricing upon request | Website | |
| 3 | Best for network visibility and device discovery | 30-day free trial + free demo available | From $149/technician/month (billed annually) | Website | |
| 4 | Best for multi-vendor network monitoring | Free demo available | From $245/25 devices | Website | |
| 5 | Best for scalable IT monitoring | Free plan + 30-day free trial available | From $225/month (billed annually) | Website | |
| 6 | Best for unified MSP management | 14-day free trial | From $89/user/month (billed annually) | Website | |
| 7 | Best open-source solution | Free plan available | Pricing upon request | Website | |
| 8 | Best for DNS security and threat prevention | Free trial + free demo available | Pricing upon request | Website | |
| 9 | Best for proactive network issue prevention | 30-day free trial | From $179/month (billed annually) | Website | |
| 10 | Best for comprehensive device coverage | 30-day free trial + free demo available | From $10/month (billed annually) | Website | |
| 11 | Best for real-time infrastructure monitoring | 14-day free trial + free plan + free demo available | From $4.50/node/month (billed annually) | Website | |
| 12 | Best for packet analysis | Not available | Free to use | Website | |
| 13 | Best for network monitoring in complex environments | 15-day free trial | From $7/month | Website | |
| 14 | Best for cloud-based network monitoring | Free 15-day trial | From $16/hybrid unit/month | Website | |
| 15 | Best for small businesses | 14-day free trial + free plan available | From $15/host/month (billed annually) | Website | |
| 16 | Best range of features | Free download available | Pricing upon request | Website | |
| 17 | Best for network monitoring and ITSM ticketing | 14-day free trial | Pricing upon request | Website | |
| 18 | Best for comprehensive network monitoring | Free 30-day trial + Free edition (unavailable in the US, Canada, Japan, Taiwan) | Pricing upon request | Website | |
| 19 | Best for advanced and power users | Free trial + free demo available | Pricing upon request | Website | |
| 20 | Best for enterprises | Free demo + 30-day free trial + free plan available | From $2,595/100 node license | Website |


-

Site24x7
Visit WebsiteThis is an aggregated rating for this tool including ratings from Crozdesk users and ratings from other sites.4.6 -
GitHub Actions
Visit WebsiteThis is an aggregated rating for this tool including ratings from Crozdesk users and ratings from other sites.4.8 -
Docker
Visit WebsiteThis is an aggregated rating for this tool including ratings from Crozdesk users and ratings from other sites.4.6


Bestes Netzwerküberwachungssoftware – Bewertungen
Hier finden Sie meine Auswahl der besten Netzwerküberwachungssoftware und -tools:

NinjaOne gives IT teams a unified platform to monitor networks, manage endpoints, and automate patching across distributed environments, helping MSPs and internal IT departments reduce risk and maintain uptime.
Who Is NinjaOne Best For?
NinjaOne is a strong fit for MSPs and mid-sized IT teams that need centralized visibility and control across a large number of endpoints.
Why I Picked NinjaOne
NinjaOne earns its spot on my shortlist because of how tightly it connects endpoint visibility with automated patch compliance. I particularly like the Patch Intelligence AI feature, which analyzes telemetry and deployment signals to automatically flag unstable updates before they roll out—so my team doesn't have to research every KB article to decide what's safe to deploy. NinjaOne supports patching across Windows, macOS, Linux, and over 200 third-party applications from a single console, so I don't have to juggle separate tools for different OS environments. The condition-based remediation workflows also let my team automatically detect and correct endpoint issues at scale, without waiting on a technician to intervene.
NinjaOne Key Features
- Hardware and software inventory: Gives you a real-time view of every device in your environment, including hardware specs, installed software, warranty status, and performance data.
- Secure remote access: Lets you connect directly to any device to diagnose and resolve issues without switching to a separate remote access tool.
- Form-based script deployment: Build scripts in common languages and deploy them across your environment using interactive forms without editing code each time.
- Flexible device reporting: Customize device views with configurable columns and filters to surface the specific data your team needs to act on.
NinjaOne Integrations
Integrations include ServiceNow, CrowdStrike, SentinelOne, Microsoft Entra, Okta, PagerDuty, Bitdefender, ConnectWise Manage, IT Glue, and Slack.
Pros and Cons
Pros:
- Automated IT compliance reporting
- Detailed hardware and software inventory tracking
- Efficient multi-tenant management
Cons:
- Limited customization in dashboard design
- Dependency on cloud infrastrucutre
New Product Updates from NinjaOne
NinjaOne Launches Integrated Remote Access
NinjaOne has expanded its automated management platform by introducing NinjaOne Remote, a secure remote access solution for multiple operating systems. For more information, visit NinjaOne's official site.

Auvik gives IT teams and managed service providers a cloud-based platform to automatically discover, map, and monitor complex networks, helping them identify issues and maintain reliable infrastructure.
Who Is Auvik Best For?
Auvik is a strong fit for managed service providers and in-house IT teams that need to monitor and manage multi-site or multi-client network environments.
Why I Picked Auvik
Auvik earns its spot as one of the best on my shortlist because of how its automated network topology maps work in practice. The moment you install a collector, Auvik draws your network map from scratch—every switch, firewall, router, and IP-connected device appears with its Layer 1, 2, and 3 connections visible. I love that the map updates in real time as your network changes, so you're never working from a stale diagram when you're trying to trace an issue. On top of that, the path analysis feature lets you trace the route between any two devices and see alerts and performance data overlaid directly on that path, which makes root cause analysis much faster than jumping between separate tools.
Auvik Key Features
- Automated configuration backup: Auvik automatically backs up device configurations and lets you compare versions side-by-side to spot unauthorized changes.
- 64+ preconfigured alerts: Auvik ships with a library of pre-built alerts that surface directly on your live network map from day one, with no manual setup required.
- Multi-tenant dashboard: A centralized dashboard gives you real-time visibility across all sites and client environments from a single pane of glass.
- Network traffic analysis: Auvik monitors bandwidth usage, application flows, and geo data at the interface level so you can pinpoint performance bottlenecks.
Auvik Integrations
Integrations include ConnectWise, Autotask, ServiceNow, Slack, Microsoft Teams, Cisco Meraki, VMware, Palo Alto Networks, Fortinet, and an open API for custom integrations.
Pros and Cons
Pros:
- Quick and accurate alerting system
- Single dashboard monitoring
- Detailed visual graphical representation of networks
Cons:
- Could use more integrations
- Customizing the platform can be time consuming
New Product Updates from Auvik
Auvik Adds HA Pair Monitoring, Improves Ping Alerts, & Expands SaaS Integrations
Auvik introduces HA Pair Monitoring for Fortinet firewalls, improved Service Status alerts for Internal Ping Checks, and new SaaS integrations with ServiceNow, GitLab, ClickUp, and Notion. These updates improve network monitoring visibility and provide better insights into SaaS license usage. For more information, visit Auvik’s official site.
 .
.
For network administrators and IT professionals seeking to monitor and manage their networks, Atera offers a comprehensive solution. It is tailored for managed service providers and IT departments aiming to oversee multiple networks with ease. It addresses challenges like device discovery and network visibility, ensuring you can maintain a robust network infrastructure.
Who Is Atera Best For?
IT generalists and MSPs in small to mid-sized businesses serving distributed clients. It supports teams that need network visibility and automated device discovery within a unified management platform.
Why I Picked Atera
I picked Atera for its exceptional network visibility, which is crucial for any network monitoring tool. Atera's Network Discovery feature stands out, offering an in-depth view of all devices within a network. This feature automatically scans and updates the network inventory, ensuring you always have the latest information on your network assets. Additionally, its continuous monitoring capabilities track key metrics like CPU, RAM, and bandwidth usage, helping you maintain optimal network performance.
Atera Key Features
In addition to its network visibility, Atera offers several other features that enhance its functionality:
- Remote Monitoring and Management (RMM): This feature allows you to monitor your network's health and performance from a single dashboard.
- Automated Patch Management: Keep your systems up-to-date with automated patching, reducing vulnerabilities.
- Helpdesk and Ticketing System: Streamline your support process with an integrated ticketing system.
- Reporting and Analytics: Gain insights with detailed reports on network performance and issues.
Atera Integrations
Integrations include Microsoft Teams, Slack, Acronis, Splashtop, and an API is available for custom integrations.
Pros and Cons
Pros:
- Centralized inventory for network assets
- Real-time CVE vulnerability scanning
- Auto-discovery of devices
Cons:
- Some features require separate add-ons
- Customization options may feel limited
New Product Updates from Atera

Atera Enhances IT Autopilot With Automation and File Support
Atera’s IT Autopilot gets three major boosts: you can now attach common files for deeper analysis, automate IT tasks with clear workflows, and choose how the system follows up when users go silent. These updates help streamline IT operations and improve resolution efficiency. For more information, visit Atera’s official site.

ManageEngine OpManager gives IT teams and network administrators a unified platform to monitor, troubleshoot, and manage complex network infrastructures across physical, virtual, and cloud environments.
Who Is ManageEngine OpManager Best For?
ManageEngine OpManager is a strong fit for mid-size to large enterprises running complex network infrastructures that span multiple device vendors and technology stacks.
Why I Picked ManageEngine OpManager
I picked ManageEngine OpManager as one of the best because of how well it handles environments where Cisco, Juniper, Fortinet, and HP devices coexist on the same network. Most teams run mixed-vendor stacks, and OpManager's SNMP-based device discovery classifies hardware by category—routers, switches, firewalls—regardless of vendor. I also like the network path analysis feature, which lets my team trace the route traffic takes across multi-vendor hops and pinpoint where degradation occurs. The AI-based adaptive thresholds adjust based on real-time performance trends, reducing the need to retune alert baselines when new devices from different vendors are added.
ManageEngine OpManager Key Features
- Network mapping: Automatically generates L1/L2 topology maps to visualize device relationships and pinpoint outages across your infrastructure.
- IT workflow automation: Lets you build automated response workflows to handle first-level fault troubleshooting and routine maintenance tasks without manual intervention.
- Storage capacity forecasting: Analyzes historical and current usage trends to predict when storage resources will be exhausted before it becomes a problem.
- Distributed network monitoring: Monitors network resources across remote branch offices and data centers from a single unified console using a probe-central architecture.
ManageEngine OpManager Integrations
Integrations include ServiceDesk Plus, NetFlow Analyzer, Network Configuration Manager, Firewall Analyzer, OpUtils, AlarmsOne, Applications Manager, Analytics Plus, Site24x7, and AssetExplorer.
Pros and Cons
Pros:
- Router performance metrics like temperature, voltage, and buffer statistics
- Mapping and visualization of performance degradation and network outages
- 2,000+ performance metrics for network monitoring
Cons:
- Complex setup and configuration process
- Limited customization options for dashboards and reports
New Product Updates from ManageEngine OpManager
ManageEngine OpManager Vendor Templates and NCM XML Import
ManageEngine OpManager introduces enhanced vendor template integration and device template import for the NCM module using XML files. This update helps teams improve device classification and speed up configuration workflows. For more information, visit ManageEngine OpManager’s official site.
 .
.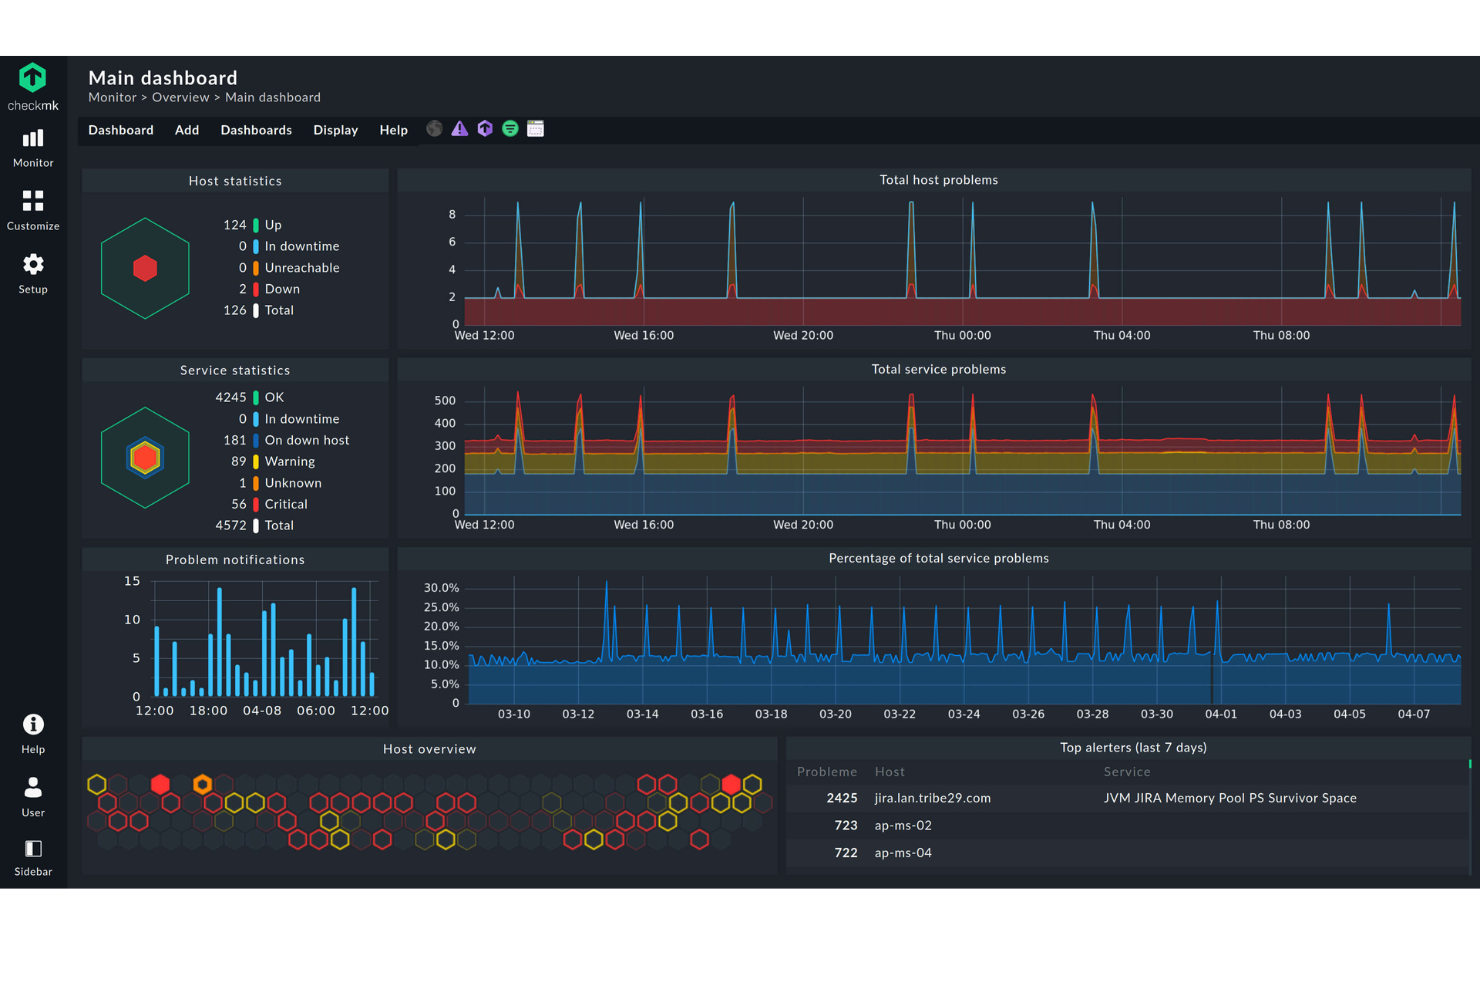
Checkmk is a network monitoring platform built for IT teams and managed service providers who need to monitor complex, distributed infrastructures and identify network issues across a wide range of devices and protocols.
Who Is Checkmk Best For?
Checkmk is a strong fit for mid-size to large IT teams and MSPs managing hybrid or multi-site infrastructures that have outgrown simpler monitoring tools.
Why I Picked Checkmk
Checkmk earns its spot on my shortlist because its distributed monitoring architecture genuinely scales in a way most tools can't match. I like that you can monitor hundreds of sites and millions of devices from a single platform without spinning up and syncing multiple monitoring instances. The auto-discovery feature is a standout—Checkmk automatically detects hosts and services, then recommends relevant metrics and thresholds, reducing setup time in large environments. The rule-based 1-to-N configuration lets my team apply a single rule across thousands of hosts, keeping configuration manageable as infrastructure grows.
Checkmk Key Features
- Real-time sampling: Checkmk collects monitoring data at measurement intervals as short as one minute, giving you up-to-date visibility into infrastructure health.
- Smart alerting: A rule-based notification system routes alerts to the right team—like storage admins for a failing disk—and escalates unresolved issues automatically.
- Log monitoring: Checkmk ingests events from syslog, SNMP traps, Windows event logs, and log files, then filters and collapses duplicate entries to reduce noise.
- Hardware and software inventory: Checkmk automatically identifies and tracks all hardware and software assets, and flags changes as they occur across your environment.
Checkmk Integrations
Integrations include AWS, Azure, Google Cloud Platform, VMware, Cisco, Dell, HPE, NetApp, Oracle, and Kubernetes.
Pros and Cons
Pros:
- Comprehensive monitoring capabilities
- Numerous automation options
- High configurability
Cons:
- Learning curve for new users
- Potential overhead for smaller networks

SuperOps is a cloud-based platform designed for managed service providers who need to monitor client networks, manage IT assets, and handle support tickets from a single dashboard.
Who Is SuperOps Best For?
SuperOps is a strong fit for small to mid-sized MSPs that need a single platform to manage network monitoring, ticketing, and client IT environments.
Why I Picked SuperOps
SuperOps earns its spot on my shortlist because it's one of the few platforms that genuinely combines network monitoring with a full PSA and RMM in a single interface. I like that network monitoring isn't bolted on as an afterthought—it's built into the RMM layer, so when a network alert fires, my team can jump into a ticket without switching tools. The platform supports real-time SNMP and ICMP monitoring across 250+ device manufacturers, and the visual topology maps give technicians full network context at a glance. Alert management uses AI to cut through noise, so my team focuses on issues that need attention rather than chasing false positives.
SuperOps Key Features
- Built-in SSH terminal: Access the terminal of any SSH-enabled network device directly within SuperOps to fix issues remotely without an on-site visit.
- Patch management: Schedule and automate OS and third-party software patches for Windows and Mac devices, with a custom patch approval matrix and automated deployment cycles.
- IT documentation: Store and access SOPs, WMI credentials, and troubleshooting steps securely alongside asset and network data in a single platform.
- Custom OID monitoring: Track granular, device-specific metrics using default monitors or custom OID monitoring to measure network health and performance over time.
SuperOps Integrations
Integrations include TeamViewer, Splashtop, ConnectWise Control, Xero, QuickBooks Online, Bitdefender, Webroot, Stripe, Microsoft Entra ID, and Pax8.
Pros and Cons
Pros:
- Offers native integrations with popular third-party software, enhancing functionality
- Easy to use with a simple setup process, reducing the learning curve for new users
- Unified platform that integrates network monitoring with RMM, streamlining IT operations
Cons:
- Limited information on customization options for specific MSP needs
- As a relatively new player, may lack some advanced features found in established competitors
New Product Updates from SuperOps

SuperOps Adds HTML Support for Ticket Closure Emails
SuperOps introduces HTML embedding for ticket closure emails. This update allows teams to include custom content such as CSAT survey links and branded elements in resolution emails. For more information, visit SuperOps’ official site.
 .
.
Icinga is a flexible network monitoring platform built for IT teams and system administrators who need deep visibility, real-time alerts, and customizable dashboards to keep complex infrastructures running smoothly.
Who Is Icinga Best For?
Icinga is a strong fit for mid-to-large IT teams and DevOps engineers who need a highly customizable, open-source monitoring solution for complex, distributed infrastructure environments.
Why I Picked Icinga
Icinga earns its spot on my shortlist because it's one of the few genuinely open-source network monitoring platforms that doesn't water down its feature set to push you toward a paid tier. I like that you can monitor hosts, services, and network devices using a fully customizable check system, and then route alerts through your own notification logic without being locked into a vendor's opinionated workflow. My team uses Icinga's Icinga Director module to manage large-scale configurations through a web UI, which makes handling hundreds of monitored objects far less painful than editing flat config files.
Icinga Key Features
- Dependency views: Visualize relationships between monitored objects to quickly trace the root cause of cascading failures across your infrastructure.
- Distributed monitoring with clustering: Deploy Icinga across multiple nodes with built-in high availability, so there's no single point of failure in your monitoring setup.
- Metrics and log collection: Collect performance data and logs alongside health checks, giving you time-series context for diagnosing issues rather than just pass/fail status.
- Schedule-aware incident routing: Define on-call schedules and event rules to control exactly who gets notified and when, reducing unnecessary alert noise.
Icinga Integrations
Integrations include VMware, Kubernetes, Windows Server, MySQL, PostgreSQL, Elasticsearch, Grafana, Slack, PagerDuty, and Jira.
Pros and Cons
Pros:
- Highly customizable for various IT infrastructure needs
- Scalable for both small and large environments
- Free to use with no setup fees
Cons:
- Setup and configuration comes with a learning curve
- Occasional performance issues reported during high-load scenario
New Product Updates from Icinga
Icinga Introduces Contacts/Groups API
Icinga introduces the Contacts and Contact Groups REST API, enabling automated management of notification users and groups while keeping contact data consistent and synchronized across systems. For more information, visit Icinga's official site.
 .
.
Heimdal gives IT teams in businesses and enterprises a way to monitor network traffic, block threats, and secure endpoints with a focus on proactive threat detection and automated response.
Who Is Heimdal Best For?
Heimdal is a strong fit for mid-size to enterprise IT and security teams that need layered network protection across complex environments.
Why I Picked Heimdal
I picked Heimdal as one of the best because of how it approaches DNS security as a first line of defense rather than an afterthought. What I find genuinely impressive is Predictive DNS™—it uses machine learning and neural network modeling to predict and block malicious domains before they're even flagged by traditional threat intelligence feeds. In practice, my team can intercept threats at the DNS layer before any payload reaches an endpoint. I also like that the DNS Security Network module adds filtering directly to your local network infrastructure, so traffic doesn't need to reroute through external resolvers—a real advantage for hybrid and on-prem environments where latency and data sovereignty matter.
Heimdal Key Features
- Traffic logging tool: Logs all DNS traffic activity across your network so you can see exactly what devices are communicating with and flag suspicious behavior before it escalates.
- Host-Based Intrusion Prevention System (HIPS): Combines machine learning-based behavioral analysis with traffic filtering to detect and block intrusion attempts at the network level.
- Cloud Access Security Brokerage (CASB): Lets IT admins identify, classify, and block unsanctioned cloud apps accessing your environment, reducing shadow IT exposure.
- BYOD and IoT device coverage: Extends network protection to every device connected to your network—including personal devices and IoT equipment—without requiring endpoint agents.
Heimdal Integrations
Integrations include ConnectWise, Autotask, HaloPSA, Cisco Meraki, Microsoft 365, Microsoft Business, Blackpoint Cyber, Sophos, N-Able, and Patch My PC.
Pros and Cons
Pros:
- Detailed asset and license visibility
- Strong vulnerability and threat detection
- Automates patching across endpoints
Cons:
- Interface requires onboarding time
- No native integrations available

PRTG is a network monitoring platform built for IT teams and managed service providers who need to monitor complex infrastructures, spot issues fast, and keep business systems running smoothly.
Who Is PRTG Best For?
PRTG is a strong fit for mid-size to enterprise IT teams managing on-premises, cloud, or hybrid infrastructure across industries like healthcare, finance, and manufacturing.
Why I Picked PRTG
PRTG earns its spot on my shortlist because of how well it shifts network monitoring from reactive firefighting to genuine issue prevention. I particularly like the AI-driven anomaly detection, which continuously analyzes historical data to build intelligent baselines and flags deviations before they escalate into outages. On top of that, PRTG's customizable alert thresholds let my team fine-tune warning levels so we catch degrading conditions—like bandwidth creeping toward capacity—well before users notice anything. The smart sensor recommendations also surface monitoring gaps automatically, so nothing critical slips through undetected.
PRTG Key Features
- Sensor library: Choose from 250+ pre-configured sensor types covering SNMP, WMI, NetFlow, packet sniffing, and more to monitor virtually any device or protocol.
- Distributed monitoring: Monitor multiple remote locations from a single dashboard using remote probes, with TLS-encrypted communication between all components.
- Customizable reporting: Build and schedule reports using custom templates to share infrastructure status with stakeholders in a readable format.
- Real-time maps: Design live network maps with drag-and-drop tools that display current device and connection status across your entire infrastructure.
PRTG Integrations
Integrations include AWS, Microsoft Azure, VMware, Cisco, Dell EMC, NetApp, HPE, Oracle, Citrix, and Zoom. An HTTP API is also available for custom integrations.
Pros and Cons
Pros:
- Scalable for small and large networks
- Customizable monitoring and alerting
- User-friendly interface
Cons:
- More advanced features may come with a learning curve
- High cost for larger deployments
New Product Updates from PRTG
PRTG Introduces New Monitoring Sensors In Beta
This week, PRTG introduces three BETA sensors that broaden your monitoring scope for Proxmox VE clusters and SIMATIC S7-300/400 PLCs, giving you deeper operational insights. For more information, visit PRTG’s official site.
 .
.
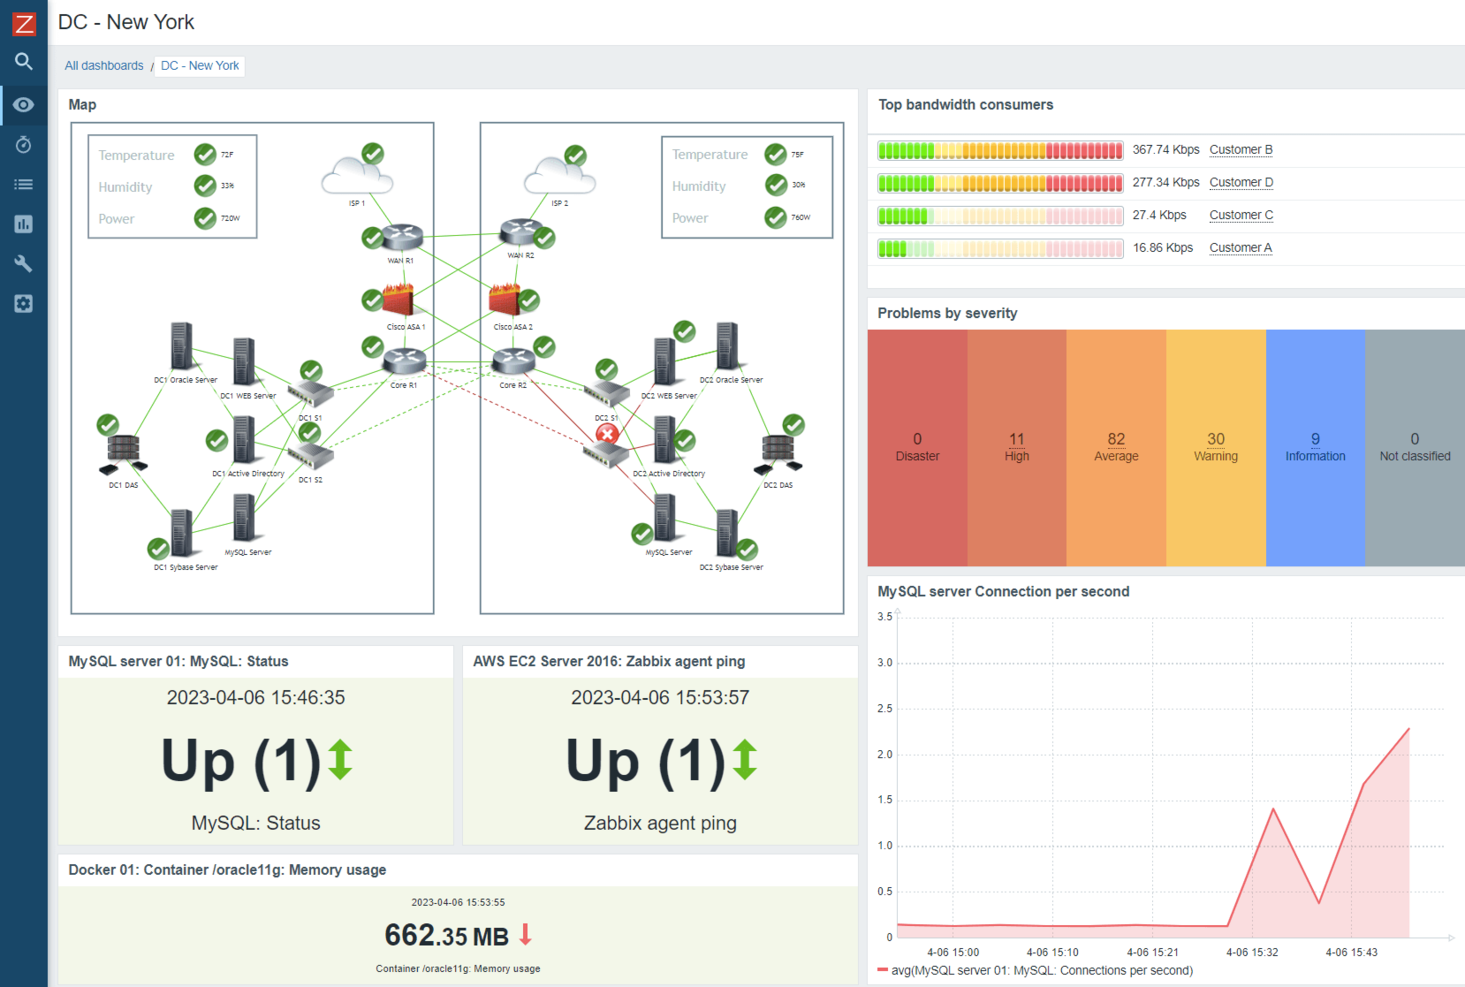
Site24x7 gives IT teams and managed service providers a unified platform to monitor network devices, servers, and cloud infrastructure, helping them detect outages, performance issues, and security threats across complex environments.
Who Is Site24x7 Best For?
Site24x7 is a good fit for mid-size to large IT teams managing mixed-vendor environments that span on-premises devices, cloud services, and remote infrastructure.
Why I Picked Site24x7
Site24x7 earns its spot on my shortlist because of how much ground it covers when it comes to device monitoring. I like that it supports over 450 device vendors using more than 15,000 device templates, which means my team can monitor routers, switches, firewalls, load balancers, and wireless controllers without needing separate tools for each vendor. Automated network discovery across IP ranges and CIDR blocks also reduces setup time—devices get detected and mapped without manual input. Support for NetFlow, sFlow, and J-Flow gives my team interface-level traffic visibility that is useful when tracking down congestion or unusual bandwidth patterns.
Site24x7 Key Features
- Network configuration management: Automate configuration backups, detect unauthorized changes, identify firmware vulnerabilities, and track compliance from a single console.
- SNMP trap processing: Receive instant alerts from network devices using SNMP traps to catch failures and abnormal behavior in real time.
- SDN and SD-WAN monitoring: Get end-to-end visibility into software-defined networks, including Cisco Meraki, Cisco ACI, and VMware VeloCloud SD-WAN environments.
- IP address management: Automatically discover and manage your entire IP space, track usage, prevent conflicts, and plan subnets with real-time insights.
Site24x7 Integrations
Integrations include ServiceNow, PagerDuty, Opsgenie, Jira, ManageEngine AlarmsOne, ConnectWise Manage, Zoho Desk, Zendesk, Slack, and Microsoft Teams.
Pros and Cons
Pros:
- Comprehensive monitoring capabilities
- Real-time alerts and notifications
- Customizable dashboards and reports
Cons:
- Complexity in initial setup for large environments
- Limited customization in alerting mechanisms
New Product Updates from Site24x7

Site24x7 Enhances Network Monitoring With Device and Visibility Updates
Site24x7 introduces proactive hardware health monitoring, expanded device support, centralized network controls, and enhanced SD-WAN visualization to improve network monitoring and management. For more information, visit Site24x7’s official site.
 .
.
Netdata gives IT teams and infrastructure specialists a way to monitor complex networks and systems with live metrics, customizable dashboards, and instant alerts, helping them spot and resolve performance issues across distributed environments.
Who Is Netdata Best For?
Netdata is a strong fit for DevOps and infrastructure teams managing large-scale or distributed environments who need granular, real-time visibility into system and network performance.
Why I Picked Netdata
Netdata earns its spot as one of the best on my shortlist because of how it handles real-time infrastructure monitoring at a granularity most tools don't match. I love that it collects every metric every second with zero sampling—so when something spikes at 2 am, I'm not looking at a 60-second average that smooths over the problem. The Anomaly Advisor uses 18 ML models per metric to cut false positives, which means my team isn't chasing noise. I also find the algorithmic dashboards genuinely useful—they auto-generate for every metric and node without any manual setup, so there's no dashboard backlog to work through before you get visibility.
Netdata Key Features
- Alert notifications: Configure health alerts with multi-level thresholds and route them to Slack, PagerDuty, email, or other channels.
- Distributed data collection: Deploy lightweight agents across nodes to collect metrics locally without routing all data through a central server.
- Infrastructure inventory: View and filter all monitored nodes, services, and containers in a single searchable list with live status indicators.
- Log management: Collect, parse, and explore logs alongside metrics in the same interface to correlate events with performance changes.
Netdata Integrations
Integrations include AWS, Azure, Google Cloud Platform, Docker, Kubernetes, Slack, PagerDuty, Microsoft Teams, Prometheus, and Grafana.
Pros and Cons
Pros:
- Automated alerts
- Unlimited metric monitoring
- Interactive graphs for data visualization
Cons:
- May come with a learning curve to maximize its features
- Insights could be more comprehensive

If you need deep visibility into network traffic, Wireshark is a trusted choice for packet-level analysis. Security analysts, network engineers, and IT teams use it to capture and inspect data packets in real time, helping them troubleshoot complex network issues and investigate security incidents. Its detailed protocol decoding and filtering capabilities set it apart for anyone who needs granular insight into network behavior.
Who Is Wireshark Best For?
Network engineers and security analysts in organizations of all sizes across technical and regulated industries. It fits teams that require detailed packet analysis to troubleshoot network performance and security issues.
Why I Picked Wireshark
For teams that need to analyze network traffic at the packet level, Wireshark is unmatched in its depth and precision. I picked it because it lets you capture live network data and drill down into individual packets, which is essential for diagnosing complex network problems and identifying security threats. Its protocol decoding covers hundreds of protocols, giving you detailed visibility into what’s happening on your network. The built-in filtering and search tools make it possible to isolate specific traffic patterns or anomalies quickly.
Wireshark Key Features
In addition to its packet-level inspection capabilities, Wireshark offers several other features that support network monitoring:
- Color-Coded Packet Display: Highlights different types of traffic for easier visual analysis.
- Packet Reassembly: Reconstructs TCP streams and fragmented packets for complete session views.
- Extensive Export Options: Allows you to export captured data in multiple formats for further analysis or reporting.
- Command-Line Utilities: Includes tools like tshark for automated or remote packet capture and analysis.
Wireshark Integrations
Integrations include tcpdump, Tshark, WinPcap, AirPcap, and Dumpcap. APIs are also available.
Pros and Cons
Pros:
- Can decrypt SSL/TLS encrypted traffic, allowing for deeper analysis
- Can generate statistical reports and graphs to visualize network traffic patterns
- Can analyze network flows and provide insights into traffic patterns
Cons:
- May consume a significant amount of system resources
- Requires a good understanding of network protocols and packet analysis
Dynatrace gives IT teams and enterprises deep visibility into network performance, application dependencies, and infrastructure health, helping them identify and resolve issues faster across hybrid and cloud-native environments.
Who Is Dynatrace Best For?
Dynatrace is a strong fit for large enterprises and DevOps teams managing complex, multi-cloud or hybrid infrastructures that demand deep, automated observability.
Why I Picked Dynatrace
Dynatrace earns its spot on my shortlist because of how well it handles network monitoring across genuinely complex environments—multi-cloud, hybrid, and on-premises all at once. I particularly like the Smartscape topology mapping, which automatically discovers and visualizes dependencies between apps, services, and the underlying network in real time. When something breaks, I'm not manually tracing connections across a dozen dashboards. Dynatrace's AI-driven root cause analysis, powered by Davis AI, pinpoints the exact source of a network issue rather than flooding you with alerts to sort through yourself.
Dynatrace Key Features
- OneAgent deployment: A single agent installs on any host and automatically collects metrics, logs, traces, and network data across your full stack without manual configuration.
- NetFlow and SNMP trap monitoring: Captures network traffic flow data and SNMP traps to give you granular visibility into device-level activity and traffic patterns.
- OpenPipeline data processing: Ingests, enriches, and contextualizes data streams in real time before storage, so network events are pre-processed and ready for immediate analysis.
- AutomationEngine remediation: Triggers automated responses to detected network issues, including auto-remediation workflows and real-time CMDB updates.
Dynatrace Integrations
Integrations include Jira, Slack, GitHub Copilot, PagerDuty, Cursor IDE, JetBrains, Windsurf, and an API is available for custom integrations.
Pros and Cons
Pros:
- Alerting and notification for network outages
- Capacity planning and forecasting for network resources
- Can analyze network latency and packet loss
Cons:
- Pricing structure is complex
- No free plan

LogicMonitor is a cloud-based network monitoring platform built for IT teams and managed service providers who need deep visibility, automated discovery, and real-time insights across complex hybrid infrastructure.
Who Is LogicMonitor Best For?
LogicMonitor is a strong fit for mid-to-large enterprises and managed service providers that oversee distributed, hybrid, or multi-cloud infrastructure at scale.
Why I Picked LogicMonitor
LogicMonitor earns its spot on my shortlist because of how well it handles cloud-based network monitoring across hybrid environments. I like that it uses automated device discovery to pull in network devices, cloud resources, and servers without manual configuration—something that saves time when onboarding new infrastructure. My team is able to set up dynamic dashboards that surface performance metrics across AWS, Azure, and on-premises systems in a single view. The AIOps-driven alerting also cuts through noise by correlating related alerts, so we're not chasing false positives during high-traffic periods.
LogicMonitor Key Features
- NetFlow analytics: Monitors traffic patterns across devices, apps, and protocols to identify bandwidth usage and top talkers across the network.
- Dynamic topology mapping: Automatically generates visual maps of network device relationships and dependencies to support faster root cause analysis.
- Capacity forecasting: Uses AI-powered forecasting to predict resource usage trends and flag potential bottlenecks before they affect performance.
- Role-based dashboards and reporting: Lets you build custom views for different teams—NOC, leadership, or customers—with scheduled automated reports.
LogicMonitor Integrations
Integrations include AWS, Azure, Google Cloud Platform, Kubernetes, Juniper, Apache Tomcat, PostgreSQL, Linux, Puppet, and F5.
Pros and Cons
Pros:
- Auto-discovery abilities are fast
- Portal functionality and uptime are great
- Easy setup process
Cons:
- Fewer customization options for user interfaces
- No free version
Datadog offers network monitoring designed with small businesses and lean IT teams in mind. Its cloud-based platform brings together network performance data, device health, and traffic flow in a single, easy-to-navigate dashboard. For teams that need quick setup and clear visibility without heavy infrastructure, Datadog helps you pinpoint issues and optimize network resources fast.
Who Is Datadog Best For?
IT and DevOps teams in small to mid-sized digital businesses and SaaS providers. It supports organizations that want integrated monitoring of network performance alongside cloud and application metrics.
Why I Picked Datadog
When I looked for a network monitoring tool that fits small business needs, Datadog stood out for its straightforward deployment and cloud-native design. Its auto-discovery feature quickly maps out devices and network paths, so you don’t have to spend hours on manual setup. Datadog’s real-time network performance monitoring gives you instant visibility into traffic bottlenecks and device health. For small teams that need actionable insights without a steep learning curve, Datadog offers a focused, accessible solution.
Datadog Key Features
Some other features that make Datadog useful for network monitoring include:
- Flow Analytics: Tracks and analyzes network traffic between hosts, containers, and services.
- Custom Dashboards: Lets you build visualizations tailored to your network monitoring needs.
- Alerting and Notification Rules: Sends alerts based on custom thresholds for network metrics.
- Integration with Cloud Providers: Connects directly to AWS, Azure, and Google Cloud for unified network visibility.
Datadog Integrations
Integrations include Active Directory, Airflow, Bitbucket, Bugsnag, Cassandra, CrowdStrike, GitHub, and GitLab.
Pros and Cons
Pros:
- Offers scalable monitoring capabilities
- Provides historical data for trend analysis
- Supports multi-cloud and hybrid environments
Cons:
- Data retention periods may be shorter than desired
- Monitoring for Microsoft Azure tools can be complex
Zabbix is an open-source network monitoring platform built for IT teams and enterprises who need to monitor complex, distributed infrastructure and detect network issues before they impact business operations.
Who Is Zabbix Best For?
Zabbix is a strong fit for mid-to-large enterprises and managed service providers that need a scalable, open-source monitoring solution for complex, multi-layered IT infrastructure.
Why I Picked Zabbix
Zabbix earns its spot on my shortlist because no other open-source monitoring tool comes close to matching its breadth of built-in capabilities. I'm particularly impressed by how it handles metric collection—it supports SNMP v1/2c/3, IPMI, JMX, ICMP, Modbus, MQTT, and Prometheus out of the box, which means my team can monitor network devices, IoT sensors, cloud services, and databases from a single platform without stitching together separate tools. I also rely heavily on its auto-discovery engine, which scans IP ranges, detects network interfaces, and automatically creates items, triggers, and graphs for discovered hosts. On top of that, the built-in trend prediction and baseline anomaly detection let my team catch capacity issues before they become outages—something that's genuinely hard to find in a free, self-hosted solution.
Zabbix Key Features
- Customizable dashboards: Build visual dashboards using drag-and-drop widgets to display real-time network health, graphs, and maps tailored to your team's needs.
- Flexible alerting and escalations: Configure multi-step escalation policies that trigger notifications via email, SMS, Slack, or custom scripts based on defined thresholds.
- Network topology maps: Create live network maps that reflect the real-time status of connected devices, links, and dependencies across your infrastructure.
- Distributed monitoring with proxies: Deploy Zabbix proxies to collect monitoring data from remote locations and forward it to a central server without opening inbound firewall rules.
Zabbix Integrations
Integrations include AWS, Microsoft Azure, Cisco, VMware, Slack, Jira, ServiceNow, Dell, IBM, and Oracle.
Pros and Cons
Pros:
- 300+ templates for most popular hardware network vendors
- Active community because of being open-source
- Can define notification methods (SMS, on-screen, or email) when thresholds exceed
Cons:
- Need more templates for rich monitoring
- Needs more documentation resources

SysAid is an IT Service Management (ITSM) platform that also includes tools for monitoring and managing IT infrastructure as part of broader service operations. It helps IT teams track system health, surface issues, and respond to alerts by tying infrastructure data directly into incident and service management workflows. This approach supports better visibility and faster response without relying on disconnected monitoring tools.
Who Is SysAid Best For?
IT service management teams in mid-sized organizations across regulated and service-oriented industries. It fits companies that want network monitoring integrated with service desk workflows and AI-supported insights.
Why I Picked SysAid
SysAid stands out for its use of AI to deliver actionable network insights that go beyond basic monitoring. The platform’s AI-driven analytics help IT teams detect anomalies, predict potential issues, and automate responses before problems escalate. I appreciate how SysAid’s intelligent automation can reduce manual intervention by surfacing root causes and suggesting fixes. For organizations that want to move from reactive to proactive network management, these AI capabilities make SysAid a compelling option.
SysAid Key Features
In addition to its AI-driven analytics, I also found these features useful for network monitoring:
- Customizable Dashboards: Lets you tailor network monitoring views to highlight the most relevant metrics for your team.
- Automated Ticketing Integration: Automatically creates and updates tickets based on network events and alerts.
- Asset Discovery and Inventory: Scans and catalogs all connected devices for a complete network inventory.
- Remote Control Tools: Provides direct access to endpoints for troubleshooting and support without leaving the platform.
SysAid Integrations
Integrations include Microsoft Teams, Slack, Salesforce, Google Workspace, Microsoft 365, Azure Active Directory, Jira, and more.
Pros and Cons
Pros:
- Integrates incident management with alerts
- Real-time monitoring of IT assets
- Proactive alerts ensure timely issue detection
Cons:
- Interface outdated in some areas
- Limited analytics depth for reporting
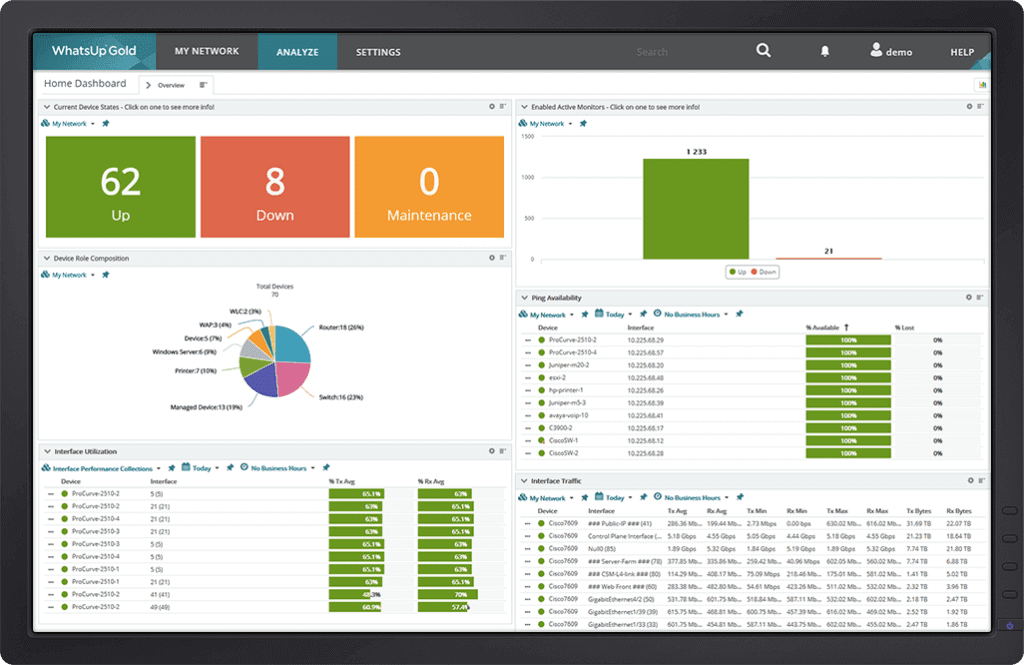
WhatsUp Gold gives IT teams and network administrators a unified platform to monitor, visualize, and manage complex network environments, helping organizations quickly detect issues and maintain uptime across devices, servers, and applications.
Who Is WhatsUp Gold Best For?
WhatsUp Gold is a strong fit for mid-size to large IT teams that need full visibility across on-premises, cloud, and hybrid network environments.
Why I Picked WhatsUp Gold
WhatsUp Gold is on my shortlist because it covers more monitoring ground in a single platform than most tools I've tested. I particularly like the topology-aware alerting, which understands network dependencies so my team gets meaningful alerts instead of a flood of noise when one upstream device causes a cascade of downstream failures. I use the Layer 2/3 interactive maps daily; they auto-update as devices change, so I see an accurate picture of connectivity and dependencies rather than a stale diagram. It also includes built-in NetFlow/IPFIX traffic analysis, so I don't need a separate tool to track bandwidth hogs or spot suspicious lateral movement across the network.
WhatsUp Gold Key Features
- Automated network discovery: Scans your network using Layer 2/3 discovery to identify every connected device, collecting details like device type, vendor, serial number, and firmware.
- Log management: Ingests Windows Event Logs and Syslogs from across your network, with custom filters, saved searches, and compliance-ready archiving built into the same interface.
- Hardware health monitoring: Tracks server room temperature, fan status, power supply health, and storage disk health using SNMP and Redfish BMC support to catch failures before they cause downtime.
- Configurable alert center: Consolidates all network and server performance alerts into a single dashboard with threshold-based triggers, smart prioritization, and multi-channel notification routing.
WhatsUp Gold Integrations
Integrations include Cisco, Fortinet, CyberPower, NetApp, Microsoft SQL Server, Palo Alto Networks, AWS, Microsoft Azure, VMware, and Dell.
Pros and Cons
Pros:
- Extensive support for different protocols and vendors
- Customizable dashboards and reports
- User-friendly interface
Cons:
- Complex deployment and configuration process
- Occasional bugs or stability issues
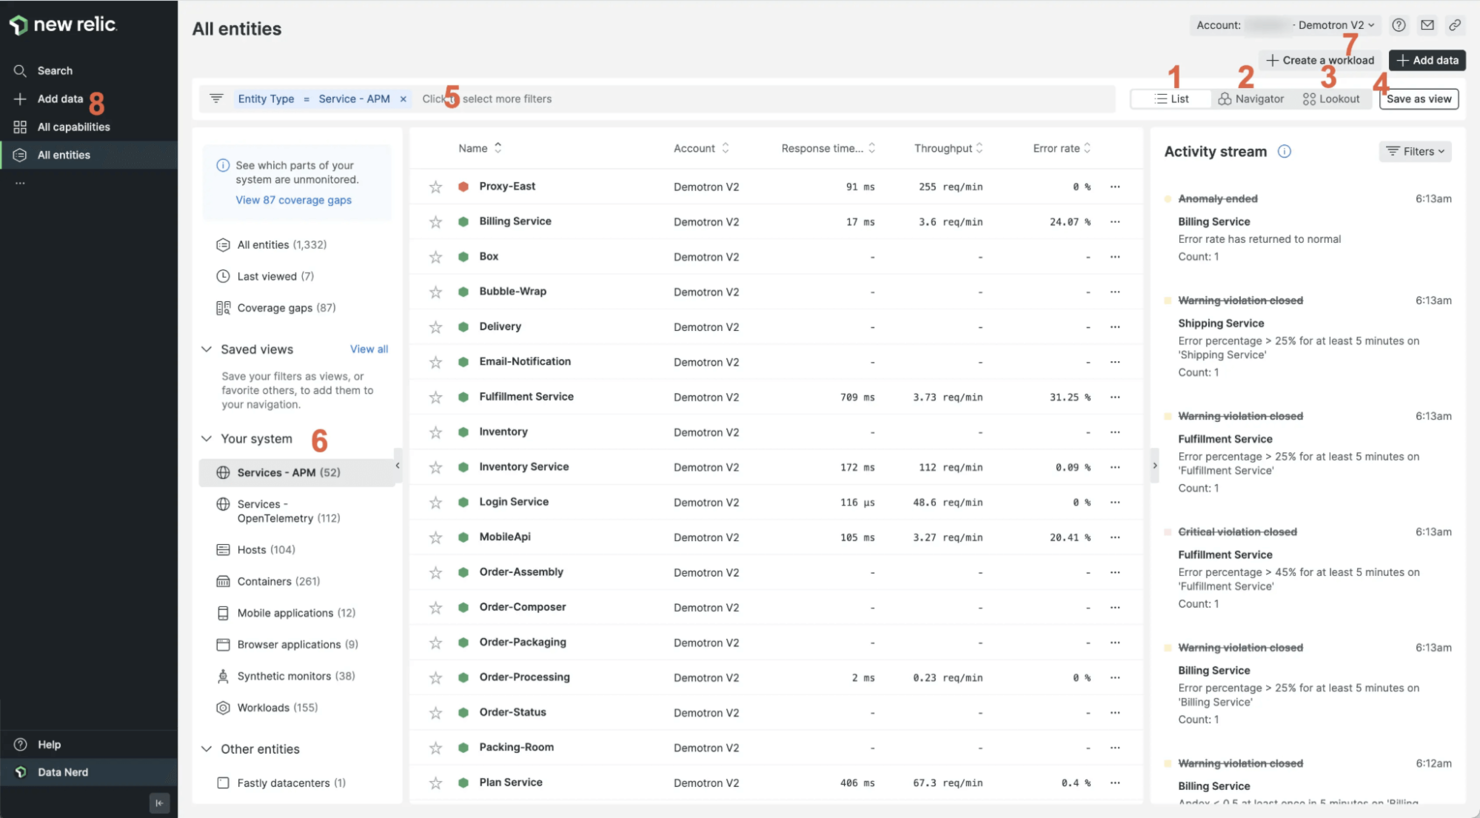
If you need deep visibility and granular control over complex systems, New Relic is built for advanced users and technical teams. Its unified observability platform brings together application, infrastructure, and network monitoring in one place. For organizations with demanding environments and a need for custom analytics, New Relic offers flexible querying and real-time insights across distributed architectures.
Who Is New Relic Best For?
Site reliability engineers and advanced DevOps teams in mid-sized to enterprise technology organizations. It fits companies that require detailed observability across networks, applications, and cloud services.
Why I Picked New Relic
For teams that want to go beyond basic monitoring, New Relic stands out with its advanced analytics and customizable dashboards. I picked New Relic because it lets you write custom queries using NRQL, so you can dig into network data and spot patterns that matter to your environment. Its distributed tracing and real-time network performance monitoring help advanced users troubleshoot issues across complex, multi-cloud architectures. If you need a tool that supports deep dives and tailored observability, New Relic is built for that level of technical control.
New Relic Key Features
Some other features that make New Relic valuable for network monitoring include:
- Synthetic Monitoring: Simulates user traffic to test network and application performance from multiple locations.
- Alert Policies: Lets you define custom thresholds and automated responses for network incidents.
- Infrastructure Health Maps: Visualizes the status of network components and dependencies in real time.
- Log Management: Centralizes and indexes logs from network devices for fast search and correlation.
New Relic Integrations
Integrations include Ruby, Elixir, Cassandra, CentOS, Couchbase, Debian, Nagios, and OpenAI Observability. APIs are also available.
Pros and Cons
Pros:
- Customizable dashboards where you can visualize and analyze your data
- Can centralize and manage your application logs
- Generates visual service maps that show how different services in your application architecture are related
Cons:
- High license costs
- May take time for users to become proficient in navigating and utilizing all the features
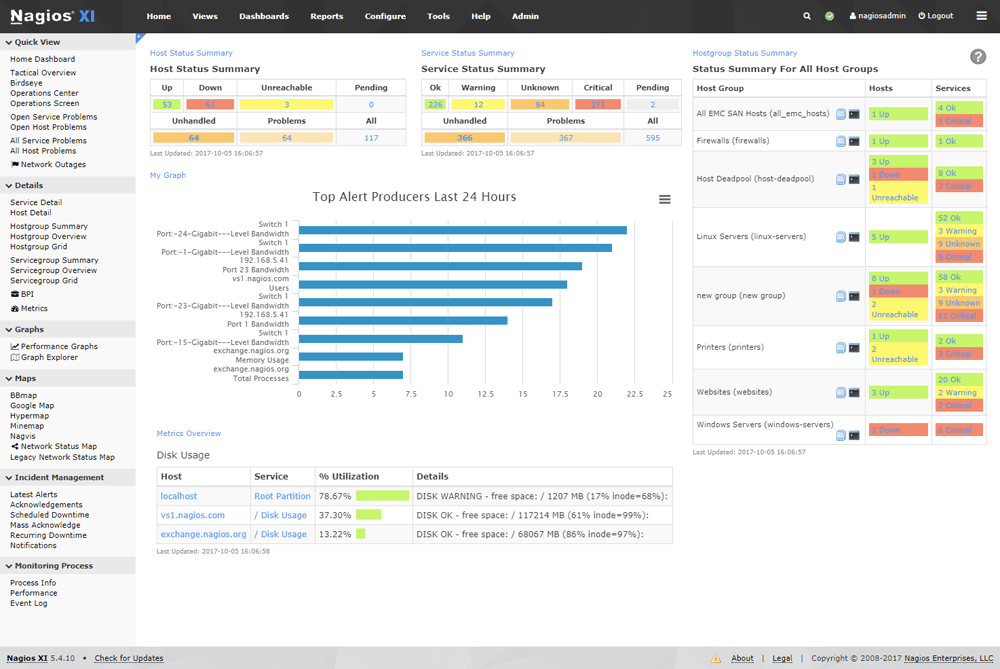
Nagios XI stands out for IT teams in large enterprises that need deep customization and scalability in their network monitoring. Its modular architecture and extensive plugin library let you tailor monitoring to complex, multi-site environments. If you’re managing a diverse infrastructure with strict uptime requirements, Nagios XI gives you granular control over checks, notifications, and reporting.
Who Is Nagios XI Best For?
IT infrastructure teams and network engineers in enterprise and public sector organizations. It suits companies that require configurable, enterprise-grade monitoring with broad infrastructure coverage.
Why I Picked Nagios XI
When you’re supporting enterprise-scale infrastructure, flexibility and depth are essential. I picked Nagios XI because it offers a modular design and a vast library of plugins, which let you monitor nearly any device, service, or application in a large, distributed environment. Its advanced notification and escalation workflows help large teams coordinate responses to incidents across multiple departments or locations. For organizations with complex requirements and a need for granular monitoring, Nagios XI delivers the customization and scalability that enterprise IT teams expect.
Nagios XI Key Features
Some other features that make Nagios XI appealing for enterprise network monitoring include:
- Automated Configuration Wizards: Step-by-step wizards help you quickly set up monitoring for common devices and services.
- Capacity Planning Reports: Built-in reporting tools let you analyze trends and forecast resource needs.
- Multi-Tenant User Management: Role-based access controls support multiple teams or departments within a single deployment.
- SNMP Trap Integration: Collects and processes SNMP traps from network devices for real-time event monitoring.
Nagios XI Integrations
Integrations include Fedora, FreeBSD, MongoDB, Selenium, ServiceNow, VMWare, and openSUSE. APIs are also available.
Pros and Cons
Pros:
- Can automate tasks like configuring checks, generating reports, and performing system maintenance
- Monitor and analyze log entries to identify errors and anomalies
- Can customize your dashboards and reports with widgets and charts
Cons:
- Mobile app has limited features
- Steep learning curve
Weitere Netzwerküberwachungssoftware-Optionen
Hier sind einige zusätzliche Optionen, aus denen Sie auswählen können. Auch wenn sie es nicht in die Top 12 geschafft haben, sind sie dennoch eine Überlegung wert:
- Prometheus
Free network monitoring tool
- Munin Monitoring
Free option
- Zenoss
For hybrid IT infrastructure monitoring
- OPSWAT Security Score
For Windows security scans
- Syncro
For unlimited endpoint monitoring
- ManageEngine Applications Manager
For application monitoring
- Dotcom Monitor
For multi-step API & web testing
- Spiceworks
For non-technical users
- NetCrunch
For hybrid IT infrastructure monitoring
- NMap
For automatic discovery and security audits


Ähnliche Reviews
- Netzwerküberwachungssoftware
- Serverüberwachungssoftware
- SD-Wan-Lösungen
- Infrastrukturüberwachungstools
- Paket-Sniffer
- Applikationsüberwachungstools
Auswahlkriterien für Netzwerküberwachungssoftware
Beim Auswählen der besten Netzwerküberwachungssoftware für diese Liste habe ich die üblichen Anforderungen und Herausforderungen von Käufern wie Netzwerksichtbarkeit und Echtzeitwarnungen berücksichtigt. Außerdem habe ich das folgende Bewertungssystem verwendet, um meine Einschätzung strukturiert und objektiv zu gestalten:
Kernfunktionen (25% der Gesamtbewertung)
Um in diese Liste aufgenommen zu werden, musste jede Lösung die folgenden Einsatzszenarien abdecken:
- Überwachung der Netzwerkleistung
- Erkennung von Netzausfällen
- Echtzeitbenachrichtigungen bereitstellen
- Analyse der Bandbreitennutzung
- Verfolgung des Gerätestatus
Zusätzliche herausragende Funktionen (25% der Gesamtbewertung)
Um die Auswahl weiter einzugrenzen, habe ich auch nach besonderen Funktionen gesucht, wie zum Beispiel:
- KI-gestützte Analysen
- Anpassbare Dashboards
- Automatisierte Netzwerktopologiekarten
- Prädiktive Analysen
- Integration mit Cloud-Diensten
Benutzerfreundlichkeit (10% der Gesamtbewertung)
Um ein Gefühl für die Benutzerfreundlichkeit der jeweiligen Systeme zu bekommen, habe ich Folgendes betrachtet:
- Intuitives Oberflächendesign
- Einfache Navigation
- Minimale Einarbeitungszeit
- Anpassungsmöglichkeiten
- Responsives Design
Onboarding (10% der Gesamtbewertung)
Um das Onboarding-Erlebnis jeder Plattform zu bewerten, habe ich Folgendes berücksichtigt:
- Verfügbarkeit von Schulungsvideos
- Interaktive Produkttouren
- Zugriff auf Vorlagen
- Webinare für neue Nutzer
- Unterstützende Chatbots
Kundensupport (10% der Gesamtbewertung)
Um die Kundensupport-Dienste jedes Softwareanbieters zu bewerten, habe ich folgende Punkte berücksichtigt:
- 24/7-Support-Verfügbarkeit
- Mehrere Support-Kanäle
- Zugriff auf eine Wissensdatenbank
- Reaktionszeit auf Anfragen
- Verfügbarkeit von Live-Chat
Preis-Leistungs-Verhältnis (10% der Gesamtbewertung)
Um das Preis-Leistungs-Verhältnis jeder Plattform einzuschätzen, habe ich folgende Aspekte betrachtet:
- Wettbewerbsfähige Preisgestaltung
- Im Grundpreis enthaltene Funktionen
- Skalierbarkeit der Preismodelle
- Rabatte bei jährlicher Abrechnung
- Verfügbarkeit einer kostenlosen Testversion
Kundenbewertungen (10% der Gesamtbewertung)
Um einen Eindruck von der allgemeinen Kundenzufriedenheit zu bekommen, habe ich beim Lesen von Kundenbewertungen Folgendes berücksichtigt:
- Allgemeine Zufriedenheitsbewertungen
- Feedback zur Zuverlässigkeit
- Erfahrungen der Nutzer mit dem Support
- Kommentare zur Benutzerfreundlichkeit
- Meinungen zur Effektivität der Funktionen
Wie wählt man Netzwerküberwachungssoftware aus?
Es ist leicht, sich in langen Funktionslisten und komplexen Preisstrukturen zu verlieren. Damit Sie bei Ihrem individuellen Auswahlprozess den Überblick behalten, finden Sie hier eine Checkliste mit wichtigen Faktoren:
| Faktor | Worauf zu achten ist |
|---|---|
| Skalierbarkeit | Kann die Software mit Ihrem Unternehmen wachsen? Berücksichtigen Sie zukünftige Anforderungen und ob das Tool mit erhöhten Datenmengen und Geräten umgehen kann, ohne dass Leistungseinbußen entstehen. |
| Integrationen | Prüfen Sie die Kompatibilität mit bestehenden Tools. Achten Sie auf einen nahtlosen Datenfluss zwischen Systemen. Bevorzugen Sie Software, die sich mit Ihren wichtigsten Plattformen wie CRM oder ERP verbindet. |
| Anpassbarkeit | Achten Sie auf Flexibilität bei Dashboards und Berichten. Können Sie die Software an Ihre Arbeitsabläufe anpassen? Vermeiden Sie Tools mit starren Strukturen, die sich nicht Ihren Bedürfnissen anpassen lassen. |
| Benutzerfreundlichkeit | Beachten Sie die Lernkurve Ihres Teams. Ist die Benutzeroberfläche intuitiv? Tools, die umfassende Schulungen erfordern, können die Einführung und Produktivität verlangsamen. |
| Implementierung und Onboarding | Bewerten Sie den Einrichtungsprozess und den notwendigen Aufwand. Wie lange dauert es, bis Sie voll einsatzbereit sind? Berücksichtigen Sie die Verfügbarkeit von Schulungsmaterial und Support beim Onboarding. |
| Kosten | Vergleichen Sie verschiedene Preismodelle. Gibt es versteckte Gebühren oder Zusatzkosten für wichtige Funktionen? Stellen Sie sicher, dass das gewählte Modell jetzt und bei zukünftigem Wachstum in Ihr Budget passt. |
| Sicherheitsmaßnahmen | Bewerten Sie den Schutz Ihrer Daten. Entspricht die Software den Branchenstandards? Achten Sie auf Verschlüsselung, Zugriffskontrollen und regelmäßige Sicherheitsupdates, um sensible Informationen zu schützen. |
Was ist Netzwerküberwachungssoftware?
Netzwerküberwachungssoftware wird von IT-Experten und Systemadministratoren genutzt, um die Leistung und Verfügbarkeit von Netzwerkkomponenten zu überwachen und zu verwalten – oft in Zusammenarbeit mit WAN-Optimierungsanbietern, um einen reibungslosen und effizienten Ablauf der Systeme sicherzustellen.
Echtzeit-Benachrichtigungen, Bandbreitenanalysen und Geräte-Tracking helfen dabei, Probleme zu erkennen, die Performance zu optimieren und die Netzwerkintegrität zu erhalten. Netzwerkkartierungs-Tools ergänzen diese Überwachungsfunktionen, indem sie visuelle Darstellungen der Netzwerktopologie und der Gerätebeziehungen liefern. Insgesamt bieten diese Werkzeuge wesentliche Einblicke, die die Zuverlässigkeit und Sicherheit des Netzwerks erhöhen.
Funktionen
Beim Vergleich von Netzwerküberwachungssoftware sollten Sie besonders auf folgende Schlüsselfunktionen achten:
- Echtzeit-Netzwerküberwachung: Mit dieser Funktion können Sie Live-Daten zur Netzwerkleistung und zum Gerätezustand einsehen. Dadurch erkennen Sie plötzliche Ausfälle oder Verlangsamungen sofort und können schnell handeln, anstatt überrascht zu werden.
- Anpassbare Benachrichtigungen: Erstellen Sie individuelle Benachrichtigungen basierend auf Leistungsgrenzwerten oder bestimmten Vorfällen. Diese Warnungen helfen Ihnen, auf Probleme zu reagieren, bevor sie sich zu größeren Schwierigkeiten entwickeln.
- Umfassende Berichte: Erhalten Sie detaillierte Berichte, die Netzwerkaktivitäten, Leistungstrends und den Gerätestatus zusammenfassen. Mit diesen Einblicken können Sie Problemstellen identifizieren und Verbesserungen Ihrem Team (oder Chef!) präsentieren.
- Geräteerkennung und -zuordnung: Die Software scannt und identifiziert automatisch Geräte, die mit Ihrem Netzwerk verbunden sind. Diese Übersicht erleichtert es Ihnen, neue oder unerwartete Geräte im Blick zu behalten und stärkt die Netzwerksicherheit.
- Analyse der Bandbreitennutzung: Überwachen Sie, welche Geräte oder Anwendungen die meiste Bandbreite beanspruchen. Das hilft, Engpässe zu lösen und eine faire Nutzung sicherzustellen, damit alle zufrieden bleiben.
- Historische Datenaufbewahrung: Sehen Sie sich vergangene Netzwerkleistungsdaten an, um wiederkehrende Probleme oder langfristige Trends aufzudecken. Mit diesen Daten sind Sie besser gerüstet, um Upgrades zu planen und erneute Ausfälle zu verhindern.
- Kompatibilität mit mehreren Anbietern: Unterstützung für Hard- und Software verschiedener Anbieter ermöglicht Ihnen die Überwachung des gesamten Netzwerks, auch wenn Ihre Geräte von unterschiedlichen Herstellern stammen.
- Remote-Überwachungsfunktionen: Greifen Sie von überall sicher auf Ihr Netzwerküberwachungs-Dashboard zu. So behalten Sie die Kontrolle, egal ob im Büro oder im Homeoffice.
- Automatisierte Fehlerbehebungs-Tools: Nutzen Sie integrierte Diagnosen, die Empfehlungen geben oder sogar grundlegende Probleme selbstständig beheben. Das spart Zeit und hilft, gängige Fehler zu lösen, ohne manuell tiefer einzutauchen.
Vorteile
Die Implementierung von Netzwerküberwachungssoftware bietet zahlreiche Vorteile für Ihr Team und Ihr Unternehmen. Hier sind einige, auf die Sie sich freuen können:
- Skalierbarkeit: Automatisierte Netzwerkzuordnung und flexible Funktionen unterstützen wachsende Unternehmen, indem sie sich an erhöhte Anforderungen anpassen. Ein wichtiger Beitrag zu den strategischen Zielen einer Organisation.
- Verbesserte Netzzuverlässigkeit: Echtzeitwarnungen und prädiktive Analysen helfen, Ausfallzeiten zu vermeiden, indem Probleme behoben werden, bevor sie eskalieren.
- Erhöhte Sicherheit: Anomalieerkennung und Geräteverfolgung identifizieren potenzielle Bedrohungen und Schwachstellen und halten Ihr Netzwerk sicher.
- Optimierte Leistung: Die Bandbreitenanalyse sorgt für eine effiziente Ressourcennutzung und reibungslosere Netzwerkabläufe.
- Fundierte Entscheidungsfindung: Anpassbare Dashboards liefern maßgeschneiderte Einblicke, die bei der strategischen Planung und Verwaltung unterstützen.
- Reduzierte Betriebskosten: Proaktive Überwachung reduziert den Bedarf an Notfallreparaturen und senkt das Risiko teurer Ausfälle.
- Besseres Benutzererlebnis: Synthetisches Monitoring sorgt dafür, dass Dienste verfügbar und leistungsfähig bleiben – zur Zufriedenheit der Nutzer.
Kosten & Preise
Die Auswahl einer Netzwerküberwachungssoftware erfordert ein Verständnis der verschiedenen Preisstrukturen und verfügbaren Pläne. Die Kosten variieren je nach Funktionsumfang, Teamgröße, Add-ons und mehr. Die folgende Tabelle fasst gängige Pläne, deren durchschnittliche Preise und typische Merkmale von Netzwerküberwachungslösungen zusammen:
Vergleichstabelle für Netzwerküberwachungssoftware
| Plan-Typ | Durchschnittlicher Preis | Häufige Funktionen |
|---|---|---|
| Gratis-Tarif | $0 | Grundlegende Überwachungsfunktionen, eingeschränkte Warnmeldungen und Community-Support. |
| Persönlicher Tarif | $5-$25/user/month | Echtzeitwarnungen, anpassbare Dashboards und Basisberichte. |
| Geschäftstarif | $30-$75/user/month | Erweiterte Analysen, verbesserte Sicherheitsfunktionen und Integrationsmöglichkeiten. |
| Enterprise-Tarif | $100-$250/user/month | Umfassende Überwachung, Prioritätssupport, prädiktive Analysen und umfangreiche Anpassungsoptionen. |
FAQs zur Netzwerküberwachungssoftware
Hier finden Sie Antworten auf häufig gestellte Fragen zur Netzwerküberwachung und zu Netzwerküberwachungstools.
Was überwacht eine Netzwerküberwachungssoftware eigentlich?
Wie verbessert Netzwerküberwachung die Sicherheit?
Kann sie sowohl lokale Netzwerke als auch Cloud-Netzwerke überwachen?
Welche Vorteile bieten automatisierte Alarme bei der Netzwerküberwachung?
Wie oft sollte die Netzwerkleistung überprüft werden?
Wie geht es weiter:
Wenn Sie derzeit Netzwerküberwachungssoftware recherchieren, verbinden Sie sich mit einem SoftwareSelect-Berater, um kostenlose Empfehlungen zu erhalten.
Sie füllen ein Formular aus und führen ein kurzes Gespräch, in dem Ihre spezifischen Anforderungen besprochen werden. Anschließend erhalten Sie eine Auswahlliste passender Software. Sie werden sogar während des gesamten Kaufprozesses unterstützt, einschließlich Preisverhandlungen.