

LogicMonitor Review 2026: Pros, Cons, Features, and Pricing
LogicMonitor stands out for its deep automation and scalability, making it ideal for complex cloud environments, but may be less suited for smaller teams seeking simpler monitoring tools.

We review tools independently, and commissions help fund our testing. See our transparency policy, our methodology, or suggest a tool.
LogicMonitor is a cloud infrastructure monitoring tool built for IT teams that need unified visibility across hybrid environments, covering networks, servers, cloud services, and applications from a single platform. I'd consider it over Datadog if your infrastructure includes a significant number of on-premises network devices alongside cloud resources, since LogicMonitor's out-of-the-box support for network infrastructure monitoring is considerably deeper and requires far less custom configuration to get meaningful coverage up and running.
LogicMonitor Evaluation Summary

4.5/5
- Pricing upon request
- 14-day free trial
Why Trust Our Software Recommendations
6,700+
Reviews
20
Industry experts
16+
Evaluation factors
14
Years
Our team has been testing and reviewing software since 2012. As tech leaders ourselves, we know how difficult—and important—it is to choose the right software.
For this guide, we evaluated tools using hands-on testing and independent research, scoring tools using our selection criteria.
Our reviews reflect our human editorial judgment, not a sales pitch.
Expert reviewers:
- Paulo Gardini MiguelTech Director
 Tim FisherVP of AI
 Gabriel RosasTech Lead & Software Architect
 Christhian GruhnTech Lead & Platform Architect

LogicMonitor Overview
When judging cloud infrastructure monitoring systems, LogicMonitor stands out for its automated device discovery, flexible alerting, and extensive integration library. Its intuitive interface and guided onboarding make it accessible, while advanced features like dynamic topology mapping set it apart for large, distributed environments.
Pricing is competitive for mid-sized to enterprise teams, though smaller organizations may find it less cost-effective. Support is responsive, but some users may want deeper customization options.
If you’re selecting a monitoring platform for hybrid or multi-cloud infrastructure, LogicMonitor is a strong contender, especially where rapid deployment and unified visibility are priorities.
Pros
- Automated device discovery speeds up initial setup.
- AI-driven alert noise reduction improves incident response.
- Unified dashboards provide clear hybrid and multi-cloud visibility.
Cons
- Pricing can be high for smaller organizations.
- Advanced configuration requires technical expertise.
- Occasional delays in customer support response.
Is LogicMonitor Right For Your Needs?
Who Would be a Good Fit for LogicMonitor?
LogicMonitor is best suited for organizations with complex, distributed IT environments that demand unified visibility and automation. Its automated discovery, dynamic topology mapping, and AI-driven alerting make it a strong choice for industries with hybrid or multi-cloud infrastructure, large-scale operations, and compliance requirements.
Teams with dedicated IT staff and a need for deep monitoring across diverse assets will benefit most from LogicMonitor’s advanced capabilities.
- Large EnterprisesLogicMonitor handles thousands of devices and complex, multi-site environments with ease.
- Managed Service ProvidersMulti-tenant support and automated onboarding streamline client infrastructure monitoring.
- Financial ServicesGranular monitoring and compliance reporting support strict regulatory requirements.
- Healthcare ITUnified dashboards and alerting help maintain uptime for critical systems.
- DevOps TeamsAPI access and automation features fit continuous deployment workflows.
- Data Center OperationsDynamic topology mapping and capacity planning tools aid infrastructure management.
Who Would be a Bad Fit for LogicMonitor?
LogicMonitor may not be the best choice for smaller businesses, teams with limited IT resources, or organizations with simple infrastructure needs. Its advanced features and pricing structure are often more than what these users require, and the platform’s complexity can be unnecessary for straightforward monitoring scenarios.
- Small BusinessesPricing and feature set exceed the needs of basic environments.
- StartupsInitial setup and ongoing management require dedicated IT resources.
- Non-TechnicalDepartments Advanced configuration and dashboards may overwhelm non-IT users.
- Retail ChainsSimple POS and network monitoring needs don’t justify LogicMonitor’s depth.
- Educational InstitutionsBudget constraints and basic infrastructure make lighter tools preferable.
- Single-Cloud EnvironmentsOrganizations using only one cloud provider may not need multi-cloud features.
Our Review Methodology
How We Test & Score Tools
We’ve spent years building, refining, and improving our software testing and scoring system. The rubric is designed to capture the nuances of software selection and what makes a tool effective, focusing on critical aspects of the decision-making process.
Below, you can see exactly how our testing and scoring works across seven criteria. It allows us to provide an unbiased evaluation of the software based on core functionality, standout features, ease of use, onboarding, customer support, integrations, customer reviews, and value for money.
Core Functionality (25% of final scoring)
The starting point of our evaluation is always the core functionality of the tool. Does it have the basic features and functions that a user would expect to see? Are any of those core features locked to higher-tiered pricing plans? At its core, we expect a tool to stand up against the baseline capabilities of its competitors.
Standout Features (25% of final scoring)
Next, we evaluate uncommon standout features that go above and beyond the core functionality typically found in tools of its kind. A high score reflects specialized or unique features that make the product faster, more efficient, or offer additional value to the user.
We also evaluate how easy it is to integrate with other tools typically found in the tech stack to expand the functionality and utility of the software. Tools offering plentiful native integrations, 3rd party connections, and API access to build custom integrations score best.
Ease of Use (10% of final scoring)
We consider how quick and easy it is to execute the tasks defined in the core functionality using the tool. High scoring software is well designed, intuitive to use, offers mobile apps, provides templates, and makes relatively complex tasks seem simple.
Onboarding (10% of final scoring)
We know how important rapid team adoption is for a new platform, so we evaluate how easy it is to learn and use a tool with minimal training. We evaluate how quickly a team member can get set up and start using the tool with no experience. High scoring solutions indicate little or no support is required.
Customer Support (10% of final scoring)
We review how quick and easy it is to get unstuck and find help by phone, live chat, or knowledge base. Tools and companies that provide real-time support score best, while chatbots score worst.
Customer Reviews (10% of final scoring)
Beyond our own testing and evaluation, we consider the net promoter score from current and past customers. We review their likelihood, given the option, to choose the tool again for the core functionality. A high scoring software reflects a high net promoter score from current or past customers.
Value for Money (10% of final scoring)
Lastly, in consideration of all the other criteria, we review the average price of entry level plans against the core features and consider the value of the other evaluation criteria. Software that delivers more, for less, will score higher.
Core Features
AI-Powered Root Cause Analysis
Automatically identifies the source of performance issues, reducing alert storms and manual troubleshooting.
Unified Hybrid Visibility
Monitors cloud, on-prem, and hybrid environments in a single dashboard for end-to-end infrastructure insight.
Dynamic Topology Mapping
Visualizes real-time relationships and dependencies between devices, services, and applications across your environment.
Anomaly Detection
Uses AI to spot unusual patterns and behaviors before they impact users or systems.
Customizable Dashboards
Lets you build and share real-time dashboards tailored to teams, services, or SLAs.
Automated Device Discovery
Finds and adds new devices and resources automatically, speeding up onboarding and scaling.

Standout Features
LM Exchange
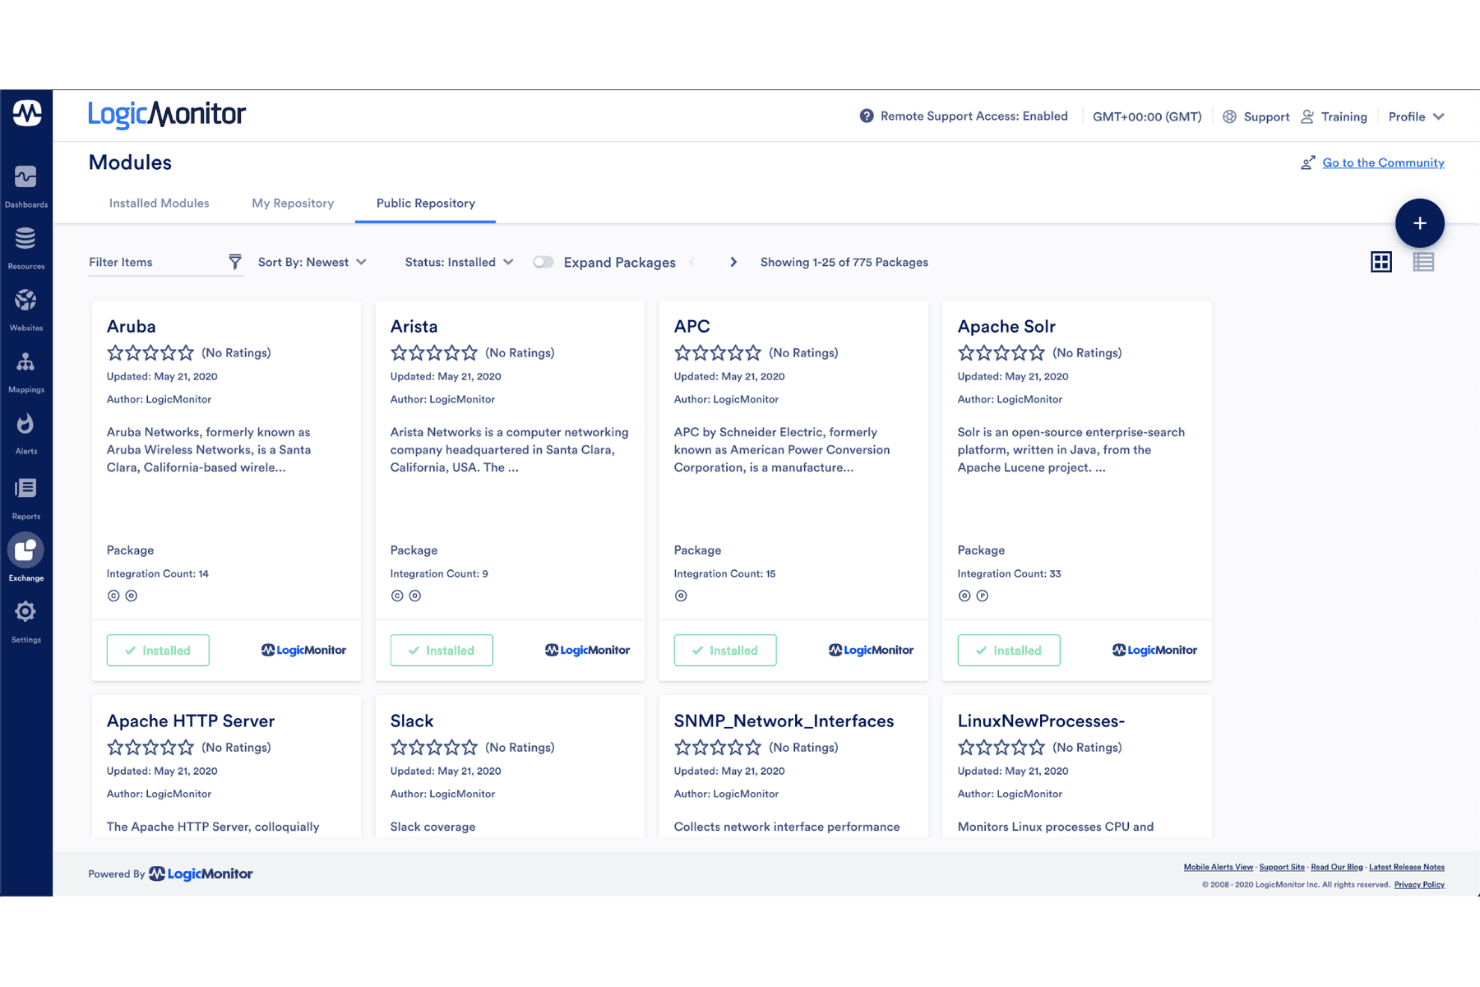
LM Exchange is a marketplace of pre-built monitoring templates, dashboards, and data sources curated by LogicMonitor and its user community. This lets teams deploy best-practice monitoring packs for new technologies or services in minutes.
SaaS Application Monitoring
LogicMonitor provides deep, out-of-the-box monitoring for popular SaaS platforms like Microsoft 365 and Salesforce. This extends visibility beyond infrastructure to critical business applications, helping IT teams catch issues that impact end users.
Ease of Use
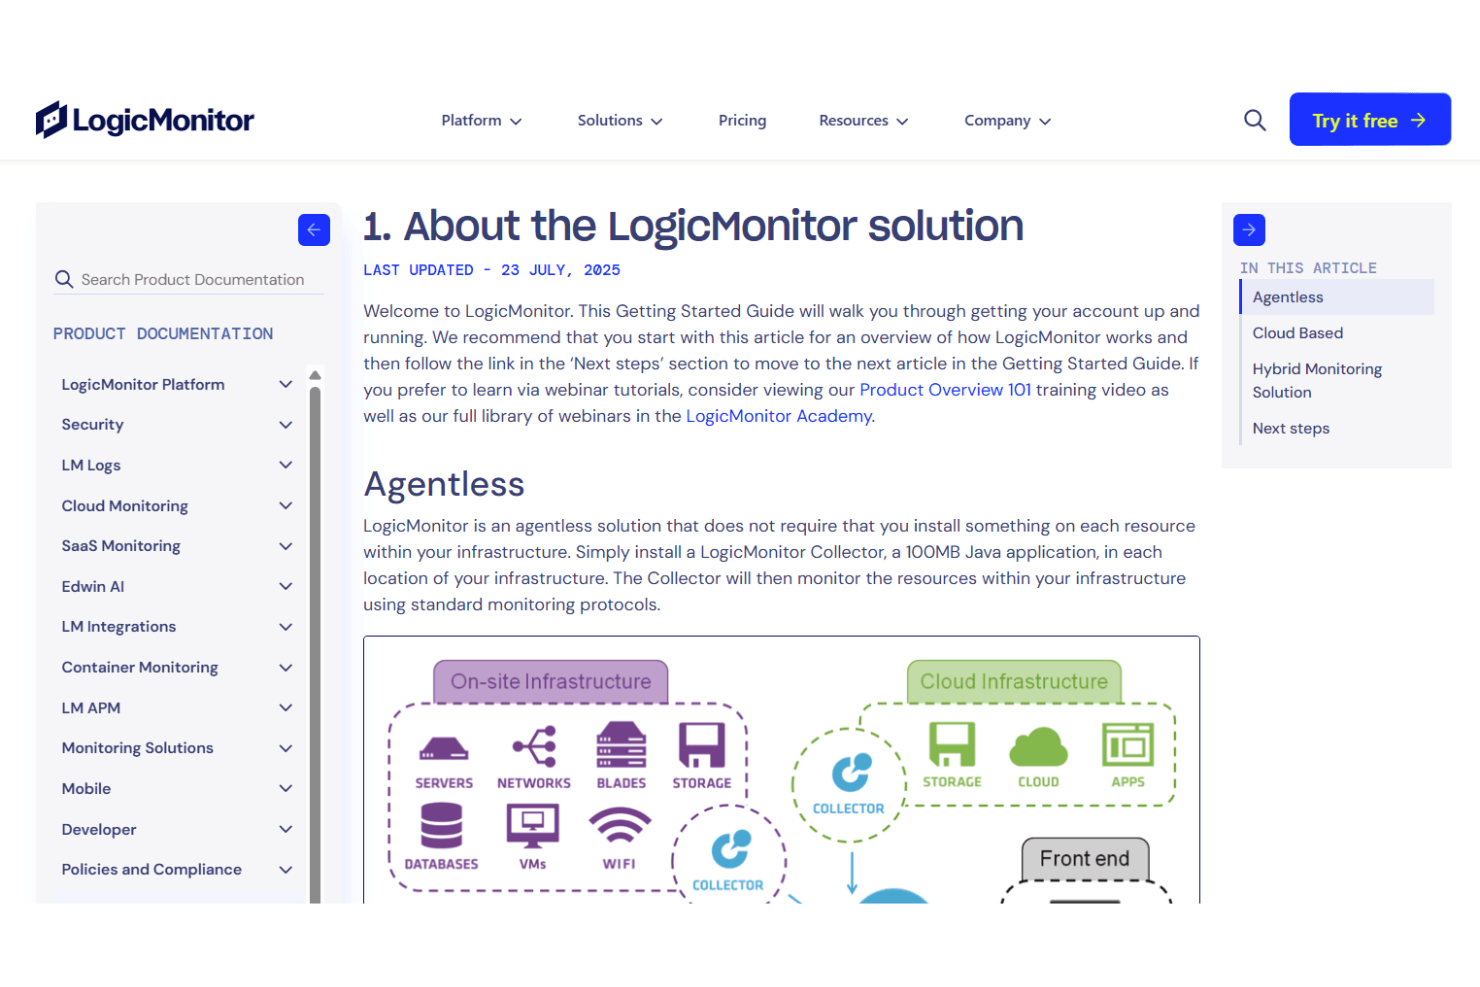
LogicMonitor offers a clean, intuitive interface that simplifies complex monitoring tasks, especially for IT professionals familiar with enterprise tools. Users often highlight the guided onboarding and automated device discovery as time-savers, while customizable dashboards make it easy to visualize key metrics.
However, some advanced features require technical expertise to configure, which can be a hurdle for less experienced teams. Overall, LogicMonitor balances depth and usability better than most enterprise-grade monitoring platforms.

Onboarding
LogicMonitor’s onboarding process is structured and well-supported, with guided setup wizards, detailed documentation, and responsive customer support. Many users report a quick time to value thanks to automated device discovery and pre-built monitoring templates.
The availability of live chat, webinars, and a robust knowledge base helps new users get up to speed, though some teams note that advanced configuration steps may still require direct assistance from LogicMonitor’s support team.
Customer Support
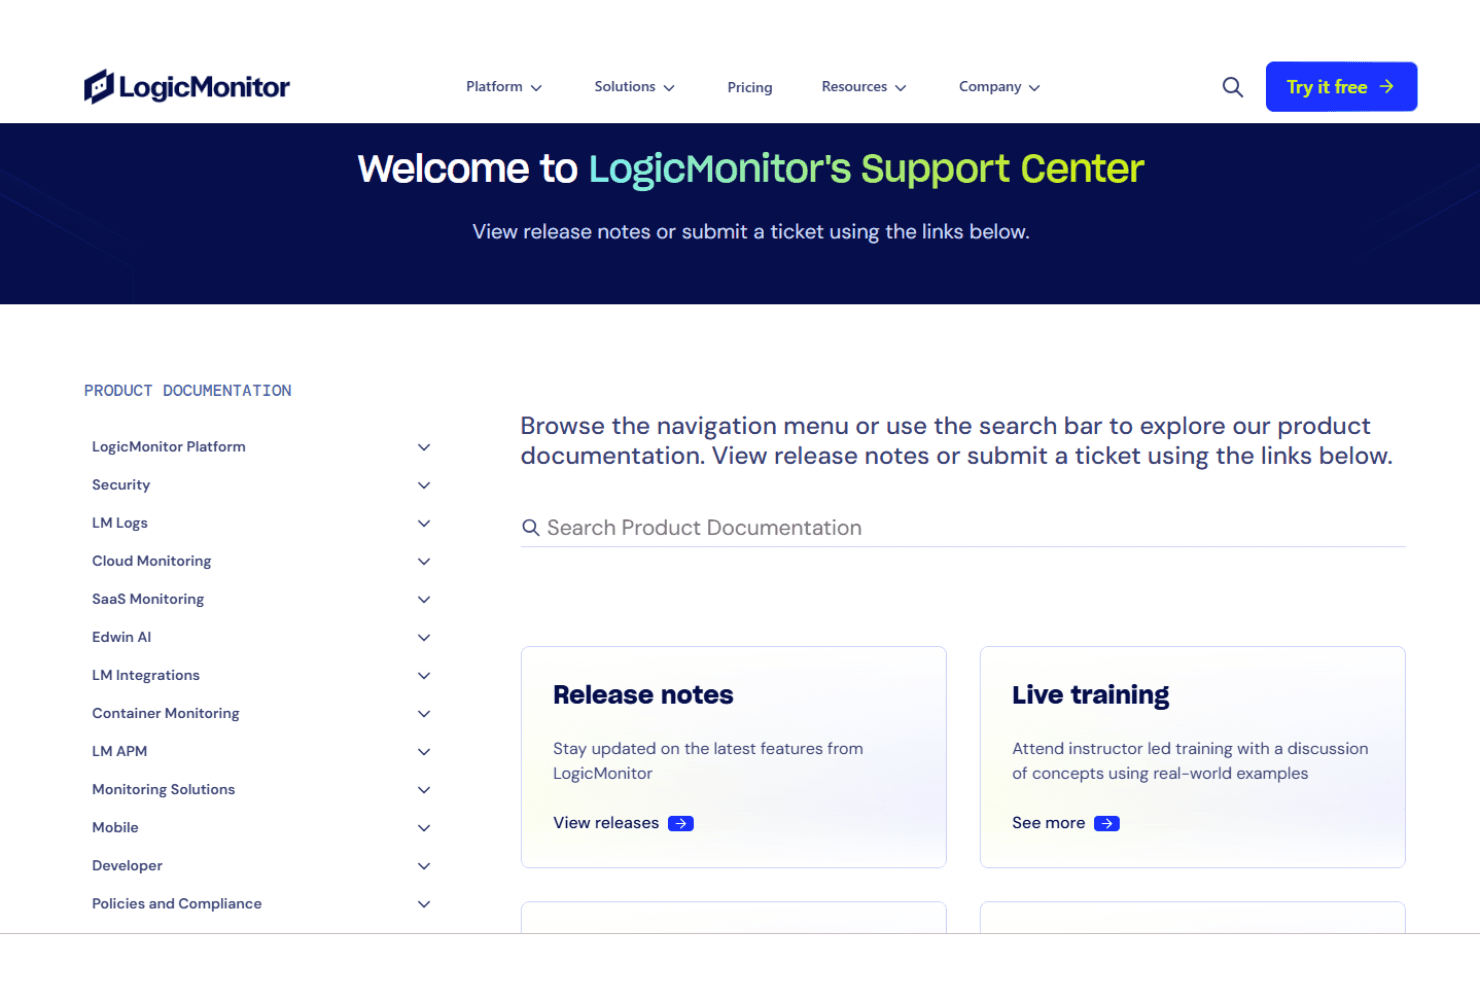
LogicMonitor offers multiple support channels, including 24/7 live chat, email, and phone assistance, which users appreciate for urgent issues. Many reviews highlight knowledgeable support staff and quick response times for most requests. However, some users mention occasional delays with complex technical queries or escalations.
The extensive online documentation and active user community also provide valuable self-service resources, making it easier for teams to resolve common questions without waiting for direct support.
Integrations
LogicMonitor integrates with AWS, Azure, Google Cloud Platform, Kubernetes, VMware, Cisco, Palo Alto Networks, Microsoft 365, ServiceNow, and Slack, among others.
LogicMonitor also offers a REST API and supports connections with third-party integration tools for custom workflows and automation.

Value for Money
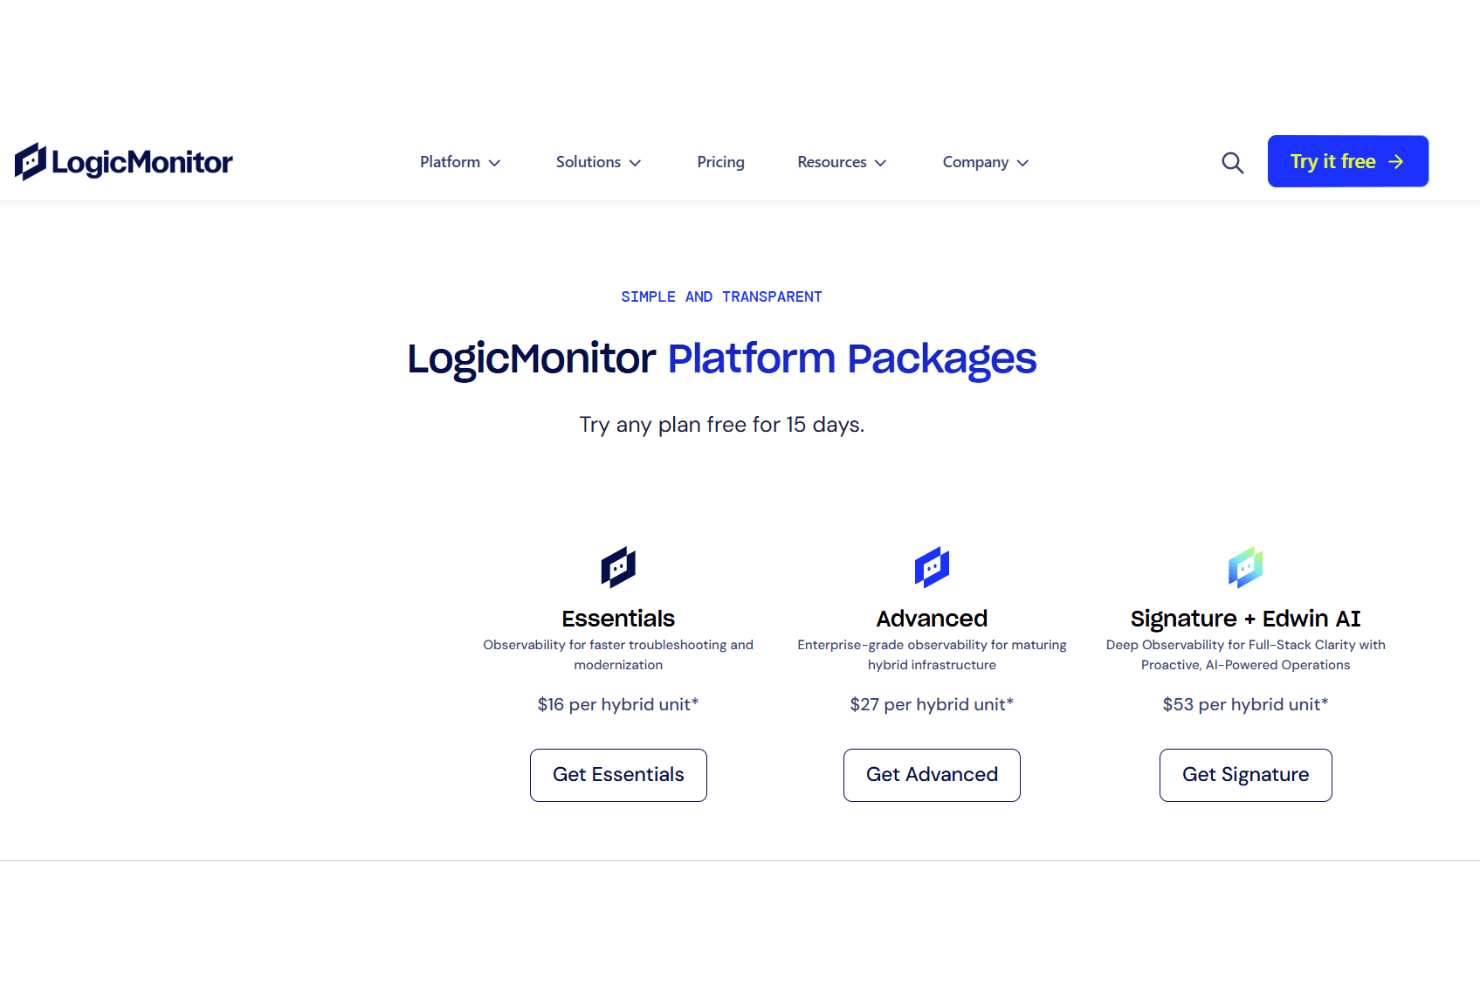
LogicMonitor is considered a premium solution, with pricing that reflects its advanced features and scalability. Users often feel the cost is justified for large or complex environments, but smaller organizations may find it expensive. Flexible pricing tiers and volume discounts help tailor the platform to different business needs.
- Essentials: A basic observability plan for faster troubleshooting and hybrid infrastructure monitoring.
- Advanced: A stronger plan with deeper insights and broader monitoring for growing hybrid environments.
- Signature + Edwin AI: A full observability tier with AI-powered root cause analysis and automated incident insights.
LogicMonitor Specs
- 2-Factor Authentication: Yes
- Access Management: Yes
- Anti-Virus: No
- API: Yes
- Audit Trail: Yes
- Bug Tracking: No
- Calendar Management: No
- Customer Management: No
- Dashboard: Yes
- Data Export: Yes
- Data Import: Yes
- Data Visualization: Yes
- Email Integration: Yes
- External Integrations: Yes
- File Sharing: No
- File Transfer: No
- Firewall: No
- Google Apps Integration: No
- Inventory Tracking: No
- Malware Protection: No
- Multi-User: Yes
- Network Device Performance Monitoring: Yes
- Network Traffic Monitoring: Yes
- Network Visualization: Yes
- Notifications: Yes
- Project Management: No
- Remote Access: Yes
- Risk Assessment: No
- SAP Integration: No
- Scheduling: No
- Software Integration: Yes
- Third-Party Plugins/Add-Ons: Yes
- Ticket Management: No
LogicMonitor FAQs
LogicMonitor Company Overview & History
LogicMonitor is a private company headquartered in Santa Barbara, California, with additional offices in Austin, London, Singapore, and India. The company employs over 800 people globally and focuses exclusively on its flagship SaaS-based observability and infrastructure monitoring platform. LogicMonitor is known for its strong work culture, commitment to innovation, and customer-centric approach.
Notable clients include Ted Baker, Travelex, and JetBlue, and the company has received recognition for its rapid growth and leadership in hybrid infrastructure monitoring.
LogicMonitor Major Milestones
- 2007: LogicMonitor founded in Santa Barbara, California.
- 2008: Launch of the LogicMonitor SaaS-based monitoring platform.
- 2016: Secured $130 million in funding from Providence Strategic Growth.
- 2018: Expanded global presence with new offices in London and Singapore.
- 2021: Acquired by Vista Equity Partners, further accelerating growth.
- 2023: Announced partnership and integration with Catchpoint to enhance digital experience monitoring.
- 2025: Recognized as a leader in hybrid observability by industry analysts.