New Relic Review 2026: Pros, Cons, Features, and Pricing


New Relic is an observability and monitoring tool that helps IT teams track, analyze, and optimize the performance of complex systems. It offers a unified platform with real-time data, customizable dashboards, and broad integration support. The software supports tech specialists who need to reduce downtime, pinpoint issues quickly, and manage sprawling infrastructure.
In this review, I’ll break down New Relic’s features, best and worst use cases, pros and cons, and pricing to help you decide if it fits your team’s needs.
New Relic Evaluation Summary
- From $49/user/month
- Free plan available
Why Trust Our Software Reviews
We’ve been testing and reviewing software since 2023. As tech leaders ourselves, we know how critical and difficult it is to make the right decision when selecting software.
We invest in deep research to help our audience make better software purchasing decisions. We’ve tested more than 2,000 tools for different tech use cases and written over 1,000 comprehensive software reviews. Learn how we stay transparent & our software review methodology.
New Relic Overview
If you’re judging observability and monitoring tools by depth of data, flexibility, and integration range, New Relic is a top contender. Its unified interface and granular dashboards make it easy to compare metrics across cloud, infrastructure, and application layers. Pricing can get tricky as usage grows, but the free tier is generous for smaller teams. Onboarding is straightforward, and support is responsive.
I’d suggest New Relic is best for teams managing multi-cloud or hybrid environments who want to consolidate monitoring, though it may feel overwhelming if you only need basic uptime checks.
pros
-
Flexible usage-based pricing with a generous free tier.
-
AI-powered features for automated root cause analysis.
-
Unified platform for logs, metrics, and traces.
cons
-
Alert noise can require significant tuning for accuracy.
-
Dashboards can feel cluttered with large environments.
-
Costs can spike with high data ingestion.
-

TestDevLab
Visit Website -
Site24x7
Visit WebsiteThis is an aggregated rating for this tool including ratings from Crozdesk users and ratings from other sites.4.7 -
GitHub Actions
Visit WebsiteThis is an aggregated rating for this tool including ratings from Crozdesk users and ratings from other sites.4.8


Our Review Methodology
How We Test & Score Tools
We’ve spent years building, refining, and improving our software testing and scoring system. The rubric is designed to capture the nuances of software selection and what makes a tool effective, focusing on critical aspects of the decision-making process.
Below, you can see exactly how our testing and scoring works across seven criteria. It allows us to provide an unbiased evaluation of the software based on core functionality, standout features, ease of use, onboarding, customer support, integrations, customer reviews, and value for money.
Core Functionality (25% of final scoring)
The starting point of our evaluation is always the core functionality of the tool. Does it have the basic features and functions that a user would expect to see? Are any of those core features locked to higher-tiered pricing plans? At its core, we expect a tool to stand up against the baseline capabilities of its competitors.
Standout Features (25% of final scoring)
Next, we evaluate uncommon standout features that go above and beyond the core functionality typically found in tools of its kind. A high score reflects specialized or unique features that make the product faster, more efficient, or offer additional value to the user.
We also evaluate how easy it is to integrate with other tools typically found in the tech stack to expand the functionality and utility of the software. Tools offering plentiful native integrations, 3rd party connections, and API access to build custom integrations score best.
Ease of Use (10% of final scoring)
We consider how quick and easy it is to execute the tasks defined in the core functionality using the tool. High scoring software is well designed, intuitive to use, offers mobile apps, provides templates, and makes relatively complex tasks seem simple.
Onboarding (10% of final scoring)
We know how important rapid team adoption is for a new platform, so we evaluate how easy it is to learn and use a tool with minimal training. We evaluate how quickly a team member can get set up and start using the tool with no experience. High scoring solutions indicate little or no support is required.
Customer Support (10% of final scoring)
We review how quick and easy it is to get unstuck and find help by phone, live chat, or knowledge base. Tools and companies that provide real-time support score best, while chatbots score worst.
Customer Reviews (10% of final scoring)
Beyond our own testing and evaluation, we consider the net promoter score from current and past customers. We review their likelihood, given the option, to choose the tool again for the core functionality. A high scoring software reflects a high net promoter score from current or past customers.
Value for Money (10% of final scoring)
Lastly, in consideration of all the other criteria, we review the average price of entry level plans against the core features and consider the value of the other evaluation criteria. Software that delivers more, for less, will score higher.
Core Features
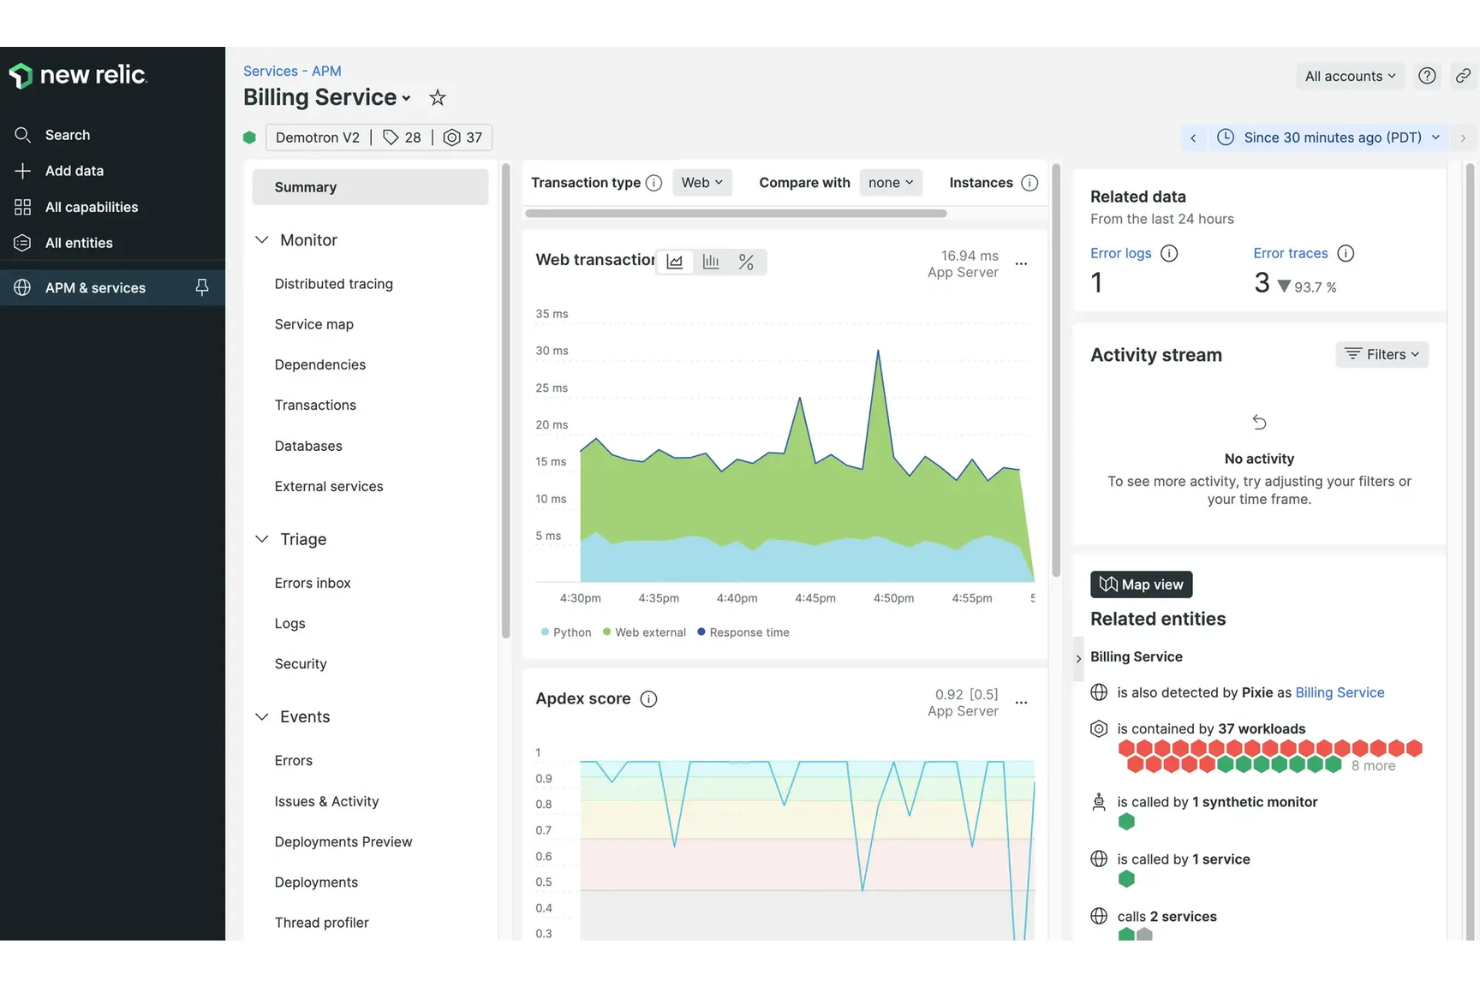
Application Performance Monitoring (APM)
Monitors application health, dependencies, and performance in real time. Pinpoints bottlenecks down to the line of code.
Distributed Tracing
Tracks requests as they move through microservices and infrastructure. Helps teams quickly identify latency and failure points.
Log Management
Centralizes logs from all sources and correlates them with metrics and traces. Enables fast troubleshooting with contextual log data.
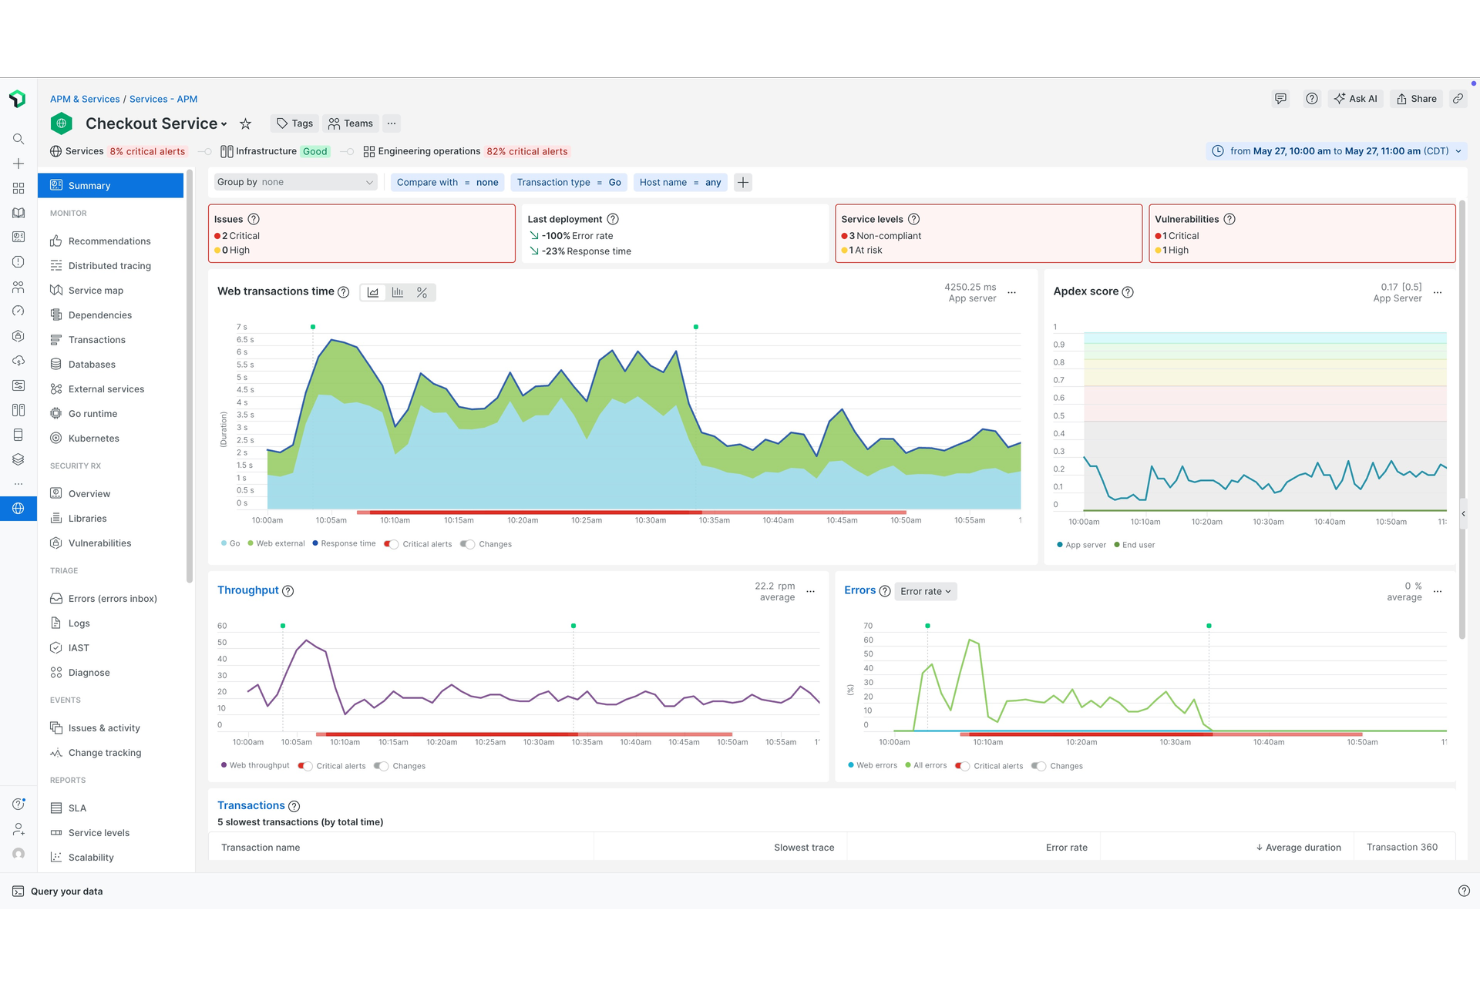
Infrastructure Monitoring
Visualizes server, cloud, and container health on unified dashboards. Detects resource issues across hybrid and multi-cloud environments.
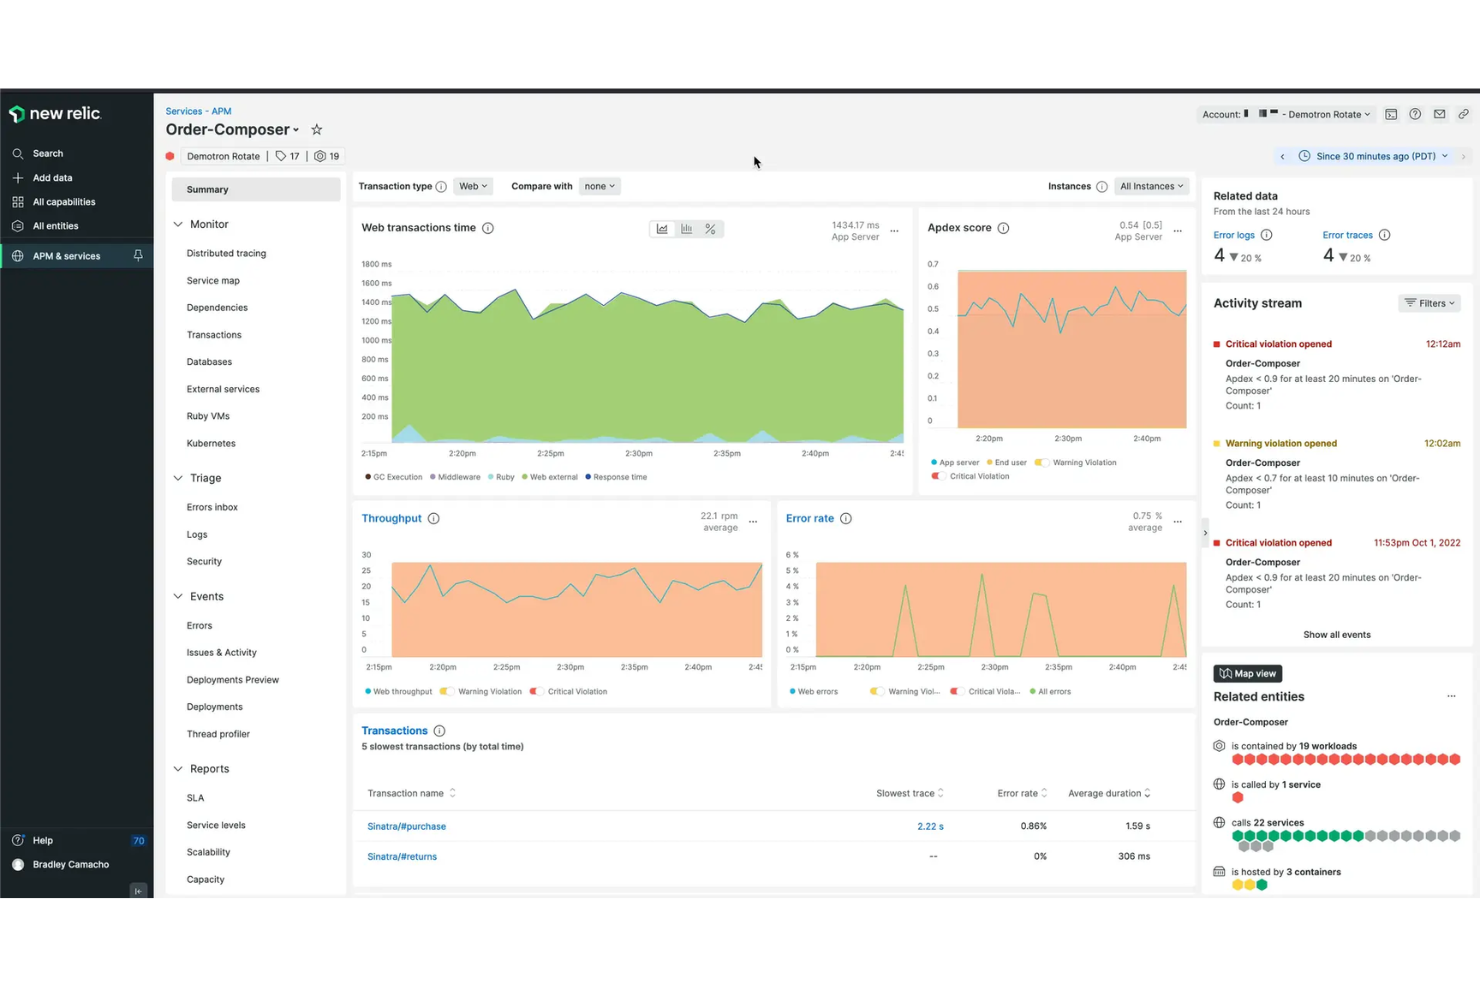
AI-Powered Incident Detection
Uses machine learning to detect anomalies and automate root cause analysis. Reduces alert fatigue by correlating related incidents.
Custom Dashboards and Alerts
Lets users build tailored dashboards and set granular alert conditions. Supports proactive monitoring with real-time notifications.
Ease of Use
New Relic offers a clean, modern interface with intuitive navigation, but its depth can feel overwhelming for new users or smaller teams. The guided onboarding and in-app documentation help flatten the learning curve, especially for complex setups. Users often mention that customizing dashboards and alerts is straightforward, but getting the most value requires some technical know-how.
Overall, it’s user-friendly for experienced teams managing dynamic, multi-layered environments.
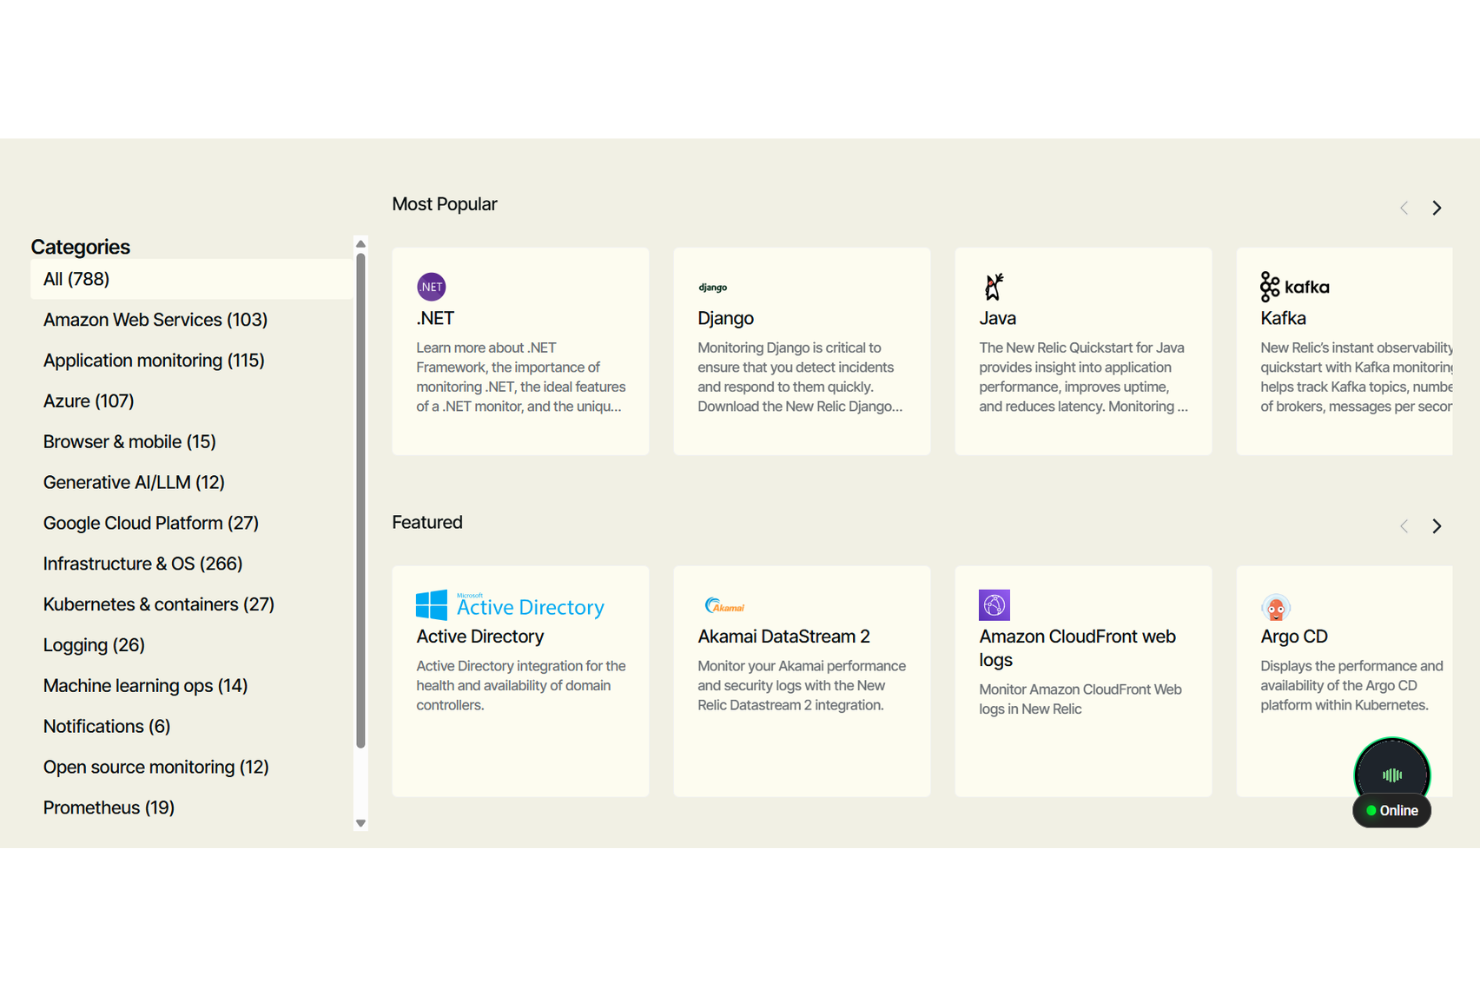
Integrations
New Relic integrates with AWS, Azure, Google Cloud Platform, Kubernetes, Docker, Prometheus, Jenkins, Slack, PagerDuty, and ServiceNow, among others.
New Relic also offers a robust API and supports connections with third-party integration tools for custom workflows and automation.
New Relic Specs
- AI Integration
- API
- Automated Testing
- Browser Compatibility Testing
- Bug Tracking
- Code Review
- Custom Reports
- Data Export
- Data Import
- Developer Tools
- External Integrations
- Malware Protection
- Multi-User
- Notifications
- Performance Testing
- Process Reporting
- Static Analysis
- Status Notifications
- Workflow Management