20 Best Server Monitoring Tools Reviewed in 2026

Best Server Monitoring Tools Shortlist
Here’s my shortlist of the best server monitoring tools:


The best server monitoring software helps teams detect performance issues early, reduce downtime, track resource usage, and keep critical systems running reliably. These tools give IT and operations teams the visibility they need to understand how servers behave under load and respond before users are affected.
Teams often look for server monitoring solutions when misconfigurations cause outages, manual checks lead to missed warning signs, or security gaps go unnoticed on key infrastructure. These issues create slowdowns, unexpected failures, and challenges for teams trying to coordinate troubleshooting across complex environments.
With over 20 years in the industry as a Chief Technology Officer, I’ve tested and reviewed dozens of server monitoring software platforms across real-world environments to evaluate their accuracy, integration options, and usability. This guide highlights the top server monitoring software that improve system reliability, support faster incident response, and help teams maintain predictable performance. Each review covers features, pros and cons, and best-fit use cases to help you choose the right tool.
Why Trust Our Software Reviews
We’ve been testing and reviewing SaaS development software since 2023. As tech experts ourselves, we know how critical and difficult it is to make the right decision when selecting software. We invest in deep research to help our audience make better software purchasing decisions.
We’ve tested more than 2,000 tools for different SaaS development use cases and written over 1,000 comprehensive software reviews. Learn how we stay transparent and check out our software review methodology.
Best Server Monitoring Tools Summary
This comparison chart summarizes pricing details for my top server monitoring tools selections to help you find the best one for your budget and business needs.
| Tool | Best For | Trial Info | Price | ||
|---|---|---|---|---|---|
| 1 | Best for endpoint management and patch compliance | Free trial + free demo available | Pricing upon request | Website | |
| 2 | Best for agentless Windows server monitoring | 14-day free trial available | Pricing upon request | Website | |
| 3 | Best open-source solution | Free plan available | Pricing upon request | Website | |
| 4 | Best for large-scale server monitoring | Free plan + 30-day free trial available | From $225/month (billed annually) | Website | |
| 5 | Best for continuous server tracking | Free demo available | From $245/25 devices | Website | |
| 6 | Best for real-time server monitoring | 30-day free trial | From $179/month (billed annually) | Website | |
| 7 | Best for extensive server metric tracking | 30-day free trial + free demo available | From $10/month (billed annually) | Website | |
| 8 | Best for distributed tracing and error debugging | Free plan + free trial + free demo available | From $26/month (billed annually) | Website | |
| 9 | Best for AI-powered application performance | Free demo + 15-day free trial available | From $7/host/month | Website | |
| 10 | Best for comprehensive IT infrastructure monitoring | Free plan and free demo available | From $2,595 (perpetual license for 100 nodes) | Website | |
| 11 | Best for cloud-scale infrastructure monitoring | 14-day free trial available | From $15/host/month (billed annually) | Website | |
| 12 | Best for hybrid infrastructure monitoring | Free 15-day trial | From $16/hybrid unit/month | Website | |
| 13 | Best for end-to-end business transaction tracking | Free trial available | Pricing upon request | Website | |
| 14 | Best for real-time application analytics | Free trial + free demo available | Pricing upon request | Website | |
| 15 | Best for simulating real user interactions | 30-day free trial | From $19.99/month | Website | |
| 16 | Good for log management and analysis | 30-day free trial | Pricing upon request | Website | |
| 17 | Good for integrated RMM and PSA solution | 30-day free trial + free demo available | From $149/technician/month (billed annually) | Website | |
| 18 | Best for scalability with large networks | Free download available | From $325/month (billed annually) | Website | |
| 19 | Good for network monitoring and visualization | Free 30-day trial + Free edition available | Pricing upon request | Website | |
| 20 | Good for real-time performance troubleshooting | 14-day free trial + free plan + free demo available | From $4.50/node/month (billed annually) | Website |


-

Site24x7
Visit WebsiteThis is an aggregated rating for this tool including ratings from Crozdesk users and ratings from other sites.4.7 -
GitHub Actions
Visit WebsiteThis is an aggregated rating for this tool including ratings from Crozdesk users and ratings from other sites.4.8 -
Docker
Visit WebsiteThis is an aggregated rating for this tool including ratings from Crozdesk users and ratings from other sites.4.6


Best Server Monitoring Tool Reviews
Below are my detailed summaries of the best server monitoring tools that made it onto my shortlist. My reviews offer a detailed look at the key features, pros & cons, integrations, and ideal use cases of each tool to help you find the best one for you.
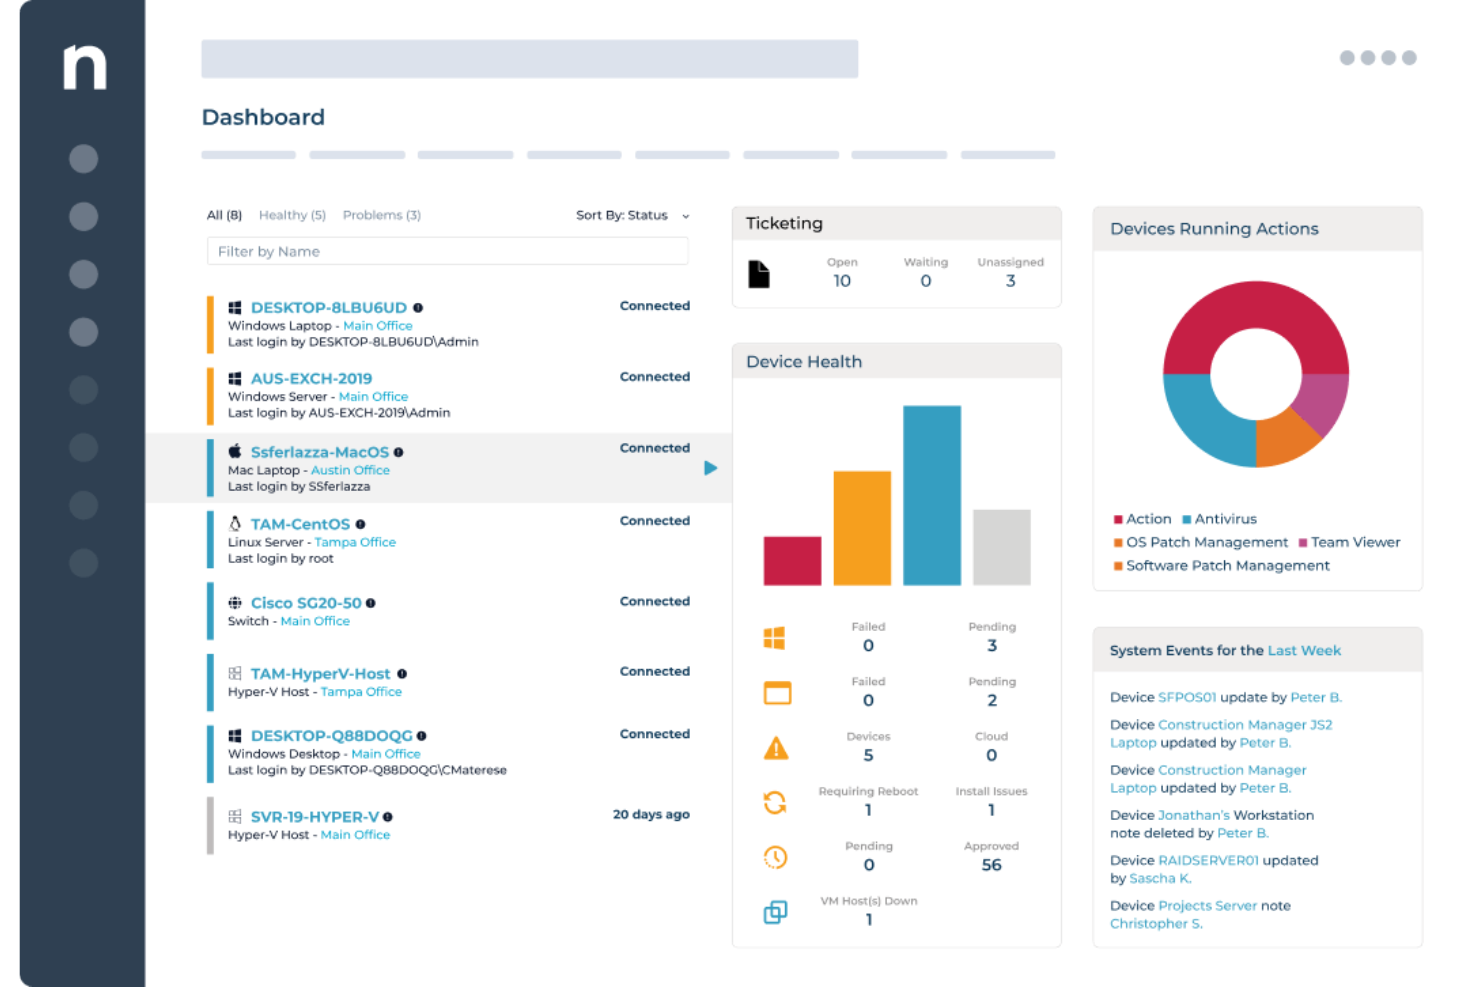
NinjaOne gives IT teams and managed service providers a unified platform to monitor servers, automate patching, and manage endpoints across distributed environments, helping reduce downtime and simplify infrastructure oversight.
Who Is NinjaOne Best For?
NinjaOne is a strong fit for MSPs and internal IT teams managing large fleets of servers and endpoints across multiple locations or client environments.
Why I Picked NinjaOne
I picked NinjaOne as one of the best because its patch management handles the full compliance lifecycle, not just deployment. The Patch Intelligence feature analyzes telemetry and deployment signals to automatically flag unstable updates and pause risky patches before they cause disruption. You can set device-role-based patching policies so servers running different workloads are patched on different schedules without manual intervention. Additionally, the patch compliance reporting gives a clear, on-demand view of what's been patched, what hasn't, and where vulnerabilities lie across every endpoint.
NinjaOne Key Features
- Real-time endpoint monitoring: View device health, configurations, and compliance status across all endpoints from a single cloud-native console.
- Automated endpoint remediation: Use condition-based scripting to detect and fix endpoint issues automatically without technician intervention.
- Software and OS deployment: Roll out Windows software, updates, and configurations across endpoints using repeatable, automation-driven workflows.
- Hardware and software inventory: Get a live view of every device in your environment, including hardware specs, installed software, and warranty status.
NinjaOne Integrations
NinjaOne offers native integrations with ConnectWise, Autotask, Zendesk, Webroot, Bitdefender, TeamViewer, Splashtop, Acronis, and the Microsoft ecosystem, including Microsoft 365 and Azure. An API is available for custom integrations.
Pros and Cons
Pros:
- Automated endpoint discovery
- Flexible reporting with custom metrics
- Comprehensive API documentation
Cons:
- Complexity in setting up alerts for non-standard events
- Occasional delays in patch deployment
New Product Updates from NinjaOne
NinjaOne Launches Integrated Remote Access
NinjaOne has expanded its automated management platform by introducing NinjaOne Remote, a secure remote access solution for multiple operating systems. For more information, visit NinjaOne's official site.
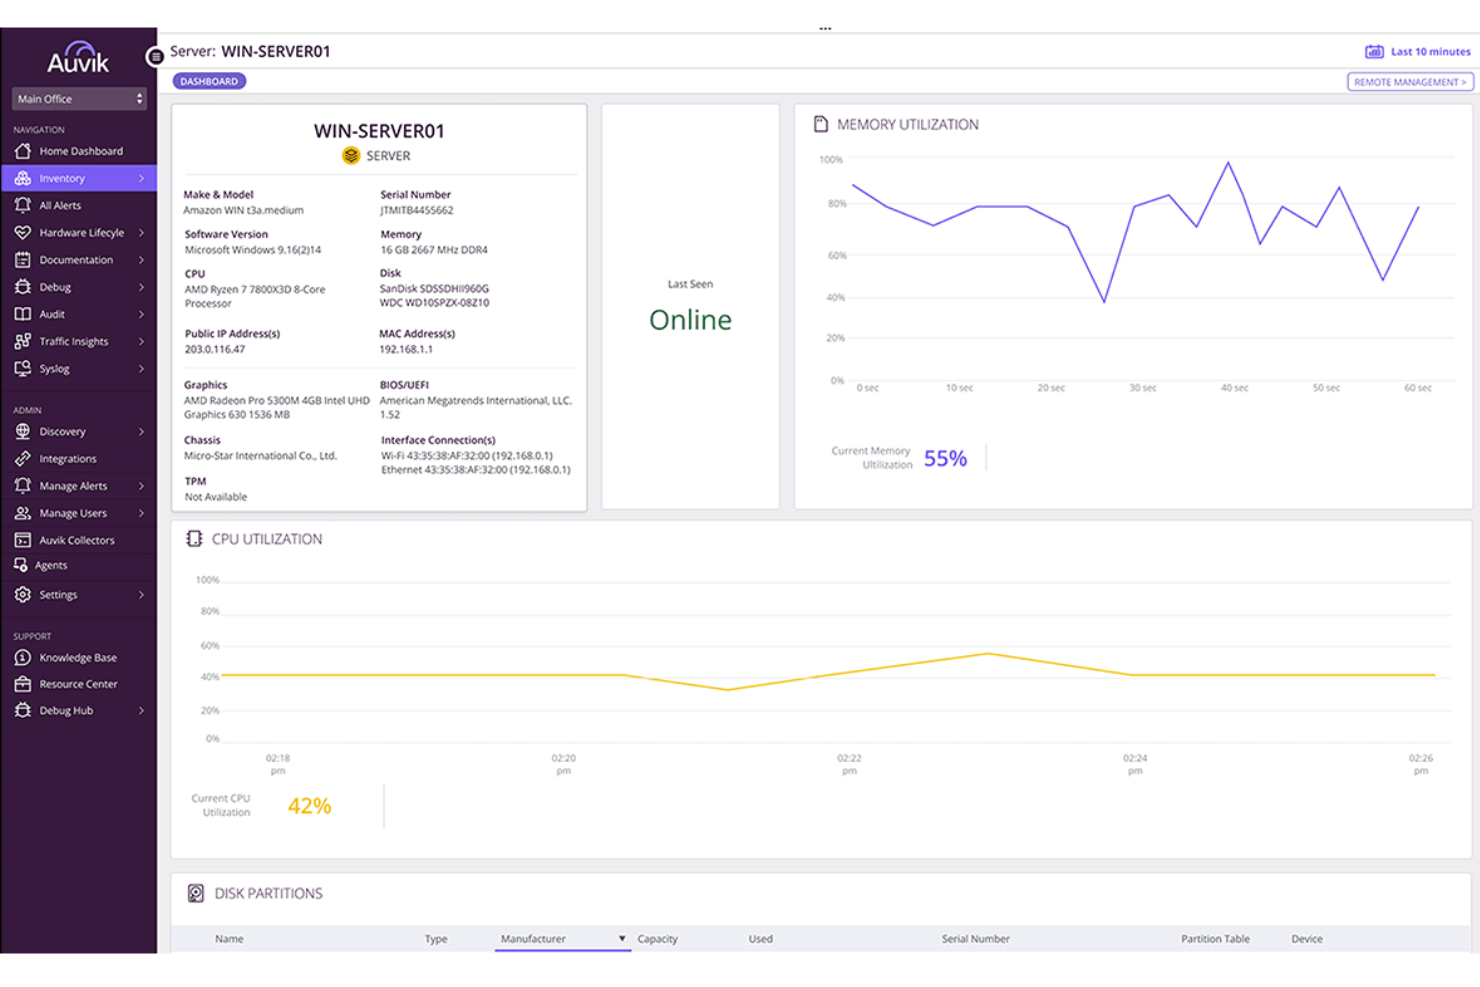
Auvik gives IT teams and managed service providers a way to monitor, map, and manage server and network infrastructure from a single cloud-based dashboard, helping you detect issues and maintain uptime across complex environments.
Who Is Auvik Best For?
Auvik is a strong fit for managed service providers and internal IT teams that need centralized visibility across multi-site or multi-client network and server environments.
Why I Picked Auvik
I picked Auvik as one of the best because I love how it handles Windows server monitoring without requiring you to rip and replace your existing setup. The agentless path via the Auvik Collector gives you real-time visibility into CPU, memory, disk utilization, and online status—without installing software on each server. I also like the Windows Services alerting, where my team can build custom alert rules using Alerts 2.0 to trigger on specific service states, service names, or utilization thresholds, with suppression options to cut down on noise from services that self-recover. The automated software inventory pulls application name, vendor, version, and install date from each monitored server, which is genuinely useful when you're doing a security audit or chasing down a software compliance issue.
Auvik Key Features
- Automated server discovery: Auvik automatically discovers Windows servers and surfaces detailed component and service information within minutes of deployment.
- Performance dashboards: View CPU, memory, and disk utilization trends over time in dedicated server dashboards, with historical data you can use to spot patterns and plan capacity.
- Performance forecasting: Auvik tracks CPU and memory metrics over time to identify usage trends and predict potential issues before they affect server availability.
- Multi-site infrastructure visibility: Monitor servers and network devices across unlimited sites from a single cloud-based dashboard, with all alerts and device data in one place.
Auvik Integrations
Auvik offers native integrations with ConnectWise, Autotask, ServiceNow, Slack, PagerDuty, Freshdesk, Zendesk, Microsoft Teams, and Webex, and also provides an API for custom integrations.
Pros and Cons
Pros:
- Agentless monitoring provides fast setup for Windows servers
- Real-time alerts help teams respond before performance degrades
- Automated configuration backups protect against changes gone wrong
Cons:
- Limited support for Linux and other non-Windows servers
- Advanced features may require additional setup and tuning
New Product Updates from Auvik
Auvik Adds Alert Insights Report and Enhanced Alerting Controls
Auvik introduces the Alert Insights Report (Beta), count-based alert delays, and automatic alert dismissal. These updates help reduce alert noise and improve how teams monitor and manage alerts. For more information, visit Auvik’s official site.
 .
.
Icinga is a monitoring platform built for IT teams and system administrators who need deep visibility into server health, network performance, and infrastructure status across complex environments.
Who Is Icinga Best For?
Icinga is a strong fit for mid-to-large IT teams that need a highly customizable, open-source monitoring solution they can adapt to complex, multi-environment infrastructure.
Why I Picked Icinga
Icinga earns its spot on my shortlist because it's one of the few genuinely open-source server monitoring platforms that doesn't water down its feature set to push you toward a paid tier. I like how Icinga's check execution engine lets my team define custom monitoring logic using any scripting language, so we're not locked into predefined check templates. The Icinga Director module is particularly useful—it gives us a web-based configuration interface for managing hosts, services, and notifications at scale without touching config files directly. For teams running hybrid or on-premises infrastructure, that level of control is hard to replicate in a closed-source tool.
Icinga Key Features
- Distributed monitoring: Deploy satellite zones to monitor remote networks and data centers from a central Icinga instance.
- Alerting and escalation rules: Configure notification workflows that route alerts to the right team members based on severity and time windows.
- Icinga DB: A high-performance backend that stores and processes monitoring data for fast querying and reporting.
- Graphing and visualization: Integrate with tools like Grafana to display real-time performance metrics and historical server data.
Icinga Integrations
Icinga offers native integrations with Grafana, Jira, Slack, PagerDuty, ServiceNow, InfluxDB, Elasticsearch, Graylog, and has an API for custom integrations.
Pros and Cons
Pros:
- Highly customizable for various IT infrastructure needs
- Scalable for both small and large environments
- Free to use with no setup fees
Cons:
- Setup and configuration comes with a learning curve
- Occasional performance issues reported during high-load scenario
New Product Updates from Icinga
Icinga Web Adds PHP 8.5 Support and New Packages
Icinga Web introduces PHP 8.5 support, icinga/zf1 and icinga-php-legacy packages, and module updates. These changes improve compatibility, modernize the codebase, and enhance overall system stability. For more information, visit Icinga's official site.
 .
.
Checkmk is a monitoring platform built for IT teams and enterprises that need to track server health, performance, and availability across complex, distributed environments.
Who Is Checkmk Best For?
Checkmk is a strong fit for mid-to-large enterprises and managed service providers running extensive server infrastructure across on-premises, cloud, or hybrid environments.
Why I Picked Checkmk
Checkmk earns its spot on my shortlist because of how well it handles large-scale server monitoring without buckling under the weight of complex infrastructure. I particularly like its distributed monitoring architecture, which lets my team scale across hundreds of sites and monitor millions of devices from a single setup. The auto-discovery feature is useful—it detects hosts and services automatically, so onboarding new servers doesn't require manual configuration at every step. The rule-based 1-to-N configuration lets me apply monitoring rules across thousands of hosts at once, rather than configuring each one individually.
Checkmk Key Features
- Predictive monitoring: Uses historical data and algorithms to dynamically adjust thresholds and forecast future resource consumption before issues occur.
- Log monitoring: Collects and filters events from syslog, SNMP traps, Windows event logs, and log files, collapsing duplicate entries to reduce alert noise.
- Agent Bakery: Centrally manages and automates agent deployment and updates across hosts, reducing manual overhead for large server fleets.
- Hardware and software inventory: Automatically identifies and tracks all hardware and software assets, monitoring changes and integrating data into your CMDB view.
Checkmk Integrations
Checkmk offers 20+ native integrations, including ServiceNow, Jira, Grafana, Nagios, Prometheus, VMware vSphere, AWS, Azure, Google Cloud Platform, Slack, and Zapier. An API is available for custom integrations.
Pros and Cons
Pros:
- REST API for integration with third-party tools
- Customizable dashboards
- Scalable monitoring
Cons:
- Potential learning curve for beginners
- Complex setup

ManageEngine OpManager is a network and server monitoring platform built for IT teams and system administrators who need to track server health, performance, and uptime across complex infrastructures.
Who Is ManageEngine OpManager Best For?
ManageEngine OpManager is well-suited to mid-size and large IT teams that manage distributed server environments and need centralized visibility.
Why I Picked ManageEngine OpManager
ManageEngine OpManager earns its spot on my shortlist because of how thoroughly it covers continuous server tracking—monitoring intervals can go as low as 30 seconds, and real-time "heartbeat" monitors can run at 1-second intervals for mission-critical resources. It tracks over 300 dedicated performance metrics across 130+ server vendors, from CPU and memory utilization to disk latency and deadlocks per second. The ML-powered adaptive thresholds are a genuine differentiator—OpManager learns what "normal" looks like for each metric and automatically adjusts alarm thresholds every hour, reducing false positives. This continuous, self-calibrating visibility is hard to replicate with manual threshold configuration.
ManageEngine OpManager Key Features
- Server log monitoring: Tracks Windows event logs, syslogs, and application logs for Exchange, IIS, and MS SQL servers, with rule-based alerting for specific log events.
- Automated workflow builder: Uses a drag-and-drop, code-free interface with 70+ actions to build sequential remediation workflows that can restart services or spin up VMs automatically.
- 3D data center floor views: Lets you map server racks and datacenter floors in 2D or 3D, with real-time device status overlaid on the physical layout.
- Storage capacity forecasting: Analyzes historical and current usage trends to generate reports predicting future storage utilization before capacity issues arise.
ManageEngine OpManager Integrations
ManageEngine OpManager offers native integrations with ServiceDesk Plus, AlarmsOne, Analytics Plus, Applications Manager, NetFlow Analyzer, Network Configuration Manager, and has native integrations across the Microsoft ecosystem, including Microsoft 365 and Azure. An API is available for custom integrations.
Pros and Cons
Pros:
- Scalability for growing networks
- Real-time alerting
- Comprehensive monitoring capabilities
Cons:
- Occasional update issues
- Complex initial setup
New Product Updates from ManageEngine OpManager
ManageEngine OpManager Vendor Templates and NCM XML Import
ManageEngine OpManager introduces enhanced vendor template integration and device template import for the NCM module using XML files. This update helps teams improve device classification and speed up configuration workflows. For more information, visit ManageEngine OpManager’s official site.
 .
.
PRTG is a monitoring platform built for IT teams and system administrators who need to keep servers, networks, and infrastructure running smoothly with customizable dashboards, automated alerts, and support for a wide range of protocols.
Who Is PRTG Best For?
PRTG is a strong fit for mid-size to large IT teams managing complex, multi-device environments who need centralized visibility across servers, networks, and applications.
Why I Picked PRTG
I picked PRTG as one of the best for real-time server monitoring because of how granular and immediate its sensor-based monitoring is. Each sensor tracks a single measured value—CPU load, memory usage, disk space—and you can configure the scanning interval per sensor, so you're getting live data at whatever cadence your environment demands. PRTG's alerting goes beyond simple up/down notifications: you can set threshold triggers that fire before a server hits a critical state, which means my team can catch a disk filling up or a memory spike before it causes an outage. The AI-driven anomaly detection adds another layer by adapting baselines to your environment automatically, so alerts stay relevant rather than noisy.
PRTG Key Features
- Distributed monitoring: Monitor multiple remote locations from a single dashboard using probes that communicate via TLS encryption.
- Customizable reporting: Build and schedule reports using custom templates to share infrastructure status with stakeholders.
- Maps and dashboards: Design real-time network maps with live status information using the drag-and-drop map designer.
- Mobile app access: Monitor your environment on the go using PRTG's native apps for iOS and Android.
PRTG Integrations
PRTG offers native integrations with Amazon CloudWatch, VMware vSphere, Microsoft Azure, Google Cloud Platform, Cisco, Dell EMC, HPE, NetApp, and has native integrations across the Microsoft ecosystem, including Microsoft 365 and Azure. An API is available for custom integrations.
Pros and Cons
Pros:
- User-friendly visual interface
- Customizable monitoring and alerting
- Scalable for a wide range of network sizes
Cons:
- More advanced features may come with a learning curve
- High costs for larger deployments
New Product Updates from PRTG
PRTG Introduces New Monitoring Sensors In Beta
This week, PRTG introduces three BETA sensors that broaden your monitoring scope for Proxmox VE clusters and SIMATIC S7-300/400 PLCs, giving you deeper operational insights. For more information, visit PRTG’s official site.
 .
.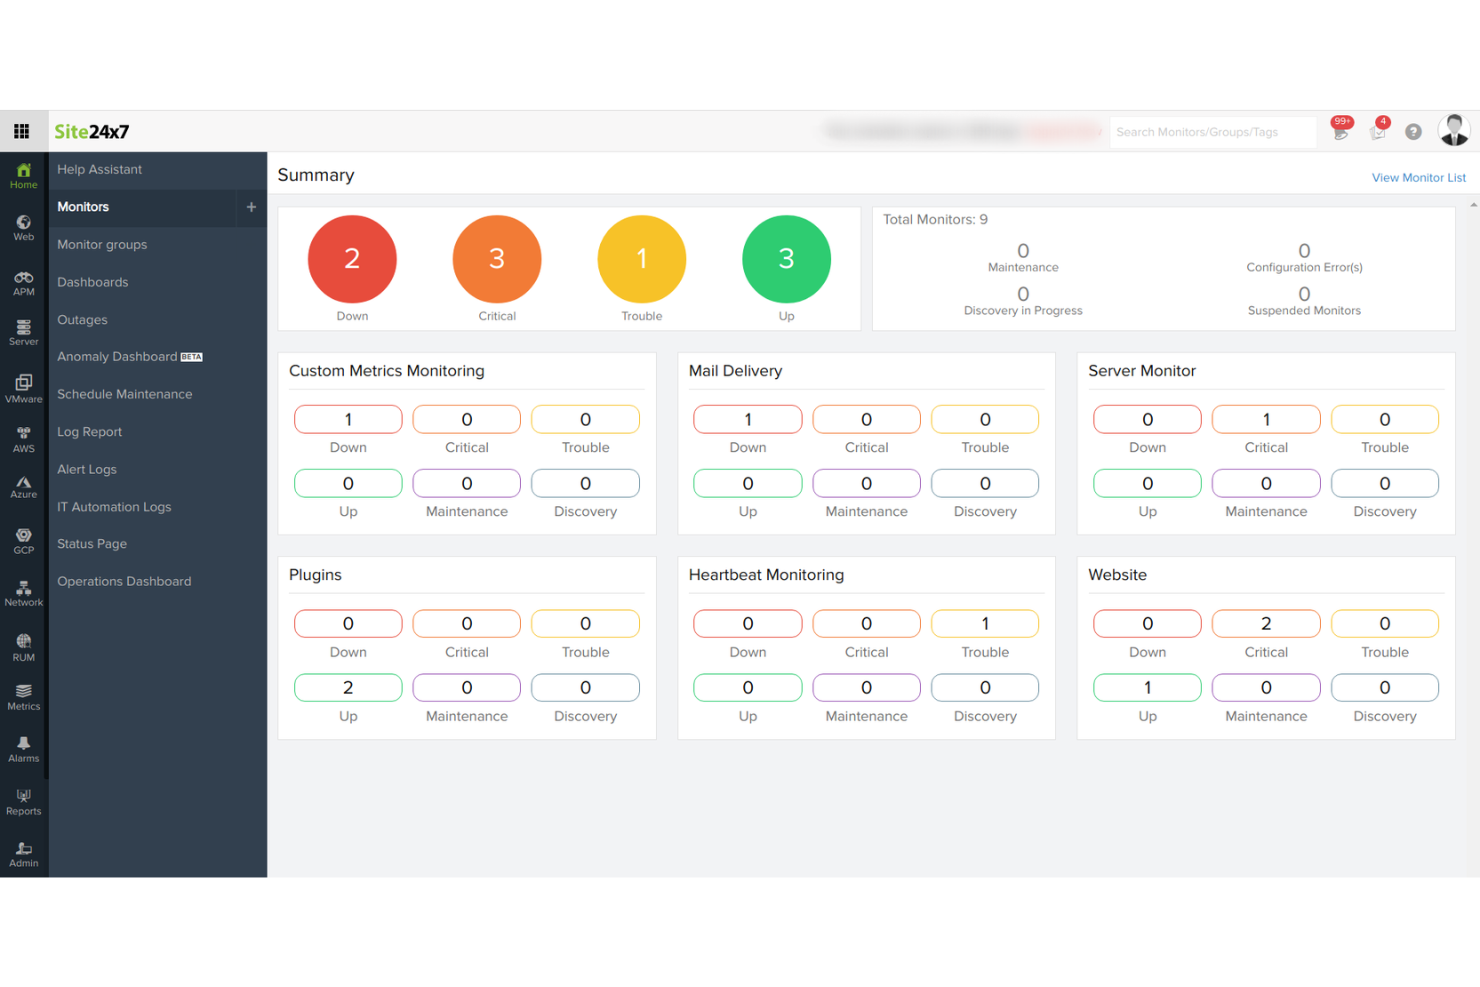
Site24x7 gives IT teams and managed service providers a unified platform to monitor server health, performance, and uptime across cloud and on-premises environments, helping you catch issues before they impact users.
Who Is Site24x7 Best For?
Site24x7 is a good fit for IT teams and MSPs that manage mixed infrastructure environments and need a single tool to monitor servers, applications, and networks together.
Why I Picked Site24x7
Site24x7 earns its spot on my shortlist because of how deep it goes on server metric tracking. I can monitor CPU usage, memory, disk I/O, network throughput, and running processes all from a single dashboard—without needing to stitch together separate tools. I also like the process monitoring feature, which lets me track specific services and get alerted the moment one stops responding. Site24x7's server monitoring reports give me historical performance data I use to spot trends before they turn into incidents.
Site24x7 Key Features
- AI-powered anomaly detection: Site24x7 uses machine learning to flag unusual server behavior and forecast performance degradation before it causes an outage.
- Log management: Collect, search, and analyze server log data directly within the platform to correlate log events with performance metrics.
- VMware and container monitoring: Track VMware ESX/ESXi hosts, Docker containers, and Kubernetes clusters alongside physical servers from one console.
- Customizable alerting: Set threshold-based or anomaly-triggered alerts with escalation policies to route notifications to the right team members.
Site24x7 Integrations
Site24x7 offers 100+ native integrations, including AWS, Azure, Google Cloud Platform, Microsoft Teams, Slack, PagerDuty, Jira, ServiceNow, Opsgenie, Datadog, and Zapier. An API is available for custom integrations.
Pros and Cons
Pros:
- Customizable dashboards and reports
- Real-time alerts and notifications
- Comprehensive monitoring capabilities
Cons:
- Limited customization in alerting mechanisms
- Complexity in initial setup for large environments
New Product Updates from Site24x7

Site24x7 Enhances Network Monitoring With Device and Visibility Updates
Site24x7 introduces proactive hardware health monitoring, expanded device support, centralized network controls, and enhanced SD-WAN visualization to improve network monitoring and management. For more information, visit Site24x7’s official site.
 .
.
Sentry gives IT teams and developers real-time visibility into server-side errors and performance issues, helping you identify, diagnose, and resolve problems across distributed systems and cloud environments.
Who Is Sentry Best For?
Sentry is a strong fit for engineering and DevOps teams building and maintaining complex, multi-service applications who need deep visibility into errors and performance at the code level.
Why I Picked Sentry
I picked Sentry as one of the best because its distributed tracing goes deeper than most monitoring tools. Where other platforms show you that something is slow, Sentry's Trace Explorer lets you follow a single request across every service, database call, and API hop—so you can pinpoint the exact span causing a latency spike without jumping between tools. I also like how errors and traces are connected in the same view, meaning when a background job fails, I can see what triggered it upstream. Seer—Sentry's AI debugging agent—analyzes stack traces, logs, replays, and trace data together to automatically root-cause issues and even suggest a fix.
Sentry Key Features
- Real-time error monitoring: Captures and groups exceptions as they occur across your server-side applications, with full stack traces and contextual data attached to each issue.
- Performance monitoring: Tracks transaction throughput, latency percentiles, and slow database queries to surface bottlenecks in backend services.
- Session replay: Records user sessions so you can reproduce the exact conditions that led to a server-side error or crash.
- Custom alerting: Lets you configure threshold- or anomaly-based alerts on error rates, latency, and performance metrics across specific projects or environments.
Sentry Integrations
Sentry offers 100+ native integrations, including GitHub, GitLab, Jira, Slack, Trello, PagerDuty, Datadog, AWS, Azure DevOps, Google Cloud Platform, and Zapier. An API is available for custom integrations and automation with CI/CD workflows.
Pros and Cons
Pros:
- Strong error tracking with per-user exception tracking
- Comprehensive monitoring, including performance and crash reporting
- Effective frontend observability with session replay features
Cons:
- Less coverage for infrastructure-level monitoring
- Complex implementation especially for diverse platform stacks
New Product Updates from Sentry

Sentry Adds AI Dashboard Generation in Beta
Sentry introduces AI Dashboard Generation in beta, enabling users to create dashboards using prompts through an agent. This makes dashboard setup faster and easier without manual configuration. For more information, visit Sentry’s official site.
 .
.
Dynatrace gives IT teams and enterprises a unified platform to monitor server health, analyze infrastructure performance, and pinpoint issues across complex cloud and hybrid environments.
Who Is Dynatrace Best For?
Dynatrace is a strong fit for large enterprises and DevOps teams managing complex, multi-cloud or hybrid infrastructures who need deep visibility across their full technology stack.
Why I Picked Dynatrace
Dynatrace earns its spot on my shortlist because of how its Davis AI engine handles root cause analysis. Instead of surfacing a flood of alerts for my team to sort through, Davis automatically pinpoints the exact source of a performance issue—down to the code level—before users are even impacted. I also like the Smartscape dependency graph, which gives a real-time map of how services, processes, and hosts connect, so when an application slows down, I can see exactly which upstream or downstream component is responsible. That combination of causal AI and live topology mapping makes it genuinely different from tools that just collect metrics and leave the diagnosis to you.
Dynatrace Key Features
- OneAgent deployment: A single agent installs on any host and automatically collects metrics, logs, traces, and topology data across your full stack without manual configuration.
- Log monitoring with Grail: Dynatrace's Grail data lakehouse ingests and stores logs in context with traces and metrics, so you can query across all data types without managing schemas or storage tiers.
- AutomationEngine: Connects with incident management and remediation tools to trigger auto-remediation workflows, automatic ticketing, and real-time CMDB updates when issues are detected.
- OpenPipeline: A high-performance stream processing layer that ingests, enriches, and contextualizes data from any source before it reaches storage or analytics.
Dynatrace Integrations
Dynatrace offers 650+ native integrations, including ServiceNow, AWS, Azure, Google Cloud Platform, Kubernetes, VMware, Red Hat OpenShift, Slack, PagerDuty, Jira, and Zapier. An API is available for custom integrations and automation.
Pros and Cons
Pros:
- A wide array of integrations
- Comprehensive application monitoring
- Deep AI-driven insights
Cons:
- The setup might be challenging for novices
- Complexity requires dedicated training
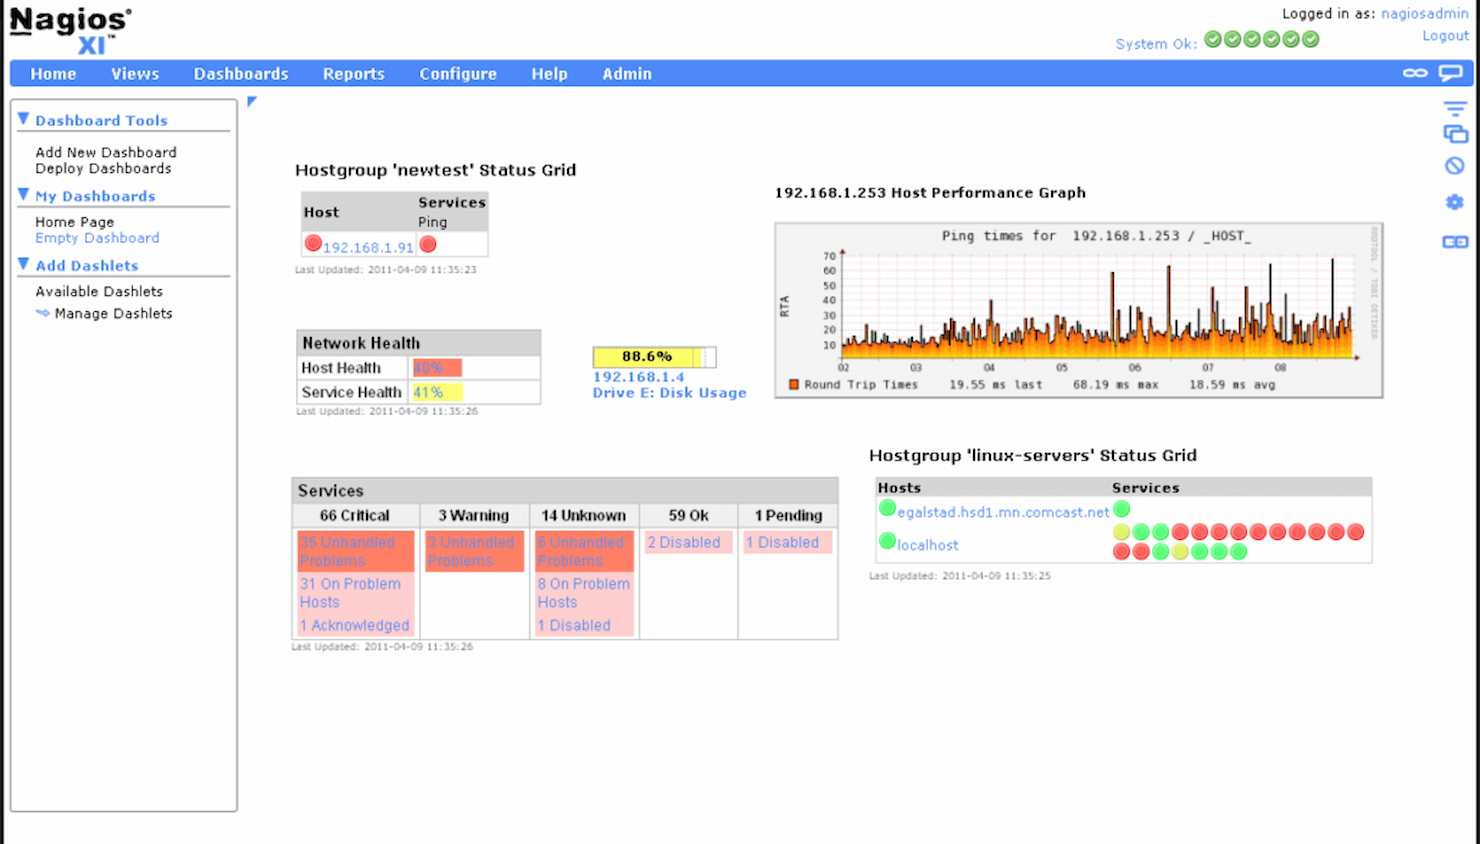
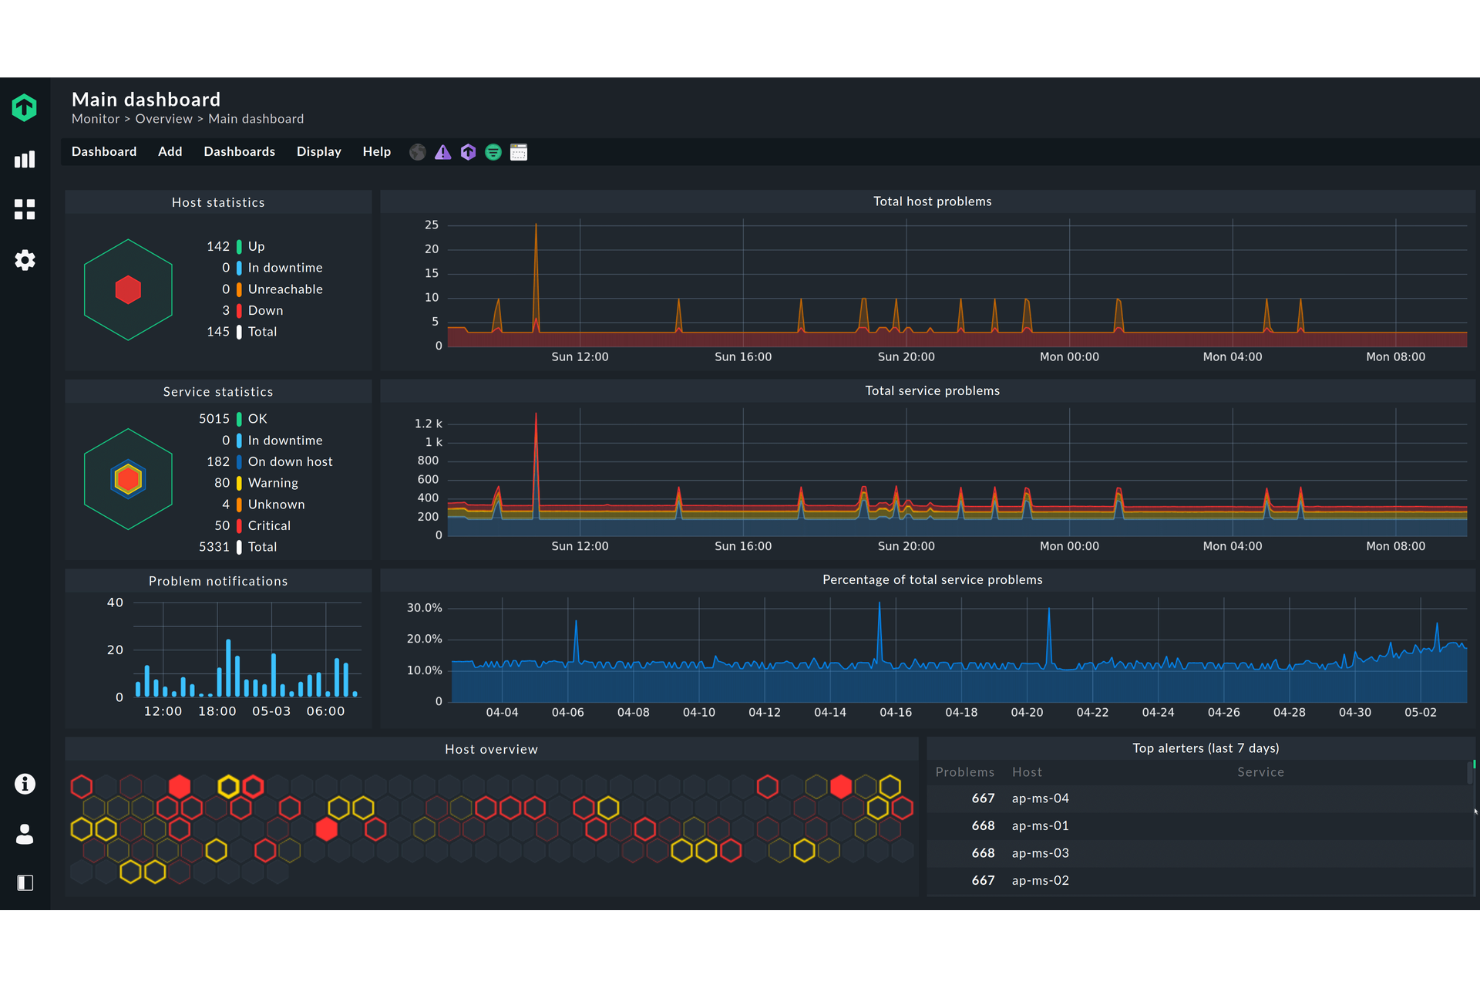
Nagios is a monitoring platform built for IT teams and system administrators who need to track server health, performance, and uptime across complex environments.
Who Is Nagios Best For?
Nagios is a strong fit for mid-to-large IT teams managing complex, multi-component infrastructure who need deep visibility across servers, networks, and applications.
Why I Picked Nagios
Nagios earns its spot on my shortlist because of how much ground it covers across a single infrastructure monitoring setup. I picked it specifically for teams running mixed environments—where you've got Windows servers sitting alongside Linux boxes, cloud instances, and on-prem hardware all needing visibility at once. Nagios XI's plugin-based architecture lets my team monitor everything from CPU load and disk I/O to web server processes and database services without switching tools. I also rely heavily on its threshold-based alerting with escalation routing, which means the right person gets paged at the right time instead of everyone getting flooded with noise.
Nagios Key Features
- Network performance monitoring: Track bandwidth usage, packet loss, and latency across routers, switches, and firewalls in real time.
- Scheduled downtime management: Define maintenance windows so alerts are suppressed during planned outages and don't trigger false incidents.
- Capacity planning reports: Generate historical trend reports on server resource usage to forecast when hardware or services will hit their limits.
- Event handler automation: Configure automated scripts to run in response to specific alert conditions, enabling self-healing actions without manual intervention.
Nagios Integrations
Nagios offers native integrations with PagerDuty, Opsgenie, ServiceNow, Splunk, Amazon CloudWatch, Microsoft Teams, Slack, Jira, and has an API for custom integrations.
Pros and Cons
Pros:
- Strong third-party integrations
- Customizable dashboards
- Wide-ranging monitoring capabilities
Cons:
- The interface can appear dated compared to newer platforms
- The annual licensing model may not suit all businesses
Datadog gives IT teams and DevOps professionals a unified platform to monitor server health, track performance metrics, and troubleshoot issues across complex cloud and hybrid environments.
Who Is Datadog Best For?
Datadog is a strong fit for mid-size to enterprise engineering teams running cloud-native or hybrid infrastructure at scale.
Why I Picked Datadog
Datadog earns its spot on my shortlist because of how well it handles monitoring at cloud scale, where the sheer volume of hosts, containers, and services makes most tools buckle. I like that it tracks tens of thousands of infrastructure metrics out of the box, with continuous historical records that persist even after infrastructure is decommissioned—something that's genuinely useful when you're doing post-incident analysis on ephemeral cloud resources. I also use the tag-based search and analytics to slice across multi-cloud environments without writing complex queries, which saves real time when you're managing hundreds of hosts across AWS, Azure, and GCP simultaneously. The AIOps-driven alert correlation is another feature I rely on heavily—it surfaces the signal from the noise instead of flooding on-call engineers with redundant alerts.
Datadog Key Features
- Live process monitoring: View real-time CPU, memory, and I/O consumption at the individual process level across all your hosts.
- Network performance monitoring: Track request volume, latency, and errors between services and infrastructure components across your environment.
- Log management: Collect, parse, and search logs from servers and services, with the ability to correlate them directly with metrics and traces.
- Custom dashboards: Build visualizations that combine metrics, logs, and traces from across your infrastructure into a single view.
Datadog Integrations
Datadog offers 600+ native integrations, including AWS, Azure, Google Cloud Platform, Kubernetes, Docker, Slack, PagerDuty, Jira, GitHub, ServiceNow, and Zapier. An API is available for custom integrations.
Pros and Cons
Pros:
- Extensive integrations list
- Comprehensive monitoring and alerting
- Tailored for cloud environments
Cons:
- Additional costs for extra features
- The learning curve for advanced features
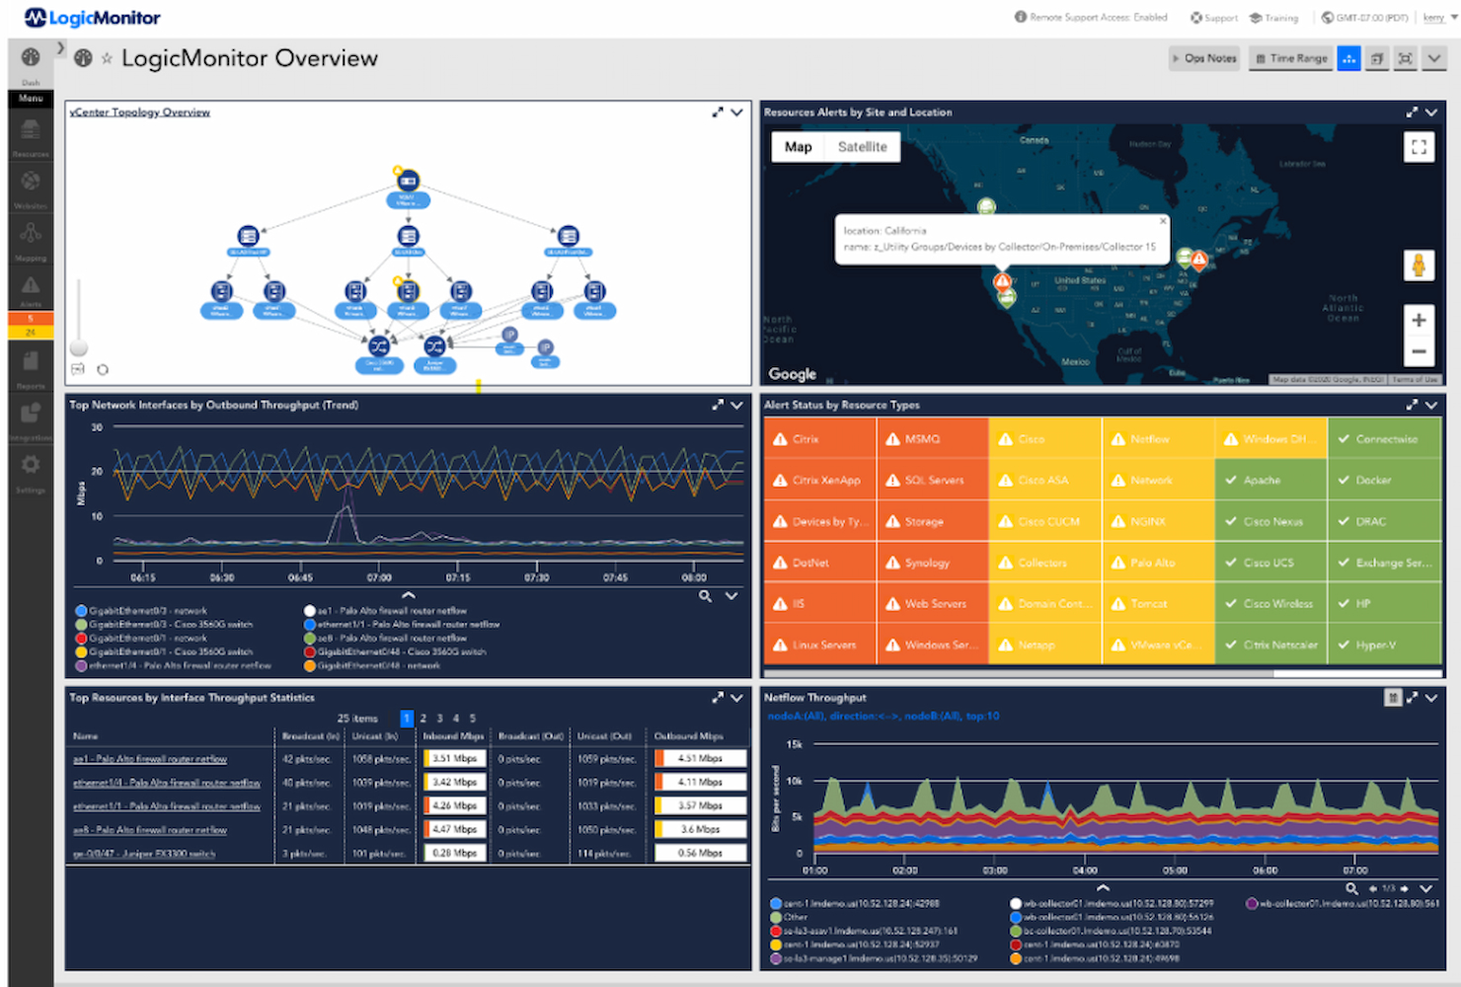
LogicMonitor gives IT teams and managed service providers a unified platform to monitor server health, performance, and availability across complex environments, helping you detect issues early and maintain uptime.
Who Is LogicMonitor Best For?
LogicMonitor is a strong fit for mid-to-large enterprises and managed service providers running mixed on-premises and cloud infrastructure.
Why I Picked LogicMonitor
LogicMonitor earns its spot on my shortlist because it handles hybrid infrastructure monitoring better than most tools I've tested. I like how it automatically discovers and maps servers, VMs, containers, and cloud resources without requiring manual configuration—so my team isn't spending hours setting up coverage every time something new gets provisioned. Its LM Envision platform gives me a single pane of glass across on-premises and cloud environments, which is genuinely useful when incidents don't respect infrastructure boundaries. The AIOps-driven anomaly detection also catches performance deviations before they escalate into outages.
LogicMonitor Key Features
- Customizable dashboards: Build role-specific views that surface server metrics, resource utilization, and alert statuses in a single screen.
- Threshold-based alerting: Set static or dynamic thresholds on CPU, memory, disk, and network metrics to trigger alerts before performance degrades.
- Root cause analysis: Correlate alerts across dependent infrastructure layers to pinpoint the source of an issue rather than chasing symptoms.
- Forecasting reports: Generate capacity planning reports based on historical server performance trends to anticipate resource constraints.
LogicMonitor Integrations
LogicMonitor offers 200+ native integrations, including ServiceNow, PagerDuty, Slack, Jira, AWS, Azure, Google Cloud Platform, VMware, Cisco, NetApp, and Zapier. An API is available for custom integrations.
Pros and Cons
Pros:
- Intuitive and user-friendly interface
- Automated device discovery
- Comprehensive hybrid infrastructure coverage
Cons:
- Requires training to exploit advanced features
- The initial setup might be complex

AppDynamics gives IT teams and enterprise organizations real-time visibility into server health, application performance, and infrastructure dependencies to help them identify and resolve issues faster across complex environments.
Who Is AppDynamics Best For?
AppDynamics is a strong fit for large enterprises running complex, distributed applications who need deep visibility across their full technology stack.
Why I Picked AppDynamics
AppDynamics earns its spot on my shortlist because of how it connects server and application performance directly to business outcomes. I picked it specifically for its business transaction monitoring, which tracks individual transactions—like user logins, shopping cart additions, or checkout flows—end to end across every tier of the stack. When something slows down or breaks, I can see exactly where in the transaction path the issue originated, whether that's a database query, a third-party API call, or a specific code-level problem. Pair that with business performance analytics, which maps transaction data to revenue and conversion metrics in real time, and you get a level of context that most server monitoring tools don't offer.
AppDynamics Key Features
- Anomaly detection and root cause analysis: AppDynamics uses AI and ML to baseline normal behavior, detect anomalies, and pinpoint root cause across the stack.
- Full-context infrastructure monitoring: Monitor hybrid and on-premises environments with a consolidated view of application services and infrastructure correlated with business metrics.
- Digital experience monitoring: Track web, mobile, and synthetic user interactions across any device, browser, API, or third-party service to identify issues affecting end users.
- AI applications and LLM monitoring: Monitor the compliance, cost, and performance of generative AI and large language model applications running in your environment.
AppDynamics Integrations
AppDynamics offers 100+ native integrations, including ServiceNow, PagerDuty, Splunk, Amazon Web Services, Microsoft Azure, Google Cloud Platform, Cisco Secure Application, Slack, Jira, and Zapier. An API is available for custom integrations.
Pros and Cons
Pros:
- Wide-ranging integration support
- Real-time performance metrics
- Detailed business transaction insights
Cons:
- Can be resource-intensive on monitored systems
- Higher pricing tier

New Relic gives IT teams and DevOps professionals a unified platform to monitor server health, track infrastructure performance, and pinpoint issues across complex environments.
Who Is New Relic Best For?
New Relic is a strong fit for mid-size to enterprise engineering and DevOps teams managing distributed systems across cloud, hybrid, or on-premises infrastructure.
Why I Picked New Relic
New Relic earns its spot as one of the best on my shortlist because of how well it connects real-time application analytics to what's actually happening at the infrastructure level. I like that APM 360 gives my team code-level visibility—so when a transaction slows down, I can trace it from the browser all the way through to the server without jumping between tools. Transaction 360 is particularly useful here: it builds a dynamic view of the entire app stack affecting a specific transaction, which makes root cause analysis much faster than digging through logs manually. New Relic's customizable dashboards also let me combine application performance metrics with infrastructure data in a single view, so I'm not context-switching to understand whether a spike in response time is an app issue or a server resource problem.
Steve Morris, Founder and CEO at NEWMEDIA.COM, shared: “The one feature that has yielded the most gains for our ops teams in the real world is deployment markers. At our scale (130 digital brands and 10+ million sessions a month) even small changes can propagate in unexpected ways.”
New Relic Key Features
- Infrastructure monitoring: Tracks host health, events, and alert activity across cloud, on-premises, and hybrid environments in a single unified view.
- Smart Alerts: Uses dynamic thresholds based on historical volatility to detect anomalies and reduce false positives across your entire estate.
- Change tracking: Links deployment and configuration change events directly to performance shifts so you can identify what caused a spike.
- Network monitoring: Surfaces network performance metrics—including TCP handshake latency, retransmissions, and DNS failures—alongside infrastructure and application data.
New Relic Integrations
New Relic offers 600+ native integrations, including AWS, Azure, Google Cloud Platform, Kubernetes, Docker, Jenkins, PagerDuty, Slack, Jira, GitHub, and Zapier. An API is available for custom integrations and automation.
Pros and Cons
Pros:
- Broad cloud platform support
- Real-time analytics capability
- In-depth application monitoring
Cons:
- Custom instrumentation requires effort
- Might be overwhelming for newcomers

Dotcom Monitor gives IT teams and businesses a way to monitor server uptime, performance, and network health with detailed dashboards and real-time alerts, helping you catch issues before they impact users.
Who Is Dotcom Monitor Best For?
Dotcom Monitor is a strong fit for IT teams and DevOps professionals who need to monitor server uptime and web performance across distributed infrastructure.
Why I Picked Dotcom Monitor
I picked Dotcom Monitor as one of the best because of how it handles real user interaction simulation through its EveryStep Web Recorder. I use it to script multi-step user journeys—such as login flows, cart additions, and checkout sequences—and run those scripts continuously from over 30 global locations. What I find especially useful is that every monitoring test can capture a video session synced with a waterfall chart, so when a transaction fails, I can watch exactly what broke and at which step. That level of visibility goes well beyond what basic ping-based or HTTP checks can offer.
Dotcom Monitor Key Features
- Private monitoring agents: Deploy agents inside your private network to monitor internal applications, custom protocols, and infrastructure without exposing traffic outside your security perimeter.
- SSL certificate monitoring: Track SSL certificate expiration dates and receive alerts before certificates lapse, helping you avoid unexpected outages caused by expired certificates.
- Multi-location uptime checks: Run continuous availability checks from 30+ global locations at intervals as short as one minute to confirm your servers are reachable worldwide.
- Role-based alert routing: Direct alerts to specific team members based on their role, so the right person is alerted without flooding the team.
Dotcom Monitor Integrations
Dotcom Monitor offers native integrations with PagerDuty, Slack, Microsoft Teams, ServiceNow, Splunk, and Zapier. An API is available for building custom integrations and connecting with CI/CD workflows.
Pros and Cons
Pros:
- Supports complex user journeys
- In-depth analysis of server performance issues
- Insights from multiple global monitoring points
Cons:
- Limited customization for alerts
- Higher cost for SMBs

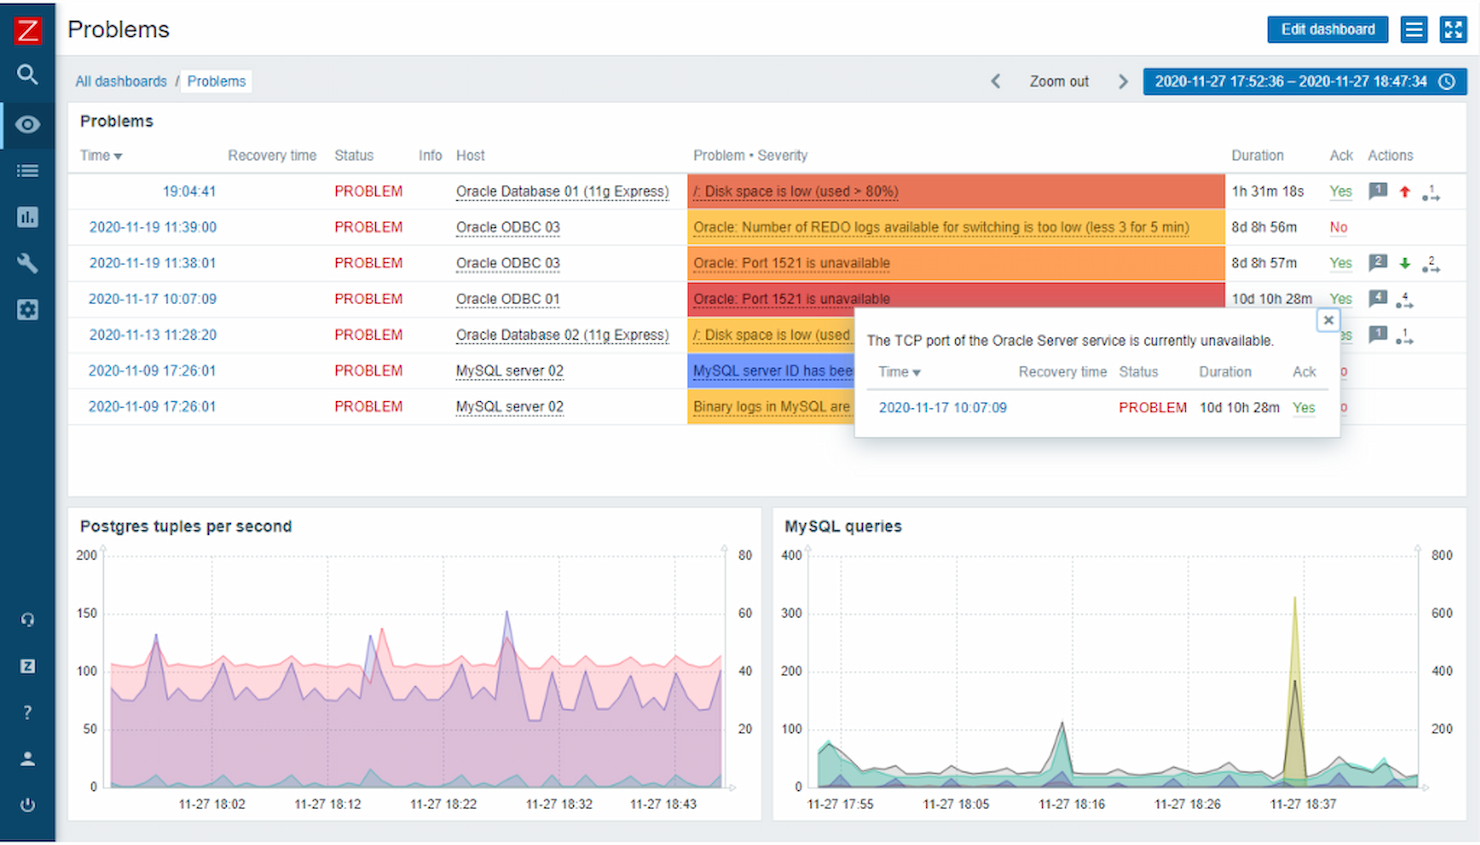
Zabbix is an open-source monitoring solution tailored for diverse and expansive IT environments. It excels in providing robust monitoring solutions that expand with growing enterprise needs, particularly vast networks.
Why I Picked Zabbix: I chose Zabbix after careful comparison, valuing its ability to adapt to varying scales of networks without compromising on performance. Its expansive features and adaptability make it a prime choice for large-scale enterprises. This scaling capability, especially for extensive networks, solidifies its position as best for scalability with large networks.
Standout features & integrations:
Zabbix boasts features like auto-discovery, distributed monitoring, and detailed reporting. Additionally, it provides real-time graphing for faster insights. As for integrations, Zabbix is compatible with tools like Grafana, Elasticsearch, and integration platforms like Zapier, fostering wider operational cohesion.
Pros and Cons
Pros:
- Detailed real-time graphing
- Open-source, offering customization options
- Extensive scalability for large networks
Cons:
- Heavy customization might demand skilled personnel
- otential complexity for beginners
- Requires dedicated setup time
Other Server Monitoring Tools
Here are some additional server monitoring tools options that didn’t make it onto my shortlist, but are still worth checking out:
- Prometheus
For powerful query language capabilities
- Sensu
Good for flexible monitoring via plugins
- ManageEngine
For integrated IT management


Related IT Software Reviews
If you still haven't found what you're looking for here, check out these alternative tools that we've tested and evaluated.
- Network Monitoring Software
- Server Monitoring Software
- SD-Wan Solutions
- Infrastructure Monitoring Tools
- Packet Sniffer
- Application Monitoring Tools
Server Monitoring Tool Selection Criteria
When selecting the best server monitoring tools to include in this list, I considered common buyer needs and pain points like real-time alerting and ease of integration. I also used the following framework to keep my evaluation structured and fair:
Core Functionality (25% of total score)
To be considered for inclusion in this list, each solution had to fulfill these common use cases:
- Monitor server uptime
- Track server performance metrics
- Provide real-time alerts
- Generate performance reports
- Support multi-platform environments
Additional Standout Features (25% of total score)
To help further narrow down the competition, I also looked for unique features, such as:
- AI-driven insights
- Customizable dashboards
- Predictive analytics
- Advanced security monitoring
- Cloud-native capabilities
Usability (10% of total score)
To get a sense of the usability of each system, I considered the following:
- Intuitive user interface
- Easy navigation
- Minimal learning curve
- Responsive design
- Customization options
Onboarding (10% of total score)
To evaluate the onboarding experience for each platform, I considered the following:
- Availability of training videos
- Interactive product tours
- Access to templates
- Chatbot support
- Webinars for new users
Customer Support (10% of total score)
To assess each software provider’s customer support services, I considered the following:
- 24/7 support availability
- Access to a knowledge base
- Live chat options
- Email support responsiveness
- Availability of dedicated account managers
Value For Money (10% of total score)
To evaluate the value for money of each platform, I considered the following:
- Competitive pricing
- Flexible payment plans
- Features included in base package
- Cost of add-ons
- Discounts for annual subscriptions
Customer Reviews (10% of total score)
To get a sense of overall customer satisfaction, I considered the following when reading customer reviews:
- Frequency of positive feedback
- Commonly cited drawbacks
- User-reported reliability
- Feedback on customer support
- Value for money perception
How to Choose Server Monitoring Tools
It’s easy to get bogged down in long feature lists and complex pricing structures. To help you stay focused as you work through your unique software selection process, here’s a checklist of factors to keep in mind:
| Factor | What to Consider |
| Scalability | Ensure the tool can grow with your business. Look for enterprise monitoring software that can handle increased data and users without performance dips, especially if you're expanding. |
| Integrations | Check compatibility with existing systems. The tool should easily integrate with your current software stack, like AWS, Azure, or Slack, to save time and effort. |
| Customizability | Opt for tools that allow you to tailor dashboards and reports. This ensures that your team gets the specific insights needed without unnecessary clutter. |
| Ease of Use | Evaluate the interface for intuitiveness. Your team should navigate it effortlessly, reducing the learning curve and speeding up adoption. |
| Budget | Compare pricing plans to fit your financial constraints. Consider the total cost, including hidden fees or necessary add-ons, to avoid budget overruns. |
| Security Safeguards | Prioritize tools with strong security measures. Ensure data encryption, access controls, and compliance with industry standards to protect sensitive information. |
| Reliability | Look for proven uptime guarantees. A reliable tool ensures continuous monitoring without frequent outages, keeping your operations smooth. |
| Support Options | Consider the availability and quality of customer support. Access to 24/7 support, dedicated account managers, and comprehensive help resources is crucial. |
Trends in Server Monitoring Tools
In my research, I sourced countless product updates, press releases, and release logs from different server monitoring tools vendors. Here are some of the emerging trends I’m keeping an eye on:
- AI-Driven Insights: Many tools now use AI to provide predictive analytics, helping you foresee issues before they occur. This trend is making monitoring more proactive, with Nagios alternative vendors like Dynatrace incorporating AI for smarter alerts and diagnostics.
- Full-Stack Observability: Users want visibility across their entire tech stack, not just servers. Tools like New Relic are expanding to offer insights into applications, infrastructure, and user experiences all in one place, giving a holistic view.
- Real-Time Data Visualization: As data grows, the need for real-time visualization becomes key. Vendors are enhancing dashboards to show live data streams, allowing teams to react instantly to changes in their environments.
- Cloud-Native Monitoring: With more businesses moving to the cloud, monitoring tools are evolving to support cloud-native architectures. Solutions like Datadog offer features specifically for cloud environments, ensuring compatibility and efficiency.
- Enhanced Security Monitoring: Security is a growing concern, and tools are now offering more advanced security features. Monitoring solutions are integrating threat detection and compliance checks to safeguard data, addressing user demand for safer systems.
What Are Server Monitoring Tools?
Server monitoring tools continuously track server health and performance—CPU, memory, disk, I/O, processes, services, and network—so IT and DevOps teams can detect issues early, resolve incidents faster, and maintain SLOs across on-prem, cloud, and hybrid environments.
Real-time alerts, performance metrics, and data visualization capabilities help with proactive monitoring and quick problem resolution, similar to how website monitoring tools track uptime and performance.
Features of Server Monitoring Tools
When selecting server monitoring tools, keep an eye out for the following key features:
- Real-time monitoring: Get instant updates on your server's health and performance. Real-time monitoring lets you spot issues as they happen, so you can jump in and fix things before they become big problems.
- Automated alerts: Receive notifications via email, SMS, or dashboard alerts when your servers hit set thresholds for CPU, memory, disk space, or other metrics. You won't need to manually babysit your servers; the system will give you a heads-up when it's time to take action.
- Resource usage tracking: Monitor detailed statistics like CPU utilization, memory consumption, disk activity, and network traffic across all your servers. This helps you make smarter decisions about upgrades, scaling, or load balancing.
- Historical data and reports: Access logs and reports that track server performance over time. Reviewing historical trends helps you identify recurring issues or times when you might need extra server muscle.
- Customizable dashboards: Personalize your monitoring dashboard to show the information that matters most to you. Drag-and-drop widgets let you visualize key metrics and get an at-a-glance overview that fits your workflow.
- Process and service monitoring: Keep tabs on specific processes or services running on your servers. You'll know immediately if a critical task stops working, so you can get everything back on track fast.
- Multi-platform support: Monitor servers regardless of their operating system—whether that's Windows, Linux, or macOS. You can manage mixed environments without switching tools.
- Integration with notification systems: Connect your monitoring tool to collaboration apps like Slack or ticketing tools. This saves you back-and-forth emails and helps your team act quickly when something needs attention.
- Security and access controls: Control who can see or change your monitoring configurations. Strong security features help you prevent unauthorized changes and keep sensitive server information locked down.
- Scalability: Easily add new servers and services as your business grows. This ensures that your monitoring solution keeps up with your expanding needs without missing a beat.
Common AI Features for Server Monitoring Tools
Modern server monitoring tools often leverage artificial intelligence to enhance performance and streamline management. Here are some common AI-driven features to look for:
- Anomaly detection: AI algorithms automatically identify unusual patterns or deviations in server performance, helping you catch issues before they escalate.
- Predictive analytics: Machine learning models forecast potential server failures or resource shortages, allowing you to take preventive action and minimize downtime.
- Automated root cause analysis: AI quickly pinpoints the source of performance problems, reducing the time and effort needed for troubleshooting.
- Intelligent alerting: Smart systems minimize false positives by learning your server’s normal behavior and only notifying you when something truly requires attention.
- Capacity planning: AI analyzes usage trends to recommend optimal resource allocation and scaling strategies, ensuring your servers can handle future demands.
- Self-healing automation: Some tools use AI to automatically resolve common issues—like restarting services or reallocating resources—without human intervention.
- Adaptive monitoring thresholds: AI dynamically adjusts alert thresholds based on historical data and usage patterns, keeping notifications relevant as your environment evolves.
Benefits
Implementing server monitoring tools provides several benefits for your team and your business. Here are a few you can look forward to:
- Proactive issue resolution: Real-time alerts and predictive analytics let your team address issues before they escalate, reducing downtime.
- Enhanced performance: Monitoring performance metrics helps maintain optimal server operations, improving overall efficiency.
- Informed decision-making: Customizable dashboards and automated reporting provide insights that help guide your team's strategic choices.
- Increased security: Security monitoring features detect threats and ensure compliance, protecting your data from potential breaches.
- Scalability support: Tools designed for scalability grow with your business, accommodating increased data and user loads seamlessly.
- Comprehensive visibility: Full-stack observability gives your team a complete view of your infrastructure, enhancing monitoring capabilities.
Costs and Pricing
Selecting server monitoring tools requires an understanding of the various pricing models and plans available. Costs vary based on features, team size, add-ons, and more. The table below summarizes common plans, their average prices, and typical features included in server monitoring tools solutions:
Plan Comparison Table for Server Monitoring Tools
| Plan Type | Average Price | Common Features |
| Free Plan | $0 | Basic monitoring, limited dashboards, and standard alerts. |
| Personal Plan | $5-$25/user/month | Performance metrics, customizable dashboards, and basic reporting. |
| Business Plan | $30-$75/user/month | Advanced analytics, real-time alerts, and integration capabilities. |
| Enterprise Plan | $100-$300/user/month | Full-stack observability, predictive analytics, and dedicated support. |
Server Monitoring Tool FAQs
Here are some answers to common questions about server monitoring tools:
Why is inventory tracking important in cyber security?
Inventory tracking is crucial for cyber security because it helps you identify, monitor, and manage every device and software asset in your IT environment. With a complete inventory, you can spot unauthorized devices, track vulnerabilities, and ensure software stays within compliance. Accurate tracking helps reduce data breaches by highlighting gaps in security or patch management and gives you a clear picture for audits and incident response.
How can IT inventory management software help with compliance audits?
IT inventory management software supports compliance audits by maintaining accurate records of all hardware and software assets. You can quickly generate reports, trace asset histories, and prove licensing or configuration details on demand. Automated documentation and change logs help you stay ready for audits, reduce manual paperwork, and simplify regulatory checks.
What integrations should I look for in IT inventory management tools?
Look for IT inventory tools that integrate with your existing systems such as help desk software, configuration management databases (CMDBs), application server software, and endpoint management solutions. Integrations with security tools, directory services, and cloud providers streamline workflows and ensure your inventory data stays up to date across your IT stack.Server monitoring tools continuously track server health and performance—CPU, memory, disk, I/O, processes, services, and network—so IT and DevOps teams can detect issues early, resolve incidents faster, and maintain SLOs across on-prem, cloud, and hybrid environments.
How do these tools support remote or hybrid work environments?
Most modern IT inventory management platforms offer cloud access, remote agent installation, and real-time syncing. You can monitor devices anywhere—whether at home or in different offices—track hardware assigned to remote workers, and automate updates. This means you reduce blind spots and can respond faster to issues, no matter where your team is located.
What features help reduce hardware loss or device theft?
Many IT inventory management tools offer asset tagging, geolocation, check-in/check-out logs, and alerts for unusual activity. These features let you track device assignments, log movement, and recover lost hardware faster. You can also set up automated reminders for device returns or maintenance, minimizing the risk of loss or theft.
How does automated asset discovery work in modern inventory management platforms?
Automated asset discovery scans your network to find all connected devices and installed software. The system continuously updates your inventory, detects new or unauthorized assets, and helps you maintain an accurate asset database. This saves you time, improves security, and reduces manual tracking errors.
What’s Next
If you're researching server monitoring software, connect with a SoftwareSelect advisor for free recommendations.
Fill out a form and schedule a chat to share the specifics of your needs. You'll receive a shortlist of software to review and support through the entire buying process, including price negotiations.