30 Best Network Monitoring Software Reviewed for 2025

Best Network Monitoring Software Shortlist
Here are my top 12 tools to optimize your network performance:
Our one-on-one guidance will help you find the perfect fit.


Network monitoring software helps teams detect outages, spot performance issues, and keep their systems running reliably across devices and locations.
Many teams start looking for a new tool when they are missing alerts, struggling with slow dashboards, or trying to track down bottlenecks without clear data. It can also be hard to tell which tools match your network size, complexity, and budget without testing them all yourself.
I’ve worked with a range of teams to evaluate network monitoring tools based on how they actually perform under real traffic, not just on paper. This guide is based on that hands-on experience to help you find a tool that fits your infrastructure and helps you stay ahead of problems before they cause downtime.
Why Trust Our Network Monitoring Software Reviews?
We’ve been testing and reviewing IT software since 2023. As IT specialists, we know how critical and complex it is to make the right decision when selecting software.
We invest in deep research to help our audience make better software purchasing decisions. We’ve tested over 2,000 tools for different IT use cases and written over 1,000 comprehensive software reviews. Learn how we stay transparent & our software review methodology.
Best Network Monitoring Summary
| Tool | Best For | Trial Info | Price | ||
|---|---|---|---|---|---|
| 1 | Best for multi-vendor network monitoring | 30-day free trial | Pricing upon request | Website | |
| 2 | Best for visual representations of networks | Free demo available | Pricing upon request | Website | |
| 3 | Best for unified MSP management | Free trial available | From $79/license/month (billed annually) | Website | |
| 4 | Best for scalable IT monitoring | Free trial available | Pricing upon request | Website | |
| 5 | Best for network visibility with device discovery | Free trial available | From $149/technician/month (billed annually) | Website | |
| 6 | Best for custom maps, dashboards, and reports | Free trial available | From $2,149/year | Website | |
| 7 | Best for comprehensive device coverage | Free trial + demo available | Pricing upon request | Website | |
| 8 | Best for unlimited endpoint monitoring | Free trial available | From $129/user/month (billed annually) | Website | |
| 9 | Best open-source solution | Free demo available | Free to use (with subscription options available) | Website | |
| 10 | Best for network monitoring in complex environments | 15-day free trial + demo available | From $0.0001 | Website | |
| 11 | Best for cloud-based network monitoring | Free trial available | From $3/resource/month | Website | |
| 12 | Best for real-time infrastructure monitoring | Free trial + demo available | From $4.50/node/month (billed annually) | Website | |
| 13 | Best for comprehensive network monitoring | 30-day free trial + Free edition (unavailable in the US, Canada, Japan, Taiwan) | Pricing upon request | Website |
-

Docker
Visit WebsiteThis is an aggregated rating for this tool including ratings from Crozdesk users and ratings from other sites.4.6 -
Pulumi
Visit WebsiteThis is an aggregated rating for this tool including ratings from Crozdesk users and ratings from other sites.4.8 -
GitHub Actions
Visit Website


Best Network Monitoring Software Reviews
Here you’ll find my choices for the best network monitoring software and tools:

With advanced features like fault management, performance monitoring, and bandwidth analysis, OpManager helps you proactively manage and optimize your network infrastructure.
Why I picked ManageEngine OpManager: If you’re looking for a multi-vendor network monitoring solution, then I think ManageEngine OpManager is the perfect choice. It supports popular hardware vendors like HP, D-Link, Juniper, Dell, 3Com, Cisco, Force10, NETGEAR, Fortinet, and NetScreen. You can also choose a vendor of your choice as it provides 245 built-in customizable device templates. These templates save the configuration commands for all vendors, so you don’t have to remember all configurations manually.
ManageEngine OpManager Standout Features and Integrations:
Features include its ability to provide real-time network performance monitoring across multi-vendor environments, offering deep compatibility with over 245 customizable device templates. Its built-in workflow automation simplifies repetitive network management tasks, like backup configuration and interface management. Additionally, the platform’s advanced visualization tools, including dynamic network maps and performance dashboards, give users an intuitive view of their IT infrastructure.
Integrations include ManageEngine ServiceDesk Plus, ServiceNow, Jira Service Management, Slack, and Microsoft Teams. APIs are also available.
Pros and cons
Pros:
- Router performance metrics like temperature, voltage, and buffer statistics
- Mapping and visualization of performance degradation and network outages
- 2,000+ performance metrics for network monitoring
Cons:
- Complex setup and configuration process
- Limited customization options for dashboards and reports

Auvik is a cloud-based network management software designed to provide visibility and control over network infrastructure. It enables organizations to monitor network performance, identify devices that need upgrading or replacement, and manage network configurations
Why I picked Auvik: Auvik earned its spot on this network monitoring software list because it offers automatic inventorying and visual mapping of network infrastructure. This feature helps save time, ensure data integrity, and promote better visibility of networks. Auvik also stands out for its real-time documentation updates and automated backups of network devices, making it a proactive tool for network management.
Auvik Standout Features and Integrations:
Features include network monitoring and troubleshooting, alerts and notifications for network events, syslog for faster issue resolution, VPN monitoring for remote worker protection, and internet connection check for instant connectivity issue diagnosis.
Integrations include ArcusTeam, Autotask PSA, BrightGauge, Captain's Chair, Slack, Microsoft Teams, ConnectWise, Continuum, Freshdesk, Global Dash, PagerDuty, and more.
Pros and cons
Pros:
- Quick and accurate alerting system
- Single dashboard monitoring
- Detailed visual graphical representation of networks
Cons:
- Could use more integrations
- Customizing the platform can be time consuming

SuperOps offers a network monitoring solution tailored for Managed Service Providers (MSPs), designed to streamline and enhance network oversight. Its unified platform integrates seamlessly with RMM tools, emphasizing ease of use, real-time data visibility, and cost efficiency. Key features include effortless setup, automatic device scanning, proactive alerts, and customizable monitoring options. Upcoming updates promise network discovery, topology visualization, and detailed dashboards, aiming to improve operational efficiency and productivity for MSPs.
Why I Picked SuperOps: Remote Monitoring and Management (RMM) is a type of software designed to help IT professionals manage and monitor IT infrastructure and endpoints. Incorporating network monitoring within RMM is crucial because it enables proactive identification and resolution of network issues, ensuring continuous network performance and reliability. This integration provides a holistic view of an organization’s IT environment, enhancing operational efficiency and minimizing downtime, which is essential for maintaining productivity and ensuring the security of networked systems.
SuperOps Standout Features and Integrations
Features include simple DIY setup, automated device scanning, proactive alert policies, and customizable monitoring. Future enhancements include network discovery, topology maps, and granular dashboards.
Integrations include Splashtop, Teamviewer, Connectwise Control, Xero, QuickBooks Online, QuickBooks Desktop, Webroot, Pax8, and more.
Pros and cons
Pros:
- Offers native integrations with popular third-party software, enhancing functionality
- Easy to use with a simple setup process, reducing the learning curve for new users
- Unified platform that integrates network monitoring with RMM, streamlining IT operations
Cons:
- Limited information on customization options for specific MSP needs
- As a relatively new player, may lack some advanced features found in established competitors
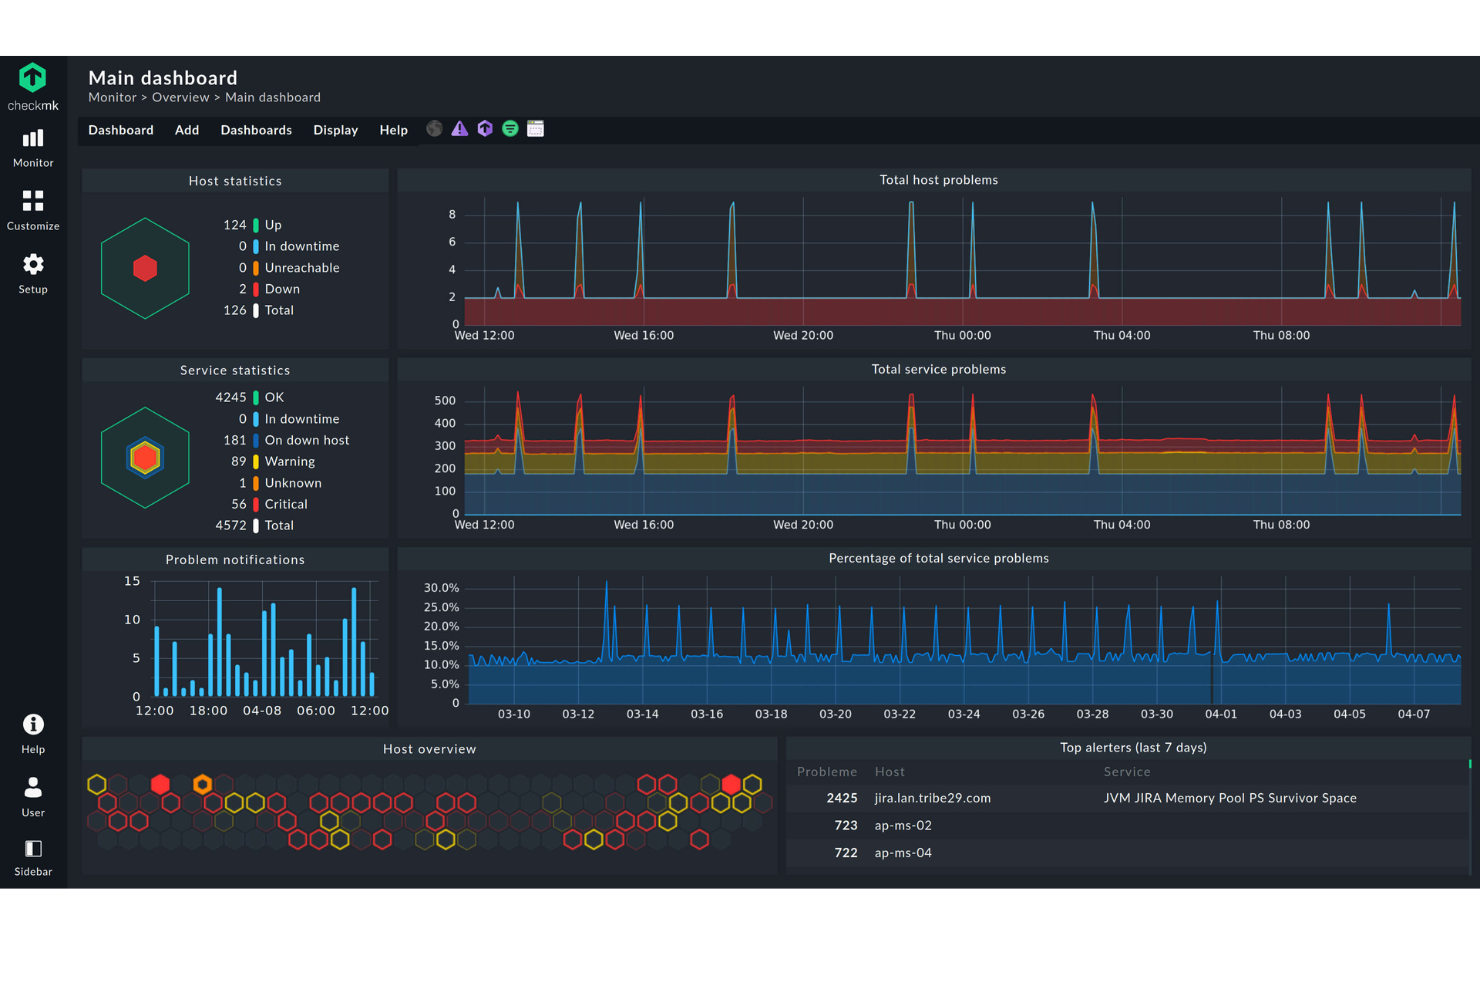
Checkmk is a powerful network monitoring software that provides everything you need to monitor hybrid environments. That includes on-premises servers, virtual machines, network devices, applications, and cloud services. Thanks to its optimized core, it scales with ease and can fit the needs of anything from small to enterprise-level infrastructure.
Why I picked Checkmk: As a network monitoring software, Checkmk offers real-time insights into network performance, identifying issues before they impact operations. It provides detailed network analytics, customizable dashboards, and an efficient alert system, making it easier for IT teams to manage network health and performance effectively without being overwhelmed by meaningless alerts.
Checkmk Standout Features & Integrations
Features include automatic discovery and configuration, which quickly identifies network components and sets up monitoring with minimal manual effort. Its highly scalable architecture supports everything from small networks to large, complex IT environments, making it versatile for various use cases. Its integration flexibility with multiple tools and systems also ensures seamless compatibility with existing workflows.
Integrations include Nagios, Grafana, Prometheus, LDAP/Active Directory, Jira, PagerDuty, DataDog, ntop, and Slack.
Pros and cons
Pros:
- Comprehensive monitoring capabilities
- Numerous automation options
- High configurability
Cons:
- Learning curve for new users
- Potential overhead for smaller networks

Atera is an all-in-one IT management platform that combines remote monitoring and management (RMM), help desk ticketing, patch management, and professional services automation. Its network monitoring features sit inside its broader IT operations platform, allowing you to monitor network devices while managing your full IT environment from a single interface.
Why I Picked Atera: I included Atera for its built-in Network Discovery tool, which uses Network Mapper (NMAP) technology to automatically scan your network, detect new devices, and update your network inventory. This gives you full visibility into connected hardware and helps you identify unauthorized or vulnerable devices before they become a problem. Atera’s real-time alerts notify you as soon as new devices appear or when known vulnerabilities are detected, so you can act early. It fits especially well for IT teams that want both monitoring and inventory management without adding extra standalone tools.
Atera Standout Features and Integrations:
Features includes vulnerability scanning that checks open ports and flags Common Vulnerabilities and Exposures (CVEs) tied to known security threats. You can also plan hardware refresh cycles and upgrades by tracking device status across your network. The platform supports scalable agent deployment for larger environments and includes a scan scheduler so you can control how often your network gets scanned.
Integrations include Microsoft Teams, Slack, ServiceNow, Okta, Azure Active Directory, Microsoft Outlook, WhatsApp Notifications, monday.com, Jira Software Cloud, Acronis Cyber Protect Cloud, Google Sheets, ChatGPT (OpenAI), Asana, Freshservice, Google Calendar.
Pros and cons
Pros:
- Centralized inventory for network assets
- Real-time CVE vulnerability scanning
- Auto-discovery of devices
Cons:
- Some features require separate add-ons
- Customization options may feel limited

PRTG by Paessler is a comprehensive IT infrastructure monitoring tool that offers solutions for small, medium, and large IT environments, as well as hosted monitoring for cloud and hybrid IT. It provides real-time monitoring and alerting for network devices, bandwidth usage, and other critical network metrics.
Why I picked PRTG: I like that PRTG allows users to visualize their entire IT infrastructure through custom maps and dashboards that provide real-time data and insights, enhancing network visibility and management. Additionally, its reporting features enable the generation of detailed, customizable reports tailored to specific needs. Combined with PRTG’s ease of use, comprehensive monitoring capabilities, and flexible alerting system, it provides a robust and user-friendly solution for network monitoring needs.
PRTG Standout Features and Integrations:
Features include customizable maps and dashboards, allowing users to create real-time visualizations of their entire IT infrastructure, making monitoring performance at a glance easy. Its sensor-based monitoring system is highly flexible, enabling users to track everything from bandwidth usage to server health and only pay for what they need. PRTG’s intuitive alerting system also ensures that users are notified of potential issues via email, SMS, or push notifications.
Integrations include Comet Backup, BackBox Automation Platform, BrightGauge, GitLab, BulkSMS.com, Google Analytics, Microsoft OneDrive, Dropbox, AlertOps, UVexplorer, AutoMonX, SMSEagle, and ThreatSync.
Pros and cons
Pros:
- Scalable for small and large networks
- Customizable monitoring and alerting
- User-friendly interface
Cons:
- More advanced features may come with a learning curve
- High cost for larger deployments

Site24x7 is an all-in-one monitoring solution designed for IT operations and DevOps teams, offering services like website, server, cloud, network, and application performance monitoring.
Why I picked Site24x7: I like its ability to monitor a wide range of network devices, including switches, routers, firewalls, and servers. This comprehensive device coverage means you can oversee your entire network infrastructure from a single platform, making it easier to identify and resolve issues across different hardware. Another benefit is Site24x7's network traffic analysis feature, which helps you understand bandwidth usage and identify potential bottlenecks.
Site24x7 Standout Features and Integrations:
Features include its AI-powered anomaly detection, which proactively identifies network performance issues before they escalate, reducing downtime and improving efficiency. Its cloud-based architecture allows remote monitoring without requiring on-premises infrastructure, making it an ideal choice for distributed teams. Site24x7’s integrated log management also provides real-time insights into system and application logs, helping IT teams troubleshoot and optimize performance more effectively.
Integrations include ServiceNow, PagerDuty, Jira, Microsoft Teams, Slack, Nagios, AWS, Azure, Google Cloud Platform, Docker, Jenkins, and Kubernetes.
Pros and cons
Pros:
- Comprehensive monitoring capabilities
- Real-time alerts and notifications
- Customizable dashboards and reports
Cons:
- Complexity in initial setup for large environments
- Limited customization in alerting mechanisms

Syncro is an integrated platform designed for Managed Service Providers (MSPs) and IT teams, combining Remote Monitoring and Management (RMM) with Professional Services Automation (PSA). It offers tools to monitor client networks, manage devices, and automate various IT tasks.
Why I picked Syncro: Syncro's RMM capabilities allow you to monitor unlimited endpoints, deploy patches, run scripts, and trigger automated remediations for hands-free issue resolution. This means you can keep an eye on all your clients' devices without worrying about hitting a limit. The platform's powerful scripting engine lets you access hundreds of ready-to-use scripts or create custom ones, enabling you to automate routine tasks and address issues swiftly. Additionally, Syncro's monitoring features include real-time alerts and customizable notifications. You can set specific thresholds for various performance metrics, such as CPU usage or memory utilization, and receive instant alerts when these thresholds are breached.
Syncro Standout Features and Integrations:
Features include its unified platform that combines RMM and PSA tools, enabling IT teams and MSPs to seamlessly manage devices while handling ticketing, invoicing, and customer communication in one place. Its automation capabilities, including custom scripting and workflow triggers, allow users to streamline repetitive tasks and resolve issues proactively. Additionally, Syncro’s flexible pay-per-technician pricing model makes it a cost-effective option for teams of all sizes, especially for small to mid-sized businesses or MSPs looking for scalability without breaking the bank.
Integrations include Worldpay, Stripe, PayPal, Acronis Cyber Protect, Bitdefender GravityZone, ConnectWise Importer, Dropbox, IT Glue, Google Calendar, Microsoft Outlook Calendar, Microsoft Teams, and Zapier.
Pros and cons
Pros:
- Unlimited endpoints without additional costs
- Powerful scripting capabilities for automation
- Comprehensive feature set that integrates RMM and PSA tools
Cons:
- Mobile app lacks some functionalities available in the desktop version
- Could offer more report customization options

Icinga is an open-source monitoring software specifically designed for complex IT environments. It provides comprehensive monitoring capabilities that cover infrastructure, servers, networks, and more, ensuring that your systems are always performing optimally.
Why I Picked Icinga: I chose Icinga because it supports plugin‑based monitoring of network services and devices—routers, switches, firewalls—letting you track latency, packet loss, and bandwidth. You can detect and alert on DNS or DHCP failures before users get affected, helping your team stay ahead of issues. Another highlight is its distributed monitoring architecture. The tool uses a clustered core with SSL‑secured zones, so you can scale across multiple data centers without losing visibility. That means your network stays monitored even if one node fails, ensuring consistent coverage.
Icinga Standout Features and Integrations:
Features include automatic certificate monitoring across your SSL devices, which includes alerting you before certificates expire. It also supports multi‑vendor plugin checks through Nagios‑compatible plugins, so you can write your own or use existing ones with ease. Plus, with its REST API and Icinga Director tool, you can automate host and service setups—such as importing from a CMDB—and apply configuration rules across your entire network.
Integrations include Grafana, AWS, Azure, Puppet, Ansible, Chef, Terraform, Jira, PagerDuty, ServiceNow, BigPanda, and Stackstorm.
Pros and cons
Pros:
- Highly customizable for various IT infrastructure needs
- Scalable for both small and large environments
- Free to use with no setup fees
Cons:
- Setup and configuration comes with a learning curve
- Occasional performance issues reported during high-load scenario
Dynatrace provides real-time visibility into your network, allowing you to monitor and analyze traffic patterns, latency, and performance metrics.
Why I picked Dynatrace: The reason I suggest Dynatrace for complex environments is it enables smooth performance for all types of network connections, like virtualized clouds and data centers, by installing agents on each host. This lets you gain insight into which processes need troubleshooting. For each process, it can track network bandwidth and connection issues.
Dynatrace Standout Features and Integrations:
Features include its AI-driven observability, automatically detecting anomalies and pinpointing root causes in real-time, and reducing the need for manual troubleshooting. Its full-stack monitoring extends across hybrid and multi-cloud environments, ensuring visibility into network performance, application dependencies, and infrastructure health. Additionally, Dynatrace’s automatic dependency mapping provides a real-time topology of all network connections, making diagnosing and resolving performance bottlenecks easier.
Integrations include Active Directory, Adobe Analytics, Akka, Amazon DynamoDB, Ansible Tower, Azure Virtual Machines, Google Analytics, Gremlin, LaunchDarkly, and Zenduty.
Pros and cons
Pros:
- Alerting and notification for network outages
- Capacity planning and forecasting for network resources
- Can analyze network latency and packet loss
Cons:
- Pricing structure is complex
- No free plan
Other Network Monitoring Software Options
Here are some extra options you can pick from. Even though they did not make it to the best 12 list, they are still worth considering:
- LogicMonitor
For cloud-based network monitoring
- Netdata
For real-time infrastructure monitoring
- WhatsUp Gold
For comprehensive network monitoring
- New Relic
For advanced and power users
- Datadog
For small businesses
- Zabbix
Range of features
- OPSWAT Security Score
For Windows security scans
- Nagios XI
For enterprises
- Prometheus
Free network monitoring tool
- Wireshark
For packet analysis
- Google Cloud
For real-time network performance metrics
- Munin Monitoring
Free option
- Zenoss
For hybrid IT infrastructure monitoring
- NinjaOne
For endpoint management and patch compliance
- ManageEngine Applications Manager
For application monitoring
- NetCrunch
For hybrid IT infrastructure monitoring
- Cacti
For network data graphs
- Ntop
For traffic analysis
- IBM QRadar
For security information and event management
- Cisco Meraki
For security


Related Network Monitoring Software
If you still haven't found what you're looking for here, check out these other types of tools that we've tested and evaluated.
- Network Monitoring Software
- Server Monitoring Software
- SD-Wan Solutions
- Infrastructure Monitoring Tools
- Packet Sniffer
- Application Monitoring Tools
Selection Criteria for Network Monitoring Software
My tool selection criteria consider the benefits of network monitoring solutions for users, including core functionalities that include user experience and support. Through firsthand trials and extensive research, the following criteria guide my recommendations.
Core Functionality: 25% of total weighting score
To be considered for inclusion on my list of the best network monitoring solutions, a product must support common use cases:
- Continuous network performance monitoring
- Follows networking monitoring best practices
- Automated alerting for system anomalies
- Traffic analysis for identifying usage patterns and potential threats
- Log management for security and compliance auditing
- Real-time and historical data reporting for trend analysis
Additional Standout Features: 25% of total weighting score
- Unique capabilities set a product apart from competitors, such as advanced AI-driven anomaly detection or predictive analytics for forecasting potential network issues.
- Examples include solutions offering detailed network topology visualization tools or integrated threat intelligence for enhanced security posture.
- We test for innovative functionalities that elevate a product beyond basic monitoring tasks, focusing on how these features can be applied to real-world scenarios.
Usability: 10% of total weighting score
- An intuitive interface that balances complexity with ease of use, catering to both novice users and experienced IT professionals.
- Network monitoring solutions should feature a dashboard that provides at-a-glance insights and easy navigation to detailed data views.
- The design aesthetic should facilitate quick understanding and action on data presented, with customizable views to suit different user preferences.
Onboarding: 10% of total weighting score
- Quick and straightforward setup processes allow teams to deploy and utilize the product without extensive downtime.
- Resources like training videos, interactive product tours, and step-by-step guides enable users to grasp the product's functionality rapidly.
- Support for migration from previous tools, with clear guidance on integrating the new solution into existing workflows.
Customer Support: 10% of total weighting score
- Responsive and knowledgeable support teams capable of addressing issues promptly.
- Various support channels, including live chat, email, and phone, ensure accessibility for users with different preferences.
- Provision of a comprehensive knowledge base or FAQ section for self-service troubleshooting.
Value For Money: 10% of total weighting score
- Pricing models that align with the features and benefits offered ensure organizations receive a fair return on their investment.
- Transparent network monitoring software costs, with options for scalability as the organization's needs grow.
- Consideration of long-term costs, including updates and support, in assessing overall value.
Customer Reviews: 10% of total weighting score
- Positive feedback from current and past users, focusing on reliability, efficiency, and customer satisfaction.
- Analysis of reviews to identify common trends and potential issues that might not be apparent from product specifications alone.
- Attention to how current users rate the product's impact on solving network monitoring challenges.
How to Choose a Network Monitoring Software
While many feature-rich enterprise solutions are available, they can have hefty price tags. This guide will show you how to find inexpensive options that still provide the essential monitoring functionality you need.
As you're shortlisting, trialing, and selecting network monitoring software, consider the following:
- What problem are you trying to solve - Start by identifying the network monitoring feature gap you're trying to fill to clarify the features and functionality the tool needs to provide. Network monitoring tools can save you time and money.
- Who will need to use it – To evaluate cost and requirements, consider who will use the platform and how many licenses you'll need. You'll need to assess whether or not the IT team or the whole organization will require access. When that's clear, it's worth considering whether you prioritize ease of use for all or speed for your technical power users.
- What other tools it needs to work with - Clarify what tools you're replacing, which are staying, and the tools you'll need to integrate with. This could include your existing network infrastructure, various data sources, and your overall tech stack. You might also need to decide if the tools will need to integrate or if you can replace multiple tools with one consolidated network monitoring software.
- What outcomes are important - Consider the result the tool needs to deliver to succeed. Think about what capability you want to gain or what you want to improve and how you will be measuring success. You could compare network monitoring software features until you’re blue in the face, but you could be wasting a lot of valuable time if you aren’t thinking about the outcomes you want to drive.
- How it would work within your organization – Consider the solutions alongside your workflows and existing infrastructure. Evaluate what's working well and the areas causing issues that must be addressed. Remember that every business is different—don’t assume that because a tool is popular, it'll work in your organization.
Trends in Network Monitoring Software
By reviewing the latest product updates, press releases, and release logs from leading tools, we can discern clear trends that indicate the direction of network monitoring technology.
Here are the trends I'm tracking this year:
Emerging Trends in Network Monitoring Software
- Integration of AI and Machine Learning: There's a strong trend toward incorporating artificial intelligence (AI) and machine learning (ML) algorithms to enhance anomaly detection and predictive analytics. These technologies allow for more proactive network management by predicting potential issues before they cause disruptions, reflecting a shift towards preventive strategies in network maintenance.
- Enhanced Automation for Response and Remediation: Automation capabilities are evolving rapidly, with tools now offering more sophisticated automated response and remediation actions. This evolution indicates a move towards minimizing manual intervention and speeding up resolution times for detected network issues.
- Cloud-native and SaaS Solutions: The rise of cloud-native and Software-as-a-service (SaaS) network monitoring solutions reflects a growing demand for scalability, flexibility, and ease of deployment. This trend caters to organizations increasingly adopting cloud infrastructure, requiring tools that seamlessly monitor both on-premises and cloud environments.
- Advanced Security Features: As network security becomes paramount, monitoring tools integrate advanced security features like threat intelligence and encrypted traffic analysis. This development suggests understanding how to measure network performance and security monitoring and aims to provide a holistic view of the network's health and threat landscape.
Features Becoming Less Important
- Traditional SNMP-Based Monitoring: The reliance on Simple Network Management Protocol (SNMP) for device monitoring is diminishing in favor of more comprehensive and dynamic monitoring methods. This shift is driven by the need to monitor increasingly complex and distributed network architectures that SNMP alone cannot fully address.
- Manual Configuration and Setup Processes: As automation and AI-driven configurations become more prevalent, the emphasis on manual setup and configuration processes is decreasing. This change reflects market demand for more plug-and-play solutions that can adapt to a network's needs with minimal manual oversight.
- Periodic Reporting Over Real-Time Insights: The importance of periodic reports is waning in favor of real-time data and alerts. In an era where network conditions can change rapidly, immediate information to facilitate swift decision-making is more critical than ever.
These trends underline a broader shift towards more intelligent, automated, and flexible network monitoring solutions capable of adapting to the demands of modern networks and the best practices for monitoring them.
What is Network Monitoring Software?
Network monitoring software is a tool that tracks the performance, availability, and health of a network. It's used by IT administrators, network engineers, and support teams to catch problems early and keep systems running smoothly. Features like real-time alerts, traffic analysis, and device status checks help with spotting outages, finding slowdowns, and understanding where issues start. These tools help teams stay on top of their network without guessing what’s going wrong.
Features of Network Monitoring Software
When I research and review network monitoring software to include in my list, these are the top features I look for:
- Real-time Monitoring: This feature provides immediate visibility into network performance and health. It's essential for detecting anomalies as they occur, allowing for swift response to potential threats.
- Automated Alerts: Sends notifications based on predefined criteria or anomalies. This ensures you are immediately informed of suspicious activities, enabling quick action to mitigate threats.
- Traffic Analysis: Offers detailed insights into the data flowing through your network. Understanding traffic patterns helps identify unusual behavior that may indicate a security issue.
- Comprehensive Log Management: Centralizes and simplifies network logs' collection, storage, and analysis. Root cause analysis tools can help identify the root cause of security incidents.
- Vulnerability Scanning: Regularly scans your network for vulnerabilities. Keeping abreast of vulnerabilities allows you to patch them before attackers can exploit them.
- Performance Benchmarking: Establishes performance baselines for network operations. This feature helps identify deviations from the norm, which could signify an underlying security problem.
- Configuration Management: Tracks any changes to network device configurations. This ensures that any unauthorized changes, potentially opening up security vulnerabilities, are quickly detected and addressed.
- Bandwidth Monitoring: Monitors the use of network bandwidth. Knowing how to measure network bandwidth usage is essential. Sudden spikes in bandwidth usage can indicate a security breach, such as a DDoS attack or unauthorized data exfiltration.
- Network Mapping: Automatically generates a visual map of your network's devices and connections. This aids in identifying unauthorized devices on your network and potential vulnerabilities.
- Encryption Monitoring: Ensures that data in transit across your network is properly encrypted. Monitoring encryption helps protect against data interception and ensures compliance with security policies.
Benefits of Network Monitoring Software
Here are five primary advantages of deploying network monitoring software:
- Enhanced Network Performance: Network traffic monitoring helps identify and rectify issues before they escalate, ensuring smooth and efficient network operations.
- Reduced Downtime: Reducing network monitoring downtime involves being proactive. Detection and alerting mechanisms allow for quick issue resolution and minimize the impact of downtime on business operations.
- Improved Security Posture: Network monitoring software provides visibility into network traffic and can identify suspicious activities, enhancing the network's security against potential threats.
- Cost Savings: By reducing downtime and optimizing network performance, organizations can avoid the high costs associated with network failures and inefficient bandwidth usage.
- Compliance and Reporting: The ability to log network activities and generate detailed reports aids in compliance with regulatory standards and provides valuable insights for strategic planning.
Network monitoring tools save time and money and contribute significantly to an organization's strategic goals.
Costs & Pricing for Network Monitoring Software
Choosing the right network monitoring software can seem daunting, especially for those with little experience in the field. Various plans and pricing options are designed to cater to different sizes and types of businesses, from small startups to large enterprises.
Understanding the cost of network monitoring and what the standard plans typically include can help you make an informed decision that aligns with your organization's budget.
Plan Comparison Table for Network Monitoring Software
Below, I outline the various plan options along with their average pricing and standard features to help you make an informed decision.
| Plan Type | Average Price | Common Features | Best For |
|---|---|---|---|
| Free | $0 | Basic monitoring capabilities, limited number of devices or sensors, community support | Small businesses with simple networks or startups looking for basic monitoring functionality. Ideal for users with limited budgets or small networks that don't require advanced features. |
| Basic | $1,500 - $3,000/year | Enhanced monitoring features, support for more devices, email support, basic reporting capabilities | Small and medium businesses with growing networks seeking improved monitoring capabilities and some level of support |
| Professional | $3,500 - $7,000/year | Full monitoring suite, scalability options, advanced reporting, priority support | Medium to large businesses with complex networks requiring comprehensive monitoring, advanced reporting, and priority support for critical operations |
| Enterprise | $10,000+/year | Customizable features, unlimited devices, dedicated support, comprehensive security analysis | Large enterprises with highly complex networks demanding in-depth customization, unlimited scalability, dedicated support, and advanced security features |
Remember that investing in a plan that scales with your organization can provide long-term benefits, ensuring your network remains solid and secure as your business grows.
Network Monitoring Software Frequently Asked Questions
You can find answers to common questions about network monitoring and network monitoring tools.
Why is network monitoring software important?
How does network monitoring software work?
Which type of networks does network monitoring software monitor?
Why is supporting SDN and virtualized environments important in network monitoring software?
What are the specific network monitoring software challenges of monitoring hypervisor environments?
When it comes to network monitoring software, what are the benefits and downsides of using virtual machines vs physical servers?
How do monitoring requirements differ between on-premises and cloud-based networks?
What security features should network monitoring software include?
How often should network monitoring software be updated?
What scalability factors should be considered when selecting network monitoring software?
What's Next?
With network monitoring, you can detect potential security threats, identify inefficiency, and optimize resource allocation.
Investing in network monitoring software can ensure your networks' health and proactively address issues before they become outages.
Subscribe to The CTO Club newsletter to receive more valuable tips, strategies, and articles from the world of technology.