

10 Best Infrastructure Monitoring Tools Reviewed in 2026

Best Infrastructure Monitoring Tools Shortlist


The best infrastructure monitoring tools help teams detect system issues early, maintain uptime, and keep applications and services running reliably across complex environments. These tools give organizations real-time visibility into servers, networks, and cloud resources so they can catch performance drops and fix problems before users are impacted.
When misconfigurations cause outages, when manual checks slow response times, or when gaps in monitoring leave critical systems unseen, performance and efficiency can decline quickly. These problems create delays in troubleshooting, increase risk during peak loads, and make it harder for engineering and operations teams to understand what is happening across their infrastructure.
With over 20 years in the industry as a Chief Technology Officer, I’ve tested and reviewed dozens of infrastructure monitoring tools across real-world environments to evaluate their accuracy, integrations, and usability. This guide highlights the top infrastructure monitoring tools that improve visibility, enhance performance management, and help teams maintain dependable systems. Each review covers features, pros and cons, and best-fit use cases to help you choose the right tool.
Why Trust Our Software Recommendations
Our team has been testing and reviewing software since 2012. As tech leaders ourselves, we know how difficult—and important—it is to choose the right software.
For this guide, we evaluated tools using hands-on testing and independent research, scoring tools using our selection criteria.
Our reviews reflect our human editorial judgment, not a sales pitch.
Expert reviewers:
Best Infrastructure Monitoring Tools Summary
This comparison chart summarizes pricing details for my top infrastructure monitoring tools selections to help you find the best one for your budget and business needs.
| Tool | Best For | Trial Info | Price | ||
|---|---|---|---|---|---|
| 1 | Best for customizable dashboard visualizations | 30-day free trial + free plan available | From $200/month (billed annually) | Website | |
| 2 | Best for open-source infrastructure monitoring | Free plan available | Pricing upon request | Website | |
| 3 | Best for comprehensive IT operations | Free demo available | Pricing upon request | Website | |
| 4 | Best for website performance checks | 30-day free trial + free demo available | From $10/month (billed annually) | Website | |
| 5 | Best for cloud-native applications | Free plan + free demo available | Pricing upon request | Website | |
| 6 | Best for end-to-end visibility | 30-day free trial | From $125/month | Website | |
| 7 | Best for virtual machine management | 90-day free trial available | Pricing upon request | Website | |
| 8 | Best for hybrid cloud monitoring | 30-day free trial available | From $7/node/month | Website | |
| 9 | Best for malware protection | Free trial available | From $49.99/user/year | Website | |
| 10 | Best for cloud infrastructure monitoring | 14-day free trial + free demo | From $22/month | Website |
Best Infrastructure Monitoring Tool Reviews
Below are my detailed summaries of the best infrastructure monitoring tools that made it onto my shortlist. My reviews offer a detailed look at the key features, pros & cons, integrations, and ideal use cases of each tool to help you find the best one for you.
Best for customizable dashboard visualizations
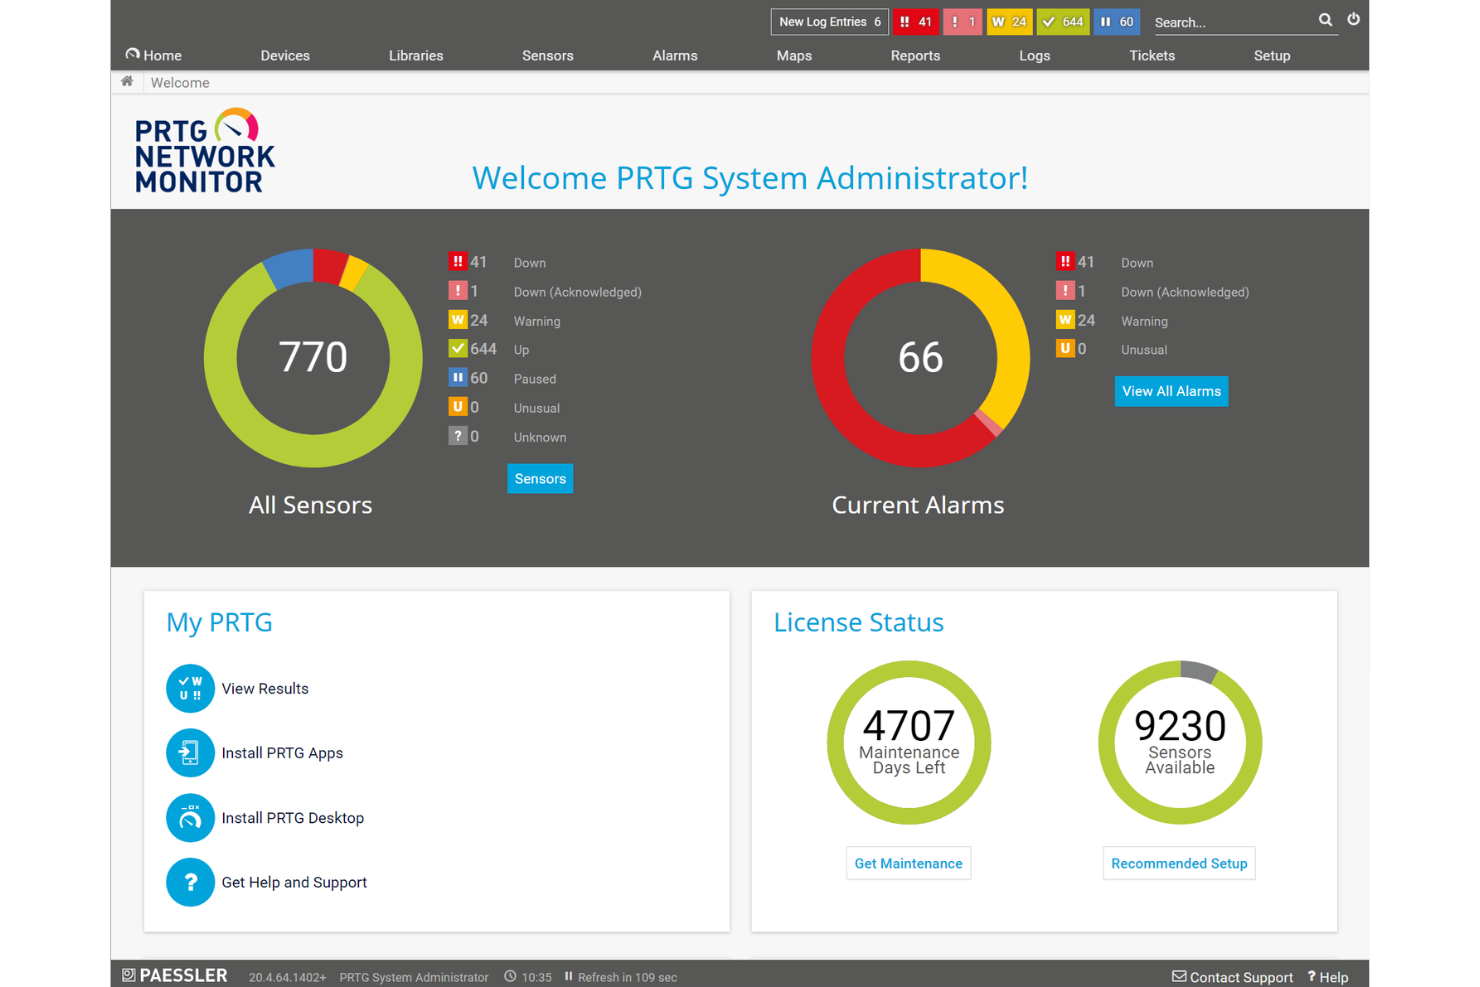
Paessler PRTG is an infrastructure monitoring platform that tracks network devices, servers, applications, and cloud services using a sensor-based architecture with support for SNMP, NetFlow, WMI, REST, and other protocols across on-premises and hybrid environments.
Who Is Paessler PRTG Best For?
PRTG is a strong fit for IT operations and NOC teams in mid-sized organizations managing complex, mixed-device environments across on-premises and hybrid infrastructure.
Why I Picked Paessler PRTG
I picked Paessler PRTG as one of the best because its Map Designer lets me build real-time network maps from scratch, pulling live status data from any monitored device into a single, fully custom view. I also like how PRTG MultiBoard consolidates dashboards across multiple PRTG servers into one display. In practice, that means my NOC team gets a true single-pane-of-glass view across every site without toggling between instances.
Paessler PRTG Key Features
- Sensor-based data collection: Choose from 250+ sensor types to monitor devices, bandwidth, applications, cloud services, and more.
- Auto-discovery wizard: Automatically finds and maps network devices for quick setup.
- APIs and custom sensor framework: Extend monitoring by building custom sensors or integrating with external systems.
- Distributed monitoring with remote probes: Monitor remote sites or branch offices using lightweight agents without extra PRTG servers.
Paessler PRTG Integrations
Paessler PRTG offers native integrations with AWS, Microsoft Azure, Google Cloud Platform, Cisco, VMware vSphere, ServiceNow, and Splunk. An API is available for custom integrations.
Pros and Cons
Pros:
- Strong SNMP, NetFlow, and WMI support
- Real-time network topology mapping built-in
- 250+ sensors cover diverse infrastructure environments
Cons:
- Limited Kubernetes and container monitoring depth
- Per-sensor pricing gets expensive at scale
New Product Updates from Paessler PRTG
Paessler PRTG Improves Route Monitoring and Auto-Discovery
Paessler PRTG adds route-change alerts, faster traceroute processing, updated auto-discovery defaults, and a Proxmox template. This improves network monitoring and setup. For more information, visit Paessler’s official site.
 .
.
Icinga
Best for open-source infrastructure monitoring
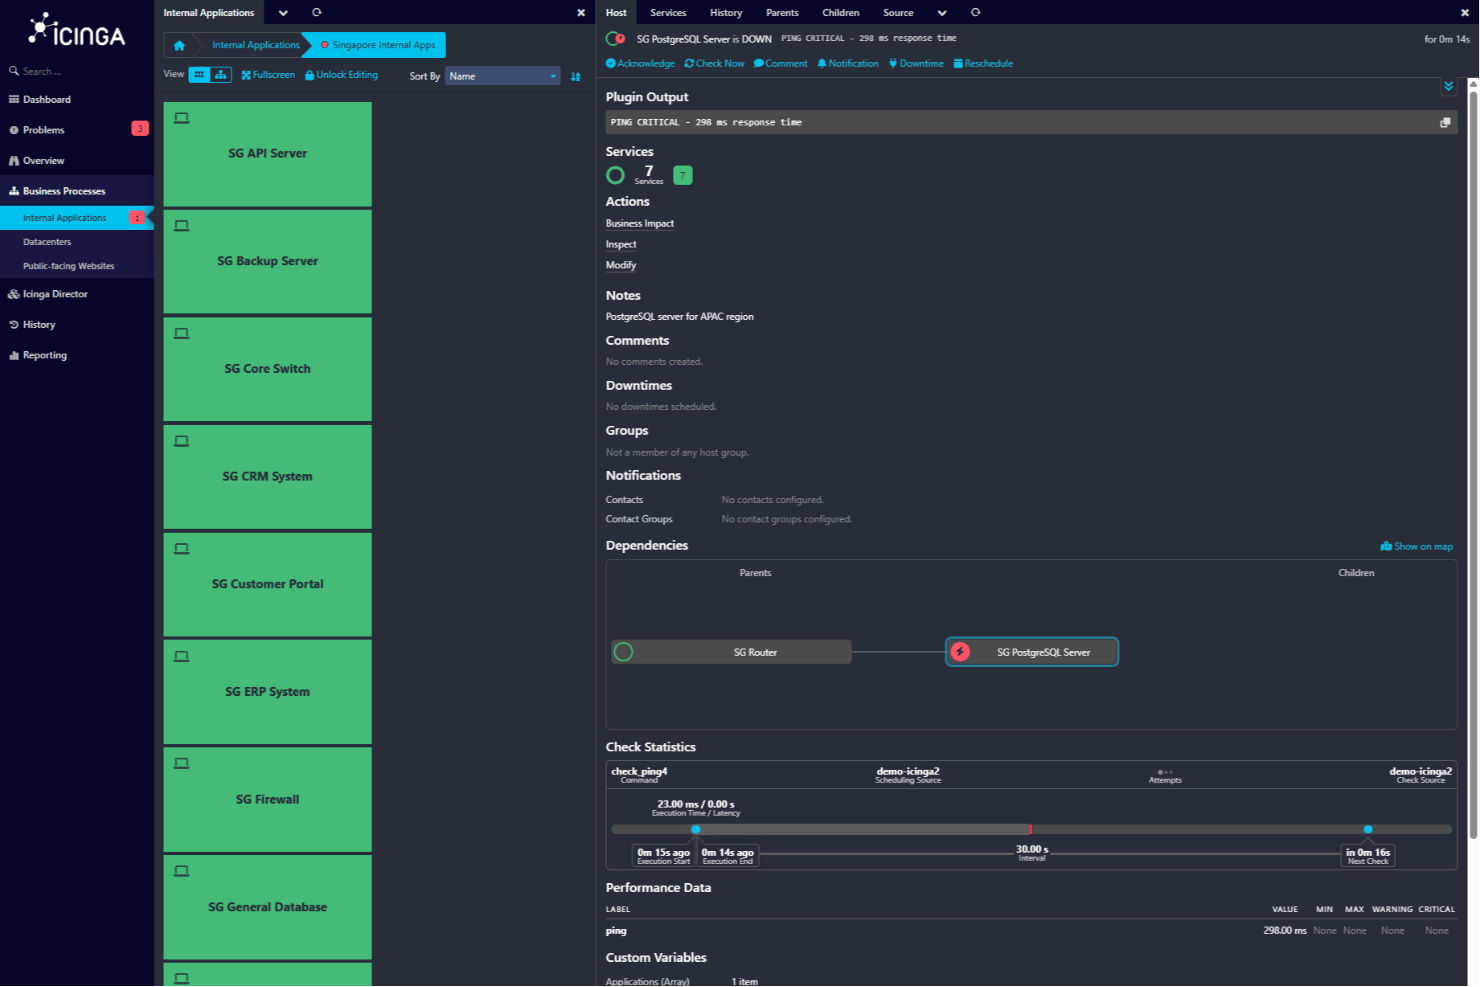
For teams seeking a reliable infrastructure monitoring tool, Icinga offers a comprehensive solution tailored to complex IT environments. Its open-source architecture supports flexible monitoring across servers, networks, and applications, making it suitable for teams managing complex IT setups. Whether you're in telecom, finance, or technology sectors, Icinga helps you monitor systems while integrating with existing IT service workflows so you can identify and resolve issues quickly and minimize disruptions in your operations.
Why I Picked Icinga
I picked Icinga for its open-source infrastructure monitoring, which gives teams the flexibility to monitor servers, networks, and applications across complex IT environments. Its monitoring automation helps your team handle large volumes of data without constant manual work, while the alert notification system keeps you informed of issues as they arise so you can respond quickly. I also appreciate its analytics features, which provide insights into system performance and support more proactive IT management.
Why I Picked Icinga
Aside from open-source infrastructure monitoring, Icinga offers:
- Cloud Monitoring: This feature allows you to monitor various cloud environments, ensuring that your cloud-based operations run smoothly.
- Kubernetes Monitoring: Icinga supports monitoring of Kubernetes clusters, providing insights into the performance and health of containerized applications.
- Database Monitoring: Keep an eye on database performance and availability to ensure your data-driven applications are always up and running.
- Security Monitoring: This feature alerts you to unusual activities and supports vulnerability scanning, helping to protect your IT infrastructure.
Icinga Integrations
Integrations include Grafana, Puppet, Ansible, Chef, AWS, Azure, ServiceNow, SIGNL4, ilert, and AlertOps.
Pros and Cons
Pros:
- Highly customizable and scalable for enterprise needs
- Supports a wide range of integrations with IT services
- Provides real-time visibility into complex IT infrastructures
Cons:
- Heavy reliance on configuration files compared to SaaS tools
- Lack of a user-friendly interface for non-technical users
New Product Updates from Icinga

Icinga Adds TOTP Two-Factor Authentication to Icinga Web
Icinga added time-based one-time password (TOTP) two-factor authentication to Icinga Web, helping organizations strengthen login security with an additional verification step. For more information, visit Icinga’s official site.
 .
.
Best for comprehensive IT operations
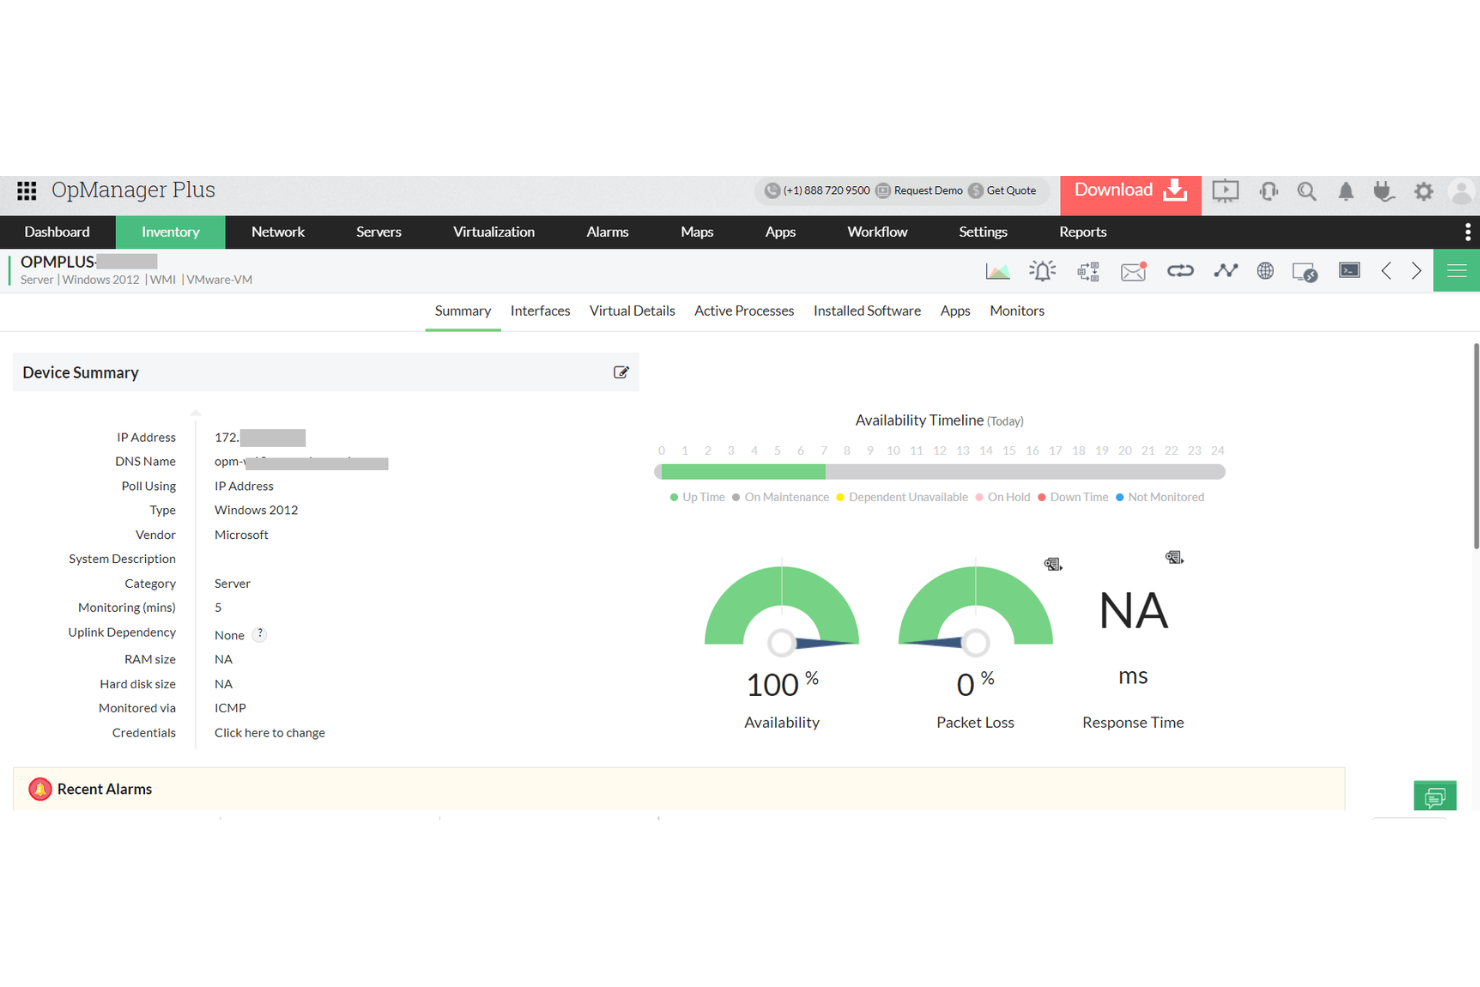
ManageEngine OPM Plus is an IT infrastructure monitoring tool designed for IT administrators and managers. It helps monitor and manage IT assets, focusing on Active Directory management and security information management.
Why I picked ManageEngine OPM Plus: This tool offers in-depth monitoring capabilities for both physical and virtual infrastructures. Its standout feature is its comprehensive IT operations management, which includes real-time change monitoring and bandwidth management. You can also benefit from its robust security features that help protect against cyber threats. Its user-friendly interface makes it accessible, though it might require some training for new users.
Standout features & integrations:
Features include real-time change monitoring, which keeps you updated on any alterations made to your infrastructure, and in-depth log and IP address monitoring, helping you track performance issues. Multi-channel notifications ensure you never miss a critical alert, providing peace of mind for your team.
Integrations include ServiceNow, Jira, Slack, Microsoft Teams, PagerDuty, Splunk, Zapier, Zoho Analytics, ManageEngine Analytics Plus, and ManageEngine ServiceDesk Plus.
Pros and Cons
Pros:
- Multi-channel notifications
- User-friendly interface
- Comprehensive monitoring capabilities
Cons:
- Requires adequate training
- Complexity for new users

Site24x7
Best for website performance checks
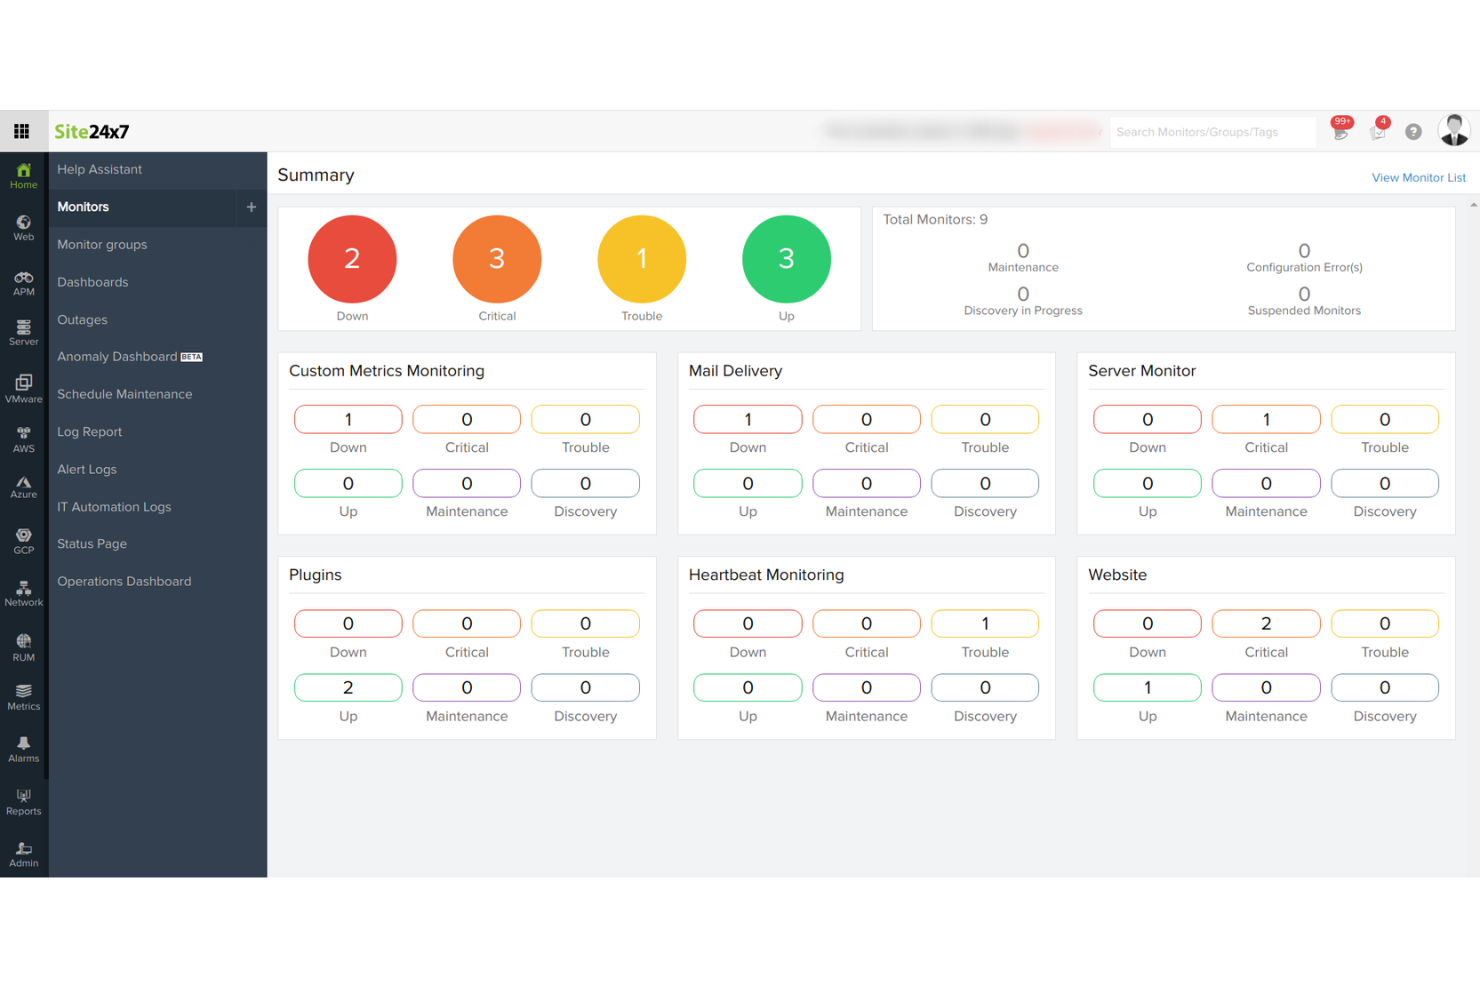
Site24x7 is a cloud-based infrastructure monitoring tool designed for IT and DevOps teams. It focuses on monitoring website performance and user experience, providing insights that help improve system availability.
Why I picked Site24x7: It offers detailed website performance monitoring, which is key for maintaining high uptime and user satisfaction. Real user monitoring lets you see exactly how visitors interact with your site. Its application performance monitoring provides a deeper look into your app's health and performance. This tool is ideal for teams needing to ensure their web services are always optimized.
Standout features & integrations:
Features include server monitoring to keep tabs on your server health and status. Network monitoring helps you track network performance and troubleshoot issues quickly. Synthetic monitoring allows your team to simulate user interactions and test website performance from different locations.
Integrations include Slack, Microsoft Teams, PagerDuty, Zapier, Jira, ServiceNow, Trello, HipChat, Opsgenie, and Zoho Desk.
Pros and Cons
Pros:
- Application performance insights
- Real user monitoring available
- Detailed website performance metrics
Cons:
- May require additional training
- Can be complex to set up
New Product Updates from Site24x7
Site24x7 Adds Compliance Reports and Domain Squatting Detection
Site24x7’s Digital Risk Analyzer now offers domain compliance assessment and squatting detection to help you validate security posture, compare domains, and spot impersonation risks faster. For more information, visit Site24x7’s official site.
 .
.
Best for cloud-native applications

New Relic is a cloud-based infrastructure monitoring tool tailored for developers and IT operations teams. It focuses on monitoring and analyzing application performance to enhance digital customer experiences.
Why I picked New Relic: Its focus on cloud-native applications makes it a top choice for teams working in modern environments. The tool's application performance monitoring offers detailed insights into your app's health. Real-time analytics help you make data-driven decisions quickly. Its scalability supports your team's growth without compromising on performance.
Standout features & integrations:
Features include real-time user monitoring, which provides insights into user interactions with your applications. Custom dashboards allow you to visualize data in a way that suits your team's needs. Error tracking helps you quickly identify and address issues.
Integrations include AWS, Microsoft Azure, Google Cloud Platform, Kubernetes, Docker, Slack, PagerDuty, Jira, ServiceNow, and Splunk.
Pros and Cons
Pros:
- Customizable dashboards
- Suitable for cloud-native environments
- Real-time user monitoring
Cons:
- May need additional training
- Some features can be overwhelming

Best for end-to-end visibility

eG Enterprise is an IT infrastructure monitoring tool designed for IT teams and system administrators. It focuses on providing end-to-end visibility across physical, virtual, and cloud environments, enhancing system performance and reliability.
Why I picked eG Enterprise: Its end-to-end visibility means you get a complete picture of your IT infrastructure. The tool's automatic root cause diagnosis helps you identify and fix issues quickly. With its detailed performance metrics, you can monitor everything from applications to network devices. This comprehensive approach ensures nothing is overlooked, making it ideal for complex IT environments.
Standout features & integrations:
Features include detailed performance metrics that cover a wide range of IT assets, helping you maintain optimal system performance. The tool offers automatic root cause diagnosis to quickly pinpoint and resolve issues. Its customizable dashboards allow you to visualize data in a way that suits your team's needs.
Integrations include ServiceNow, Microsoft SCOM, VMware vSphere, Citrix, Oracle, SAP, Microsoft Exchange, Microsoft Active Directory, Amazon Web Services, and Microsoft Azure.
Pros and Cons
Pros:
- Customizable dashboards
- Comprehensive end-to-end visibility
- Automatic root cause analysis
Cons:
- Limited customization in some areas
- Requires ongoing maintenance and updates


vSphere is a virtualization platform designed for IT administrators and system architects. It focuses on virtual machine management, providing the infrastructure needed to run applications efficiently in virtual environments.
Why I picked vSphere: Its virtual machine management capabilities are key for optimizing resources and enhancing system performance. The tool's live migration feature allows you to move VMs without downtime. With its automated load balancing, your team can ensure optimal resource allocation. Additionally, data protection features help safeguard your virtual environment against potential threats.
Standout features & integrations:
Features include live migration, which allows for seamless VM relocation without downtime. Automated load balancing helps distribute workloads efficiently across resources. Data protection features ensure the safety and integrity of your virtual environments.
Integrations include VMware vSAN, VMware NSX, VMware Cloud Foundation, VMware Site Recovery Manager, Dell EMC VxRail, HPE SimpliVity, IBM Cloud, AWS, Microsoft Azure, and Google Cloud Platform.
Pros and Cons
Pros:
- Automated load balancing
- Efficient virtual machine management
- Live migration without downtime
Cons:
- Limited customization options
- Frequent updates needed for optimal performance

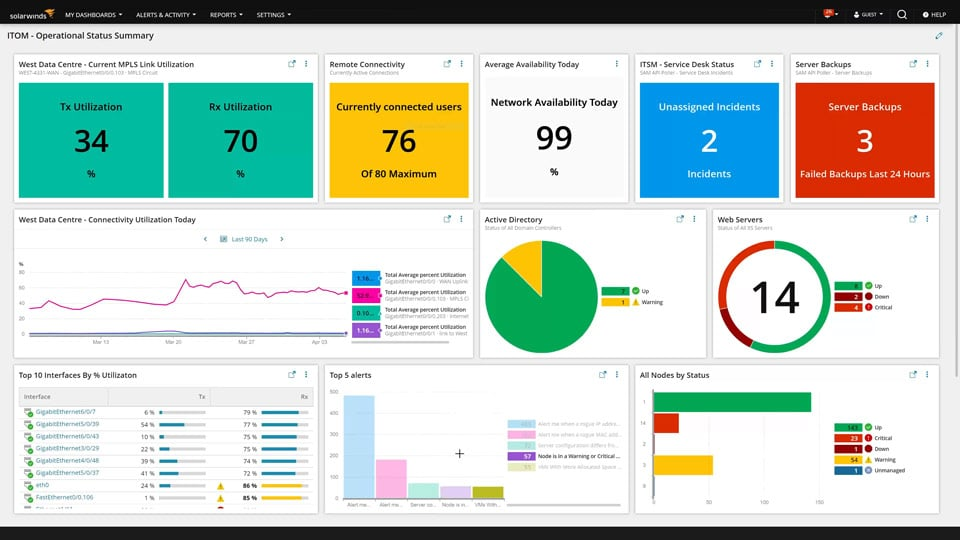
SolarWinds Observability SaaS is an infrastructure monitoring platform for IT teams managing complex environments. It provides unified visibility across cloud-native, on-premises, and hybrid systems to support monitoring and troubleshooting. By eliminating tool sprawl and reducing alert fatigue, it ensures optimal service levels and user satisfaction, making it an invaluable asset for businesses striving to maintain high-performance standards in their IT operations.
Why I Picked SolarWinds Observability SaaS
I chose SolarWinds Observability SaaS for its ability to deliver a unified view across multi-cloud, hybrid, and on-premises environments. The tool's hybrid network and cloud infrastructure monitoring capabilities are particularly beneficial, as they encompass both traditional network devices and modern cloud services. Its integration of AIOps with machine learning to prioritize and surface real problems helps your team focus on resolving critical issues faster. These features collectively provide a reliable framework for teams aiming to enhance their infrastructure monitoring strategies.
SolarWinds Observability SaaS Key Features
In addition to its core functionalities, I also found other features that enhance its utility:
- Hybrid Application Performance Monitoring: This feature provides unified code-level troubleshooting with transaction tracing and code-profiling, combined with user experience insights.
- Open-Source Database Performance Monitoring: Offers full visibility into open-source databases like MySQL, PostgreSQL, and MongoDB, aiding in system performance optimization.
- Data Center Location Flexibility: Allows the choice of data center regions, supporting local compliance and optimizing load distribution for better performance.
- Real User Monitoring (RUM): Provides insights into actual user experiences, enabling businesses to detect and resolve user-facing issues effectively.
SolarWinds Observability SaaS Integrations
Integrations include AWS, Azure, Google Cloud, Kubernetes, Docker, MySQL, PostgreSQL, MongoDB, Redis, and SNMP-enabled devices.
Pros and Cons
Pros:
- Effective for managing both legacy and cloud infrastructures
- Savings through reduced downtime
- Enhanced anomaly detection and smart alert features
Cons:
- Configuration can be complex
- Costs increase as more infrastructure are added


Malwarebytes for Business is a cybersecurity solution designed for businesses of all sizes. It focuses on malware protection, providing real-time threat detection and removal to secure your systems.
Why I picked Malwarebytes for Business: Its primary focus on malware protection ensures your systems remain safe from various threats. The tool offers real-time threat detection to catch and remove malware swiftly. With its layered protection, you can safeguard your network from ransomware, spyware, and other malicious attacks. This makes it a valuable asset for businesses seeking to enhance their cybersecurity posture.
Standout features & integrations:
Features include real-time threat detection that helps you identify and neutralize malware quickly. Layered protection provides an extra shield against ransomware and other cyber threats. The tool's centralized management console allows you to oversee and control security measures across your network.
Integrations include Splunk, ConnectWise Automate, SolarWinds N-central, Atera, AWS, Microsoft Azure, VMware, Cisco Umbrella, Ivanti, and ServiceNow.
Pros and Cons
Pros:
- Layered protection against threats
- Focused malware protection
- Real-time threat detection
Cons:
- May require technical knowledge
- Initial setup can be complex


Logic Monitor is a cloud-based infrastructure monitoring tool aimed at IT and DevOps teams. It helps monitor cloud infrastructure, providing insights into performance, availability, and resource usage.
Why I picked Logic Monitor: Its focus on cloud infrastructure monitoring makes it ideal for teams working in dynamic environments. The tool offers detailed performance metrics, helping you keep track of your infrastructure's health. With its automated alerts, you can respond to issues quickly. Its scalability supports your team's growth, making it a reliable choice for expanding operations.
Standout features & integrations:
Features include automated alerts that notify you of potential issues, allowing for quick resolution. The tool's custom dashboards let you visualize data in a way that suits your team's needs. Detailed performance metrics provide insights into the health and efficiency of your infrastructure.
Integrations include AWS, Microsoft Azure, Google Cloud Platform, VMware, Docker, Kubernetes, ServiceNow, Slack, PagerDuty, and Jira.
Pros and Cons
Pros:
- Automated alerts for quick response
- Effective cloud infrastructure monitoring
- Detailed performance metrics
Cons:
- Requires technical expertise
- May have a steep learning curve
Other Infrastructure Monitoring Tools
Here are some additional infrastructure monitoring tools options that didn’t make it onto my shortlist, but are still worth checking out:
- NMIS
For open-source flexibility
- Dynatrace
For AI-powered automation
- Datadog
For real-time data analytics
- Dotcom Monitor
For real-user journey simulations
- Pulseway
For mobile IT management
- Splunk Enterprise
For data-driven insights
- PagerDuty
For incident response coordination
- PingPlotter
For network troubleshooting
- NinjaOne
For IT management automation
- Opsgenie
For alerting and on-call management
- WhatsUp Gold
For network visibility and mapping
- Germain UX
For user experience analytics
- Domotz
For remote network monitoring
- ConnectWise Automate
For remote monitoring and management
- Kaseya VSA
For unified remote monitoring and management
- PRTG Network Monitor
For detailed network monitoring
- Atera
For all-in-one RMM solution
- Pandora FMS
For flexible monitoring solutions
- Syncro
For small MSPs and IT teams
- OpManager Plus
For integrated IT operations


How I Evaluate Infrastructure Monitoring Tools
When an on-call site reliability engineer needs to diagnose a Kubernetes pod crash at 2 a.m., the tools I evaluate must first clear a baseline of core monitoring capabilities before I consider what sets them apart.
Core Functionality (Table Stakes For This List)
When I'm selecting tools for my list, I rank each one on a scale from 0 (does not offer the functionality) to 5 (excels in this area) for each core functionality listed below. Then, I calculate the tool's total score into a percentage. Each tool needs to achieve a minimum total score of 75% to be considered for inclusion.
- Metrics Collection & Visualization: I evaluate whether a tool can ingest CPU, memory, disk, and network metrics and surface them in dashboards you can actually customize to match your team's workflows.
- Multi-Environment Coverage: Whether your stack spans bare-metal servers, AWS, Azure, GCP, or Kubernetes clusters, I check that a tool provides native support across hybrid and multi-cloud setups.
- Alerting & Anomaly Detection: I look for configurable alert rules with routing to channels like Slack, PagerDuty, or Teams, so the right on-call engineer gets notified instead of an entire department.
- Log & Event Management: Correlating a spike in error rates with a specific deployment matters, so I evaluate how well each tool ties log data to infrastructure metrics for root cause analysis.
- Network & Uptime Monitoring: I check for availability and latency tracking via methods like ping, SNMP, or synthetic checks that confirm services are reachable from the end user's perspective.
- Historical Data & Reporting: Capacity planning requires months of trend data, so I look at retention windows and whether a tool can generate reports useful for SLA reviews or resource forecasting.
Once I have a list of tools that meet this criteria, I consider what sets each platform apart.
Differentiating Factors (What Sets Vendors Apart)
Here's how I compare and contrast different vendors:
Standout Features
Auto-discovery matters when your environment changes constantly. I look for tools that detect new containers or VMs as they come online and map dependencies without manual configuration. AIOps capabilities separate reactive tools from proactive ones, especially when ML-driven anomaly detection catches a memory leak before a threshold alert would fire. I also evaluate infrastructure-as-code support, since teams managing monitors through Terraform or YAML can version-control their alerting configs alongside deployment pipelines.
Beyond Features
Pricing predictability is a big deal here. I check whether a vendor charges per host, per metric, or by ingestion volume, since a surprise bill after a traffic spike can wreck a budget. Integration ecosystem depth also matters. Support for OpenTelemetry and Prometheus means your team avoids vendor lock-in and can pipe data into existing ITSM tools like ServiceNow or Jira. I also evaluate deployment flexibility, because teams in regulated industries often need self-hosted or regional SaaS options to meet data residency requirements.
How to Choose an Infrastructure Monitoring Tool
It’s easy to get bogged down in long feature lists and complex pricing structures. To help you stay focused as you work through your unique software selection process, here’s a checklist of factors to keep in mind:
| Factor | What to Consider |
| Scalability | Ensure the tool can grow with your business. Look for solutions that can handle increased data and user loads without compromising performance. |
| Integrations | Check if the tool integrates with your existing software stack. Compatibility with platforms like AWS, Azure, and Google Cloud is crucial for smooth operations. |
| Customizability | Look for tools offering customizable dashboards and reports. This flexibility allows you to tailor the interface to fit your team's specific monitoring needs. |
| Ease of Use | Choose a tool that offers an intuitive interface and straightforward navigation. This reduces the training time for your team and enhances productivity. |
| Budget | Evaluate the pricing structure and ensure it fits your financial plan. Consider hidden costs like additional features, support, or data storage fees. |
| Security Safeguards | Prioritize tools with strong security measures. Features like encryption, access controls, and compliance with data protection regulations are essential. |
| Real-Time Alerts | Opt for tools that offer real-time notifications. This ensures your team can respond quickly to issues, minimizing downtime and potential losses. |
| Support | Assess the quality and availability of customer support. A responsive support team can be invaluable in resolving issues and offering guidance. |
Trends in Infrastructure Monitoring Tools
In my research, I sourced countless product updates, press releases, and release logs from different infrastructure monitoring tools vendors. Here are some of the emerging trends I’m keeping an eye on:
- AI-Driven Insights: More tools are using AI to provide predictive analytics and insights. This helps teams anticipate issues before they occur, saving time and reducing downtime. Vendors like Dynatrace have integrated AI to enhance their monitoring capabilities.
- Full-Stack Visibility: There's a growing demand for tools that offer visibility across the entire tech stack. Businesses need to monitor everything from hardware to applications in one place. New Relic offers full-stack monitoring to meet this need.
- User Experience Monitoring: App and website monitoring tools are increasingly focusing on end-user experience. By monitoring user interactions, businesses can improve performance and satisfaction. Germain UX, for example, emphasizes user experience analytics.
- Hybrid Cloud Support: As more businesses adopt hybrid cloud strategies, monitoring tools are evolving to support these environments. This ensures seamless operation across on-premises and cloud infrastructure. Logic Monitor is known for its hybrid cloud capabilities.
- Data Security Enhancements: With rising cyber threats, there's a strong focus on improving data security within monitoring tools. Features like encryption and compliance with data regulations are becoming standard. Tools like Malwarebytes for Business prioritize these security measures.
What Are Infrastructure Monitoring Tools?
Infrastructure monitoring tools track the performance and health of IT infrastructure components. IT administrators, DevOps teams, and network engineers typically use these tools to ensure systems are running efficiently and to prevent downtime.
Real-time alerts, performance metrics, and user experience monitoring help with identifying issues, optimizing resource usage, and maintaining system reliability. These tools provide businesses with the insights needed to maintain operational efficiency and improve overall system performance.
Features of Infrastructure Monitoring Tools
When selecting infrastructure monitoring tools, keep an eye out for the following key features:
- Real-time alerts: Notify users of issues as they arise, allowing for quick response and minimizing potential downtime.
- Performance metrics: Provide detailed insights into system health and efficiency, helping teams optimize resources.
- User experience monitoring: Track end-user interactions to improve application performance and satisfaction.
- Predictive analytics: Use AI to forecast potential issues, enabling proactive maintenance and reducing disruptions.
- Full-stack visibility: Offer a comprehensive view of the entire tech stack, ensuring all components are monitored in one place.
- Hybrid cloud support: Ensure compatibility with both on-premises and cloud environments, supporting diverse IT strategies.
- Automated issue resolution: Automatically identify and resolve common problems, saving time and effort for IT teams.
- Customizable dashboards: Allow users to tailor data visualization to meet specific monitoring needs and preferences.
- Data security enhancements: Provide features like encryption and compliance with regulations to protect sensitive information.
- Scalability: Adapt to growing business needs, handling increased data and user loads without compromising performance.
Benefits of Infrastructure Monitoring Tools
Implementing infrastructure monitoring tools provides several benefits for your team and your business. Here are a few you can look forward to:
- Improved uptime: Real-time alerts and predictive analytics help prevent downtime by addressing issues before they escalate.
- Enhanced performance: Performance metrics allow teams to optimize system resources, ensuring efficient operation.
- Better user experience: User experience monitoring helps identify and resolve issues that affect application performance and user satisfaction.
- Cost savings: Automated issue resolution reduces the need for manual intervention, saving time and labor costs.
- Security compliance: Data security enhancements protect sensitive information and ensure compliance with industry regulations.
- Scalability: The ability to grow with your business means the tools can handle increased demands without compromising service quality.
- Informed decision-making: Full-stack visibility provides comprehensive insights, enabling teams to make data-driven decisions.
Costs and Pricing of Infrastructure Monitoring Tools
Selecting infrastructure monitoring tools requires an understanding of the various pricing models and plans available. Costs vary based on features, team size, add-ons, and more. The table below summarizes common plans, their average prices, and typical features included in infrastructure monitoring tools solutions:
Plan Comparison Table for Infrastructure Monitoring Tools
| Plan Type | Average Price | Common Features |
| Free Plan | $0 | Basic monitoring, limited alerts, and community support. |
| Personal Plan | $5-$25/user/month | Real-time alerts, performance metrics, and customizable dashboards. |
| Business Plan | $30-$75/user/month | Full-stack visibility, user experience monitoring, and automated issue resolution. |
| Enterprise Plan | $80-$150/user/month | Predictive analytics, hybrid cloud support, and advanced security safeguards. |
Infrastructure Monitoring Tools FAQs
Here are some answers to common questions about infrastructure monitoring tools:
What are the parameters of infrastructure monitoring?
Infrastructure monitoring tools cover parameters like CPU and memory usage, network traffic, disk space, response times, and error rates. These parameters help your team ensure systems are running smoothly and efficiently. By tracking these metrics, you can identify bottlenecks and optimize performance.
What must be installed in your infrastructure to monitor on-premises infrastructure?
To monitor on-premises infrastructure, you’ll need to install software agents on each system. These agents collect data and send it to the monitoring server. This setup helps you maintain visibility over your entire network, ensuring you can quickly address any issues that arise.
What is the difference between application monitoring and infrastructure monitoring?
Application monitoring focuses on app availability and user experience, while infrastructure monitoring provides visibility into your network environment. Both are important, but infrastructure monitoring helps protect against cost-inefficiencies and security threats by keeping an eye on the underlying systems.
How do infrastructure monitoring tools handle alerts?
The pricing for infrastructure monitoring tools can start from around $20 per month for basic, entry-level solutions and can go up to several thousand dollars per month for comprehensive, enterprise-level solutions.
Can infrastructure monitoring tools integrate with other systems?
Yes, most infrastructure monitoring tools offer integrations with other systems like cloud platforms, IT service management tools, and collaboration software. These integrations help streamline workflows and provide a unified view of your IT environment, enhancing overall efficiency.
How do infrastructure monitoring tools support scalability?
Infrastructure monitoring tools support scalability by handling increased data and user loads without degrading performance. They offer features like auto-scaling and load balancing, ensuring your systems can grow with your business. This adaptability is crucial for maintaining performance during growth.
What's Next?
If you're in the process of researching infrastructure monitoring tools, connect with a SoftwareSelect advisor for free recommendations.
You fill out a form and have a quick chat where they get into the specifics of your needs. Then you'll get a shortlist of software to review. They'll even support you through the entire buying process, including price negotiations.