10 Best Application Monitoring Tools of 2026

10 Best Application Monitoring Tools Shortlist


You might find yourself overwhelmed with the endless options for monitoring tools, each claiming to be the best. That's where I come in. I’ve independently tested and reviewed these tools to help you make informed decisions.
Application monitoring tools can alleviate the stress of unexpected downtimes and performance issues, letting you focus on what truly matters—growing your business.
In this article, I’ll share my top picks, providing you with unbiased insights and practical advice. You'll discover which tools suit your team’s unique needs and how they can enhance your workflow efficiency.
Why Trust Our Software Reviews
We’ve been testing and reviewing software since 2023. As tech leaders ourselves, we know how critical and difficult it is to make the right decision when selecting software.
We invest in deep research to help our audience make better software purchasing decisions. We’ve tested more than 2,000 tools for different tech use cases and written over 1,000 comprehensive software reviews. Learn how we stay transparent & our software review methodology.
Best Application Monitoring Tools Summary
| Tool | Best For | Trial Info | Price | ||
|---|---|---|---|---|---|
| 1 | Best for companies in finance | Free trial available | From $7/host/month | Website | |
| 2 | Best for real-time error monitoring | Free plan + free trial + free demo available | From $26/month (billed annually) | Website | |
| 3 | Best unified monitoring platform | 14-day free trial | From $15/host/month (billed annually) | Website | |
| 4 | Best for code-level insights | 30-day free trial + free demo + free plan availabl | From $199/year | Website | |
| 5 | Best for educational institutions | 30-day free trial + free demo available | From $10/month (billed annually) | Website | |
| 6 | Best error tracking features | Free plan available | From $49/user/month | Website | |
| 7 | Best for online games | Free plan + demo available | From $130/month | Website | |
| 8 | Best incident management features | Free demo available | From $21.20/MVS/month | Website | |
| 9 | Best APM for AWS | Free plan available | Pricing upon request | Website | |
| 10 | Best open-source option | Free plan available | From $19/month | Website |
-

TestDevLab
Visit Website -
Site24x7
Visit WebsiteThis is an aggregated rating for this tool including ratings from Crozdesk users and ratings from other sites.4.7 -
GitHub Actions
Visit WebsiteThis is an aggregated rating for this tool including ratings from Crozdesk users and ratings from other sites.4.8


Best Application Monitoring Tools Reviews
Here are my favorite application monitoring solutions, with brief but comprehensive overviews including strengths, weaknesses, and pricing information:
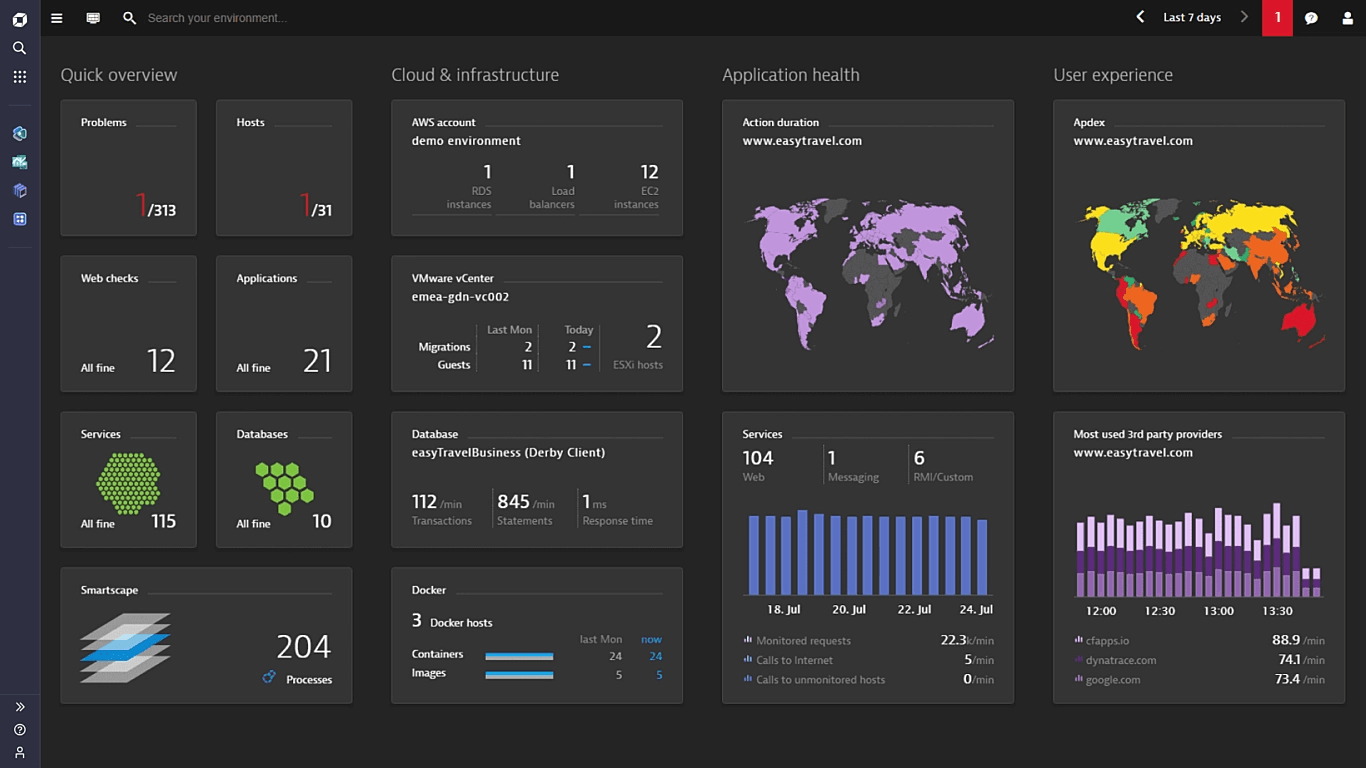
Dynatrace is a unified observability platform whose solutions include modules for application observability and security, digital experience, infrastructure observability, automation, and business insights.
Why I picked Dynatrace: I picked Dynatrace because of Grail, a central observability and analytics tool. It collects causal data on a massive scale and delivers AI-powered insights with full context to help you make business decisions, which I felt would be especially useful for fintech companies. I also liked the ability to set custom parameters that flag unusual behavior.
Dynatrace standout features and integrations:
Features that make Dynatrace ideal for financial apps, in my opinion, include its support for BizDevOps with built-in BI tools that allow you to involve business teams in the development process.
I also liked that it allows you to set up targeted notifications so you can make sure the most qualified personnel are alerted whenever there’s an issue. For example, an indication of possible fraud could go to someone on the finance team, rather than the development team.
Integrations are pre-built for Jenkins, GitLab, JFrog, Microsoft Teams, Mulesoft, LaunchDarkly, ServiceNow, Jira, Prometheus, and Grafana.
Pros and Cons
Pros:
- Targeted notifications
- Supports BizDevOps with BI tools
- Large-scale causal data processing
Cons:
- Steep learning curve
- Support is hit-or-miss
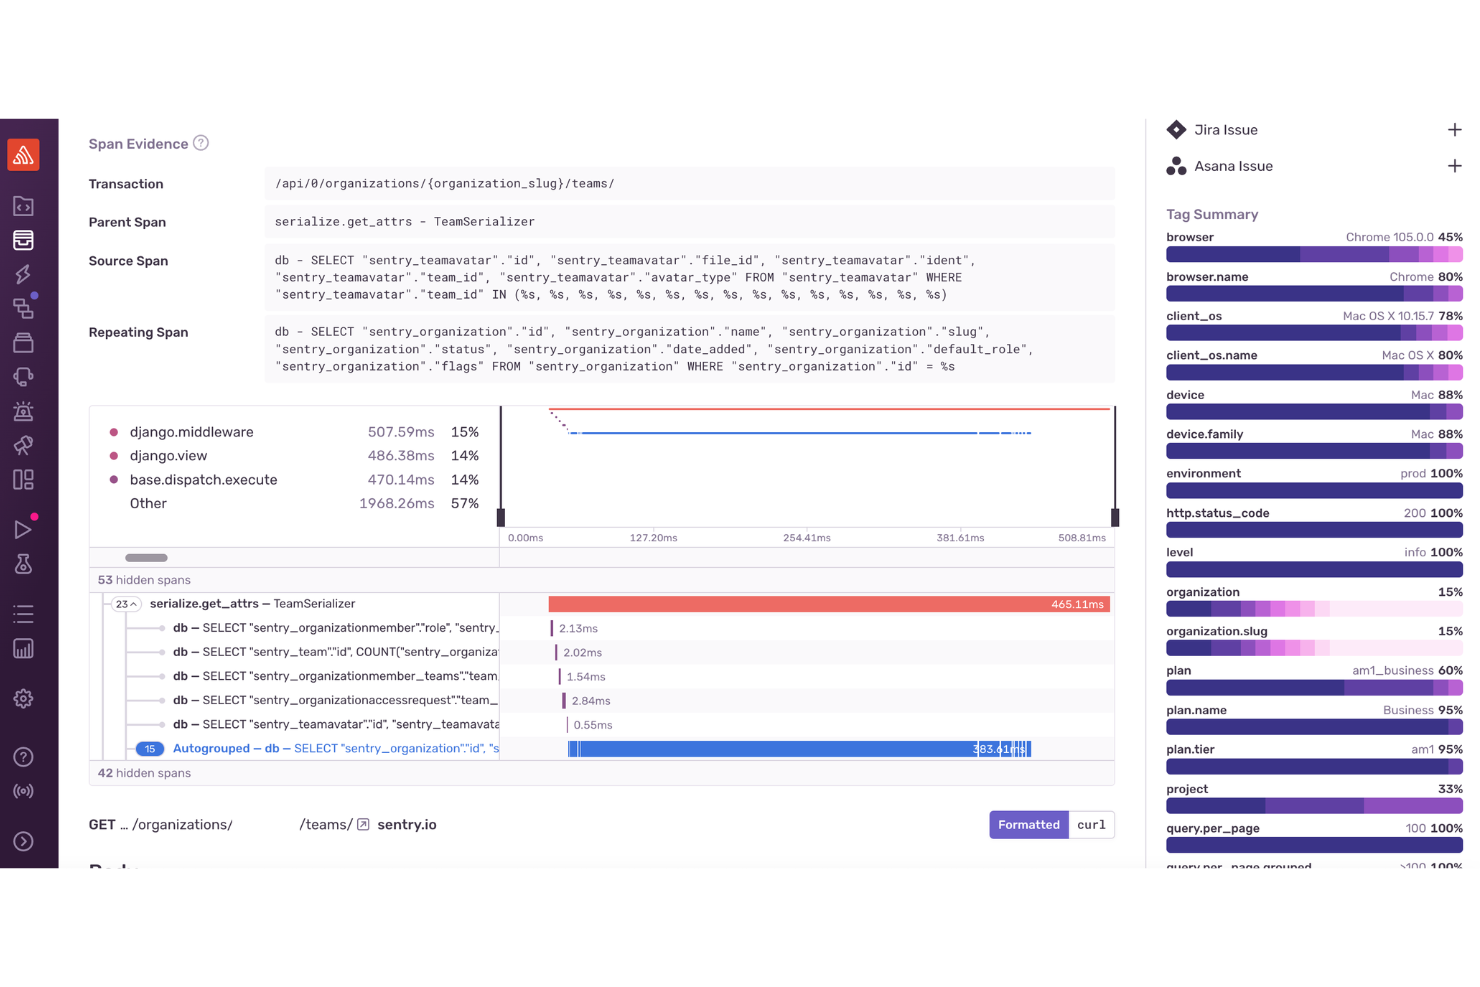
Sentry helps your development team catch and understand errors and performance issues in your applications by giving real-time visibility into what’s going wrong in your code and why. It’s tailored to software teams who want deeper insight into exceptions, performance bottlenecks, and release health across web, mobile, and backend systems, giving you context that goes beyond simple logging.
Why I Picked Sentry
I picked Sentry because it combines detailed real-time error monitoring with code-level performance insights in one platform, helping your team diagnose problems with precision. Sentry’s error tracking captures unhandled exceptions and groups similar issues to help you focus on what matters most, while linking them to commits lets you trace faults back to specific changes. Its distributed tracing and performance monitoring give you transaction-level visibility, so you can pinpoint slow endpoints or bottlenecks without digging through logs.
Sentry Key Features
In addition to its standout features, Sentry offers several other functionalities that enhance its application monitoring capabilities:
- Session Replay: This feature allows you to replay user sessions to understand the context behind errors and improve user experience.
- Release Tracking: Ties errors and performance changes to specific releases so you can monitor how new versions impact stability over time.
- Uptime Monitoring: Ensures your application is always accessible by monitoring its availability and alerting you to any downtime.
- Profiling: Offers detailed insights into performance issues by examining runtime behavior, helping you optimize application speed.
Sentry Integrations
Integrations include GitHub, Slack, Jira, Bitbucket, GitLab, Trello, PagerDuty, Azure DevOps, Twilio, and Zendesk.
Pros and Cons
Pros:
- Distributed tracing shows transaction-level performance insights
- Advanced error grouping helps prioritize issues for fast resolution
- Offers real-time error tracking across web, mobile, and backend apps
Cons:
- Limited alerts and applications insights in lower-tier plans
- Not all integrations are available natively, relying on third-party APIs for some
New Product Updates from Sentry

Sentry Adds GitLab Support and gRPC Instrumentation
Sentry adds GitLab support for Seer and gRPC instrumentation for Dart and Flutter to improve root cause analysis, code tracing, and debugging workflows. For more information, visit Sentry’s official site.
 .
.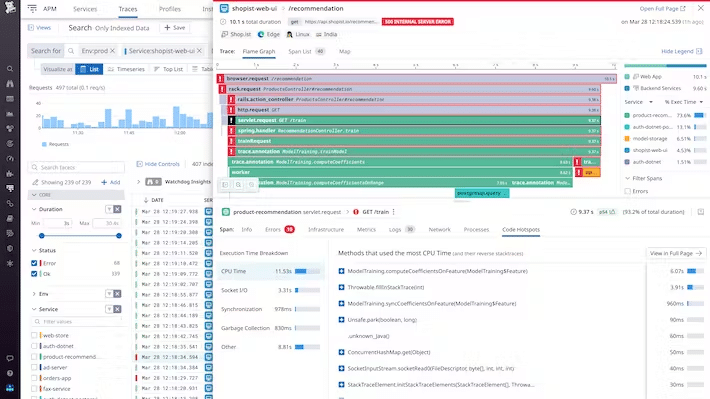
Datadog is a monitoring and security platform for applications and infrastructure, with features such as logs and software delivery.
Why I picked Datadog: I picked Datadog because it’s an all-in-one monitoring solution that creates a single pane of glass to visualize not only your app, but also your associated networks, databases, infrastructure, and containers. I also liked how the collaboration features helped me bridge the gap between developers and business teams.
Datadog standout features and integrations:
Features that make Datadog ideal as a unified monitoring platform for applications and network environments, in my opinion, include the logging functions that provide audit trails, observability pipelines, and scanners for sensitive data.
It also allows you to manage the digital experience with in-depth functions that cover session recording and replay, error tracking, and real user and synthetic monitoring.
Integrations are pre-built for Argo CD, CircleCI, Travis CI, Azure DevOps, GitHub, Jira, GitLab, Auth0, Kubernetes, and Docker.
Pros and Cons
Pros:
- Comprehensive digital experience management features
- In-depth log management features
- All-in-one monitoring platform
Cons:
- Relatively steep learning curve
- Sparse documentation
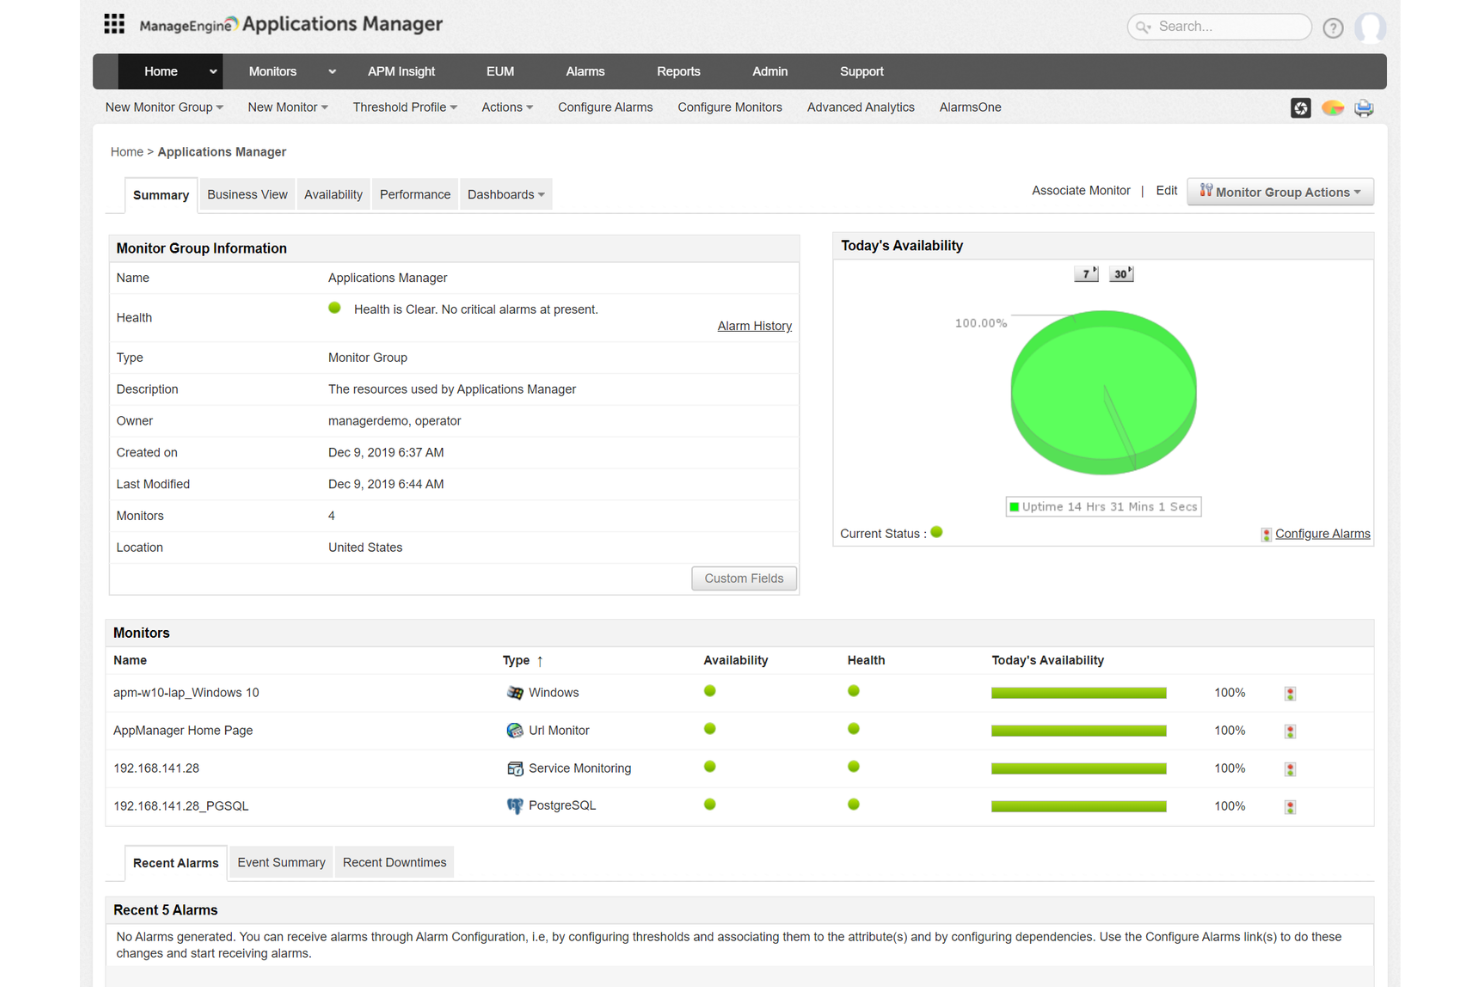
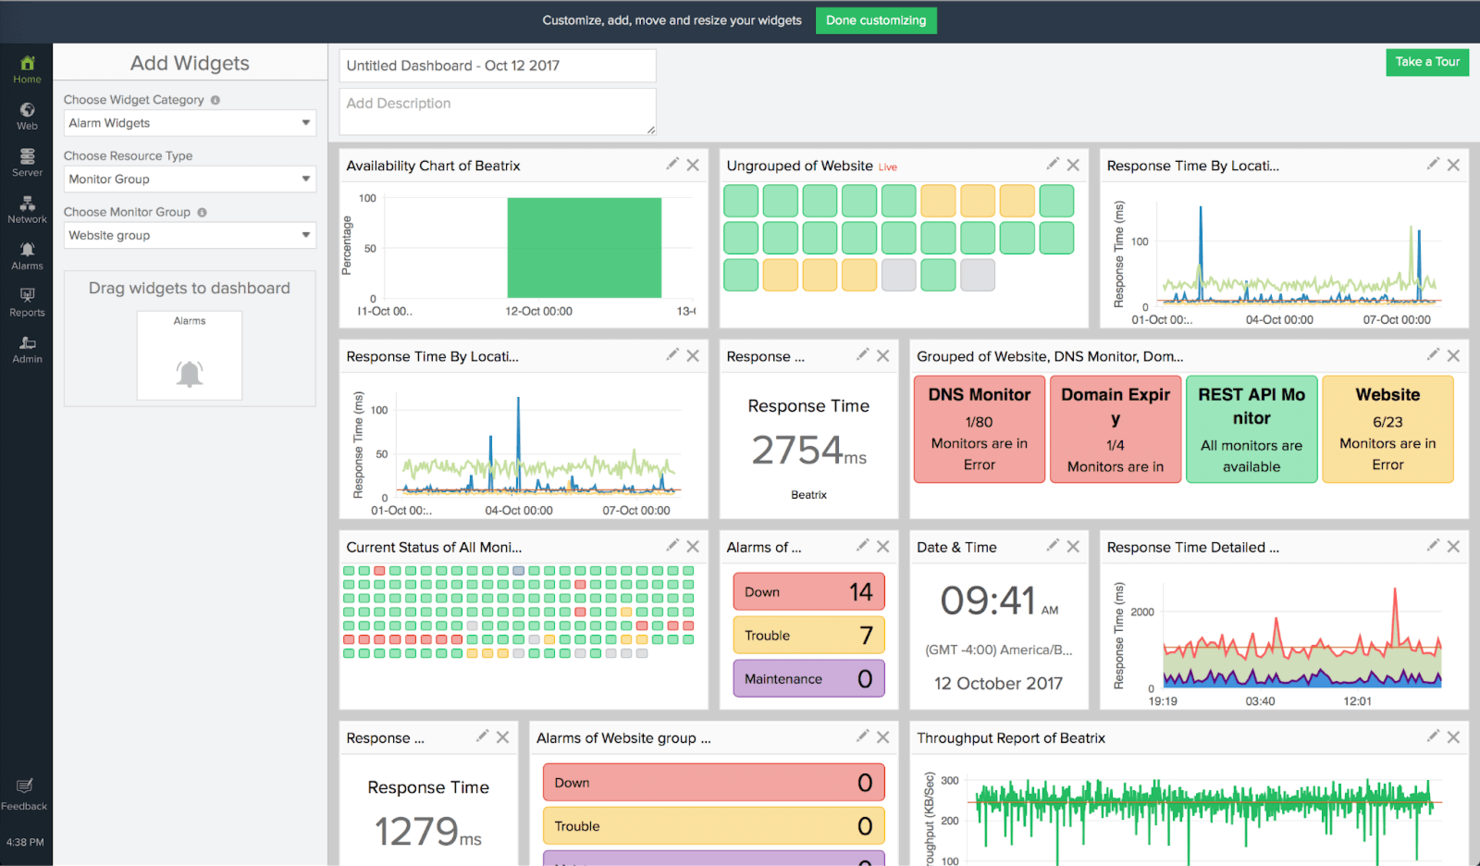
ManageEngine Applications Manager is a robust application performance monitoring tool designed for IT teams and administrators.
Why I picked ManageEngine Applications Manager: I like its ability to provide code-level insights into your applications. This feature helps you identify problematic elements in your application code, allowing you to address issues before they affect your users. Additionally, it offers thread profiling, which can reveal bottlenecks in your code stack, enabling you to optimize performance effectively.
ManageEngine Applications Manager standout features and integrations:
Features include real user monitoring, which provides real-time insights into user experience by tracking page load times and session details. This helps you identify and resolve user experience issues proactively. Additionally, its hybrid cloud monitoring collects and analyzes data from both on-premises and cloud-based infrastructure, giving you a comprehensive view of your IT environment.
The application dependency mapping feature visualizes the relationships between your application components, helping you understand how services, APIs, and databases interact, which is essential for effective troubleshooting.
Build 181400 adds Oracle Cloud Application Monitoring, letting you track Oracle Cloud applications’ performance and availability directly in Applications Manager.
Integrations include ManageEngine ServiceDesk Plus, ServiceNow, Site24x7, AlarmsOne, Slack, Prometheus, AWS, Google Cloud, Microsoft Azure, Oracle, and MySQL.
Pros and Cons
Pros:
- Simplifies management of applications and their relationships
- Real-time alerting system helps teams respond promptly to issues
- Monitors a wide range of applications and infrastructure components
Cons:
- The tool can be resource-intensive
- Setting up the tool to meet specific needs can be challenging
New Product Updates from ManageEngine Applications Manager
ManageEngine Applications Manager Adds ServiceDesk Plus MSP Cloud
ManageEngine Applications Manager adds ServiceDesk Plus MSP Cloud integration to automatically create and manage tickets from application alarms, helping teams track and resolve incidents faster. For more information, visit ManageEngine Applications Manager’s official site.
 .
.
Site24x7 provides monitoring tools for use on applications, websites, networks, servers, public and private clouds, and synthetic web transactions.
Why I picked Site24x7: Among the list of Site24x7’s customers are some recognizable names in education, like Stanford and Oxford, and the product makes a good case for why. For starters, it complies with many of the standards imposed on educational institutions, including SOC 2 and ISO 27001, so you’re comfortable handling student and staff data.
Site24x7 standout features and integrations:
Features that make Site24x7 ideal for educational institutions include the fact that it’s elastic and can automatically scale resource provision up or down based on usage, something that fluctuates throughout the day on a campus.
I also liked that it provides integrations for several popular avenues used for service requests and communication, including Discord, Microsoft Teams, Slack, ServiceNow, Freshdesk, and Telegram. I liked how easily this lets you collect feedback directly from students and faculty.
Integrations are pre-built for Jenkins, Bitbucket, GitHub, Freshdesk, Jira, Slack, Teams, Amazon EventBridge, ServiceNow, and Discord.
Pros and Cons
Pros:
- Unified monitoring for different platform types, including websites and clouds
- Supports popular communication apps
- Compliant with education industry standards
Cons:
- Crowded UI
- Doesn’t automatically group notifications, so they can be overwhelming
New Product Updates from Site24x7

Site24x7 Adds Discovery Issues for AWS Monitoring
Site24x7 added Discovery Issues for AWS monitoring, helping teams identify why resources are not being discovered across services and regions. The feature surfaces permission gaps, policy restrictions, and blocked API actions to support faster troubleshooting. For more information, visit Site24x7’s official site.
 .
.
New Relic is an observability platform that provides engineers and data scientists with data from a variety of sources, including web and mobile apps, infrastructure, and networks.
Why I picked New Relic: New Relic made it onto my list because of Errors Inbox, a full-stack error management feature. In my tests, I used it to group similar errors depending on importance, so I wasn’t getting the same notifications for both severe and negligible issues. I was also able to set it up so particular notifications go directly to the relevant team in Slack.
New Relic standout features and integrations:
Features that make New Relic the ideal APM for error tracking include the ability to set up a workload in a pre-production environment and have it flag issues before they get to production, then send notifications to Slack immediately.
I also found that it keeps error data even after they’ve been resolved, so you can go through things like contextual information, attachments, and comments after the fact if you need to know how something got addressed and who was involved.
Integrations are pre-built for VMware vSphere, Relic, Kafka, HAProxy, JFrog, Apache Cassandra, Amazon ECS, Netlify, Oracle Database, and NGINX.
Pros and Cons
Pros:
- Stores error data
- Targeted notifications for errors
- Error grouping
Cons:
- Can get expensive
- The number of features can be overwhelming for new users
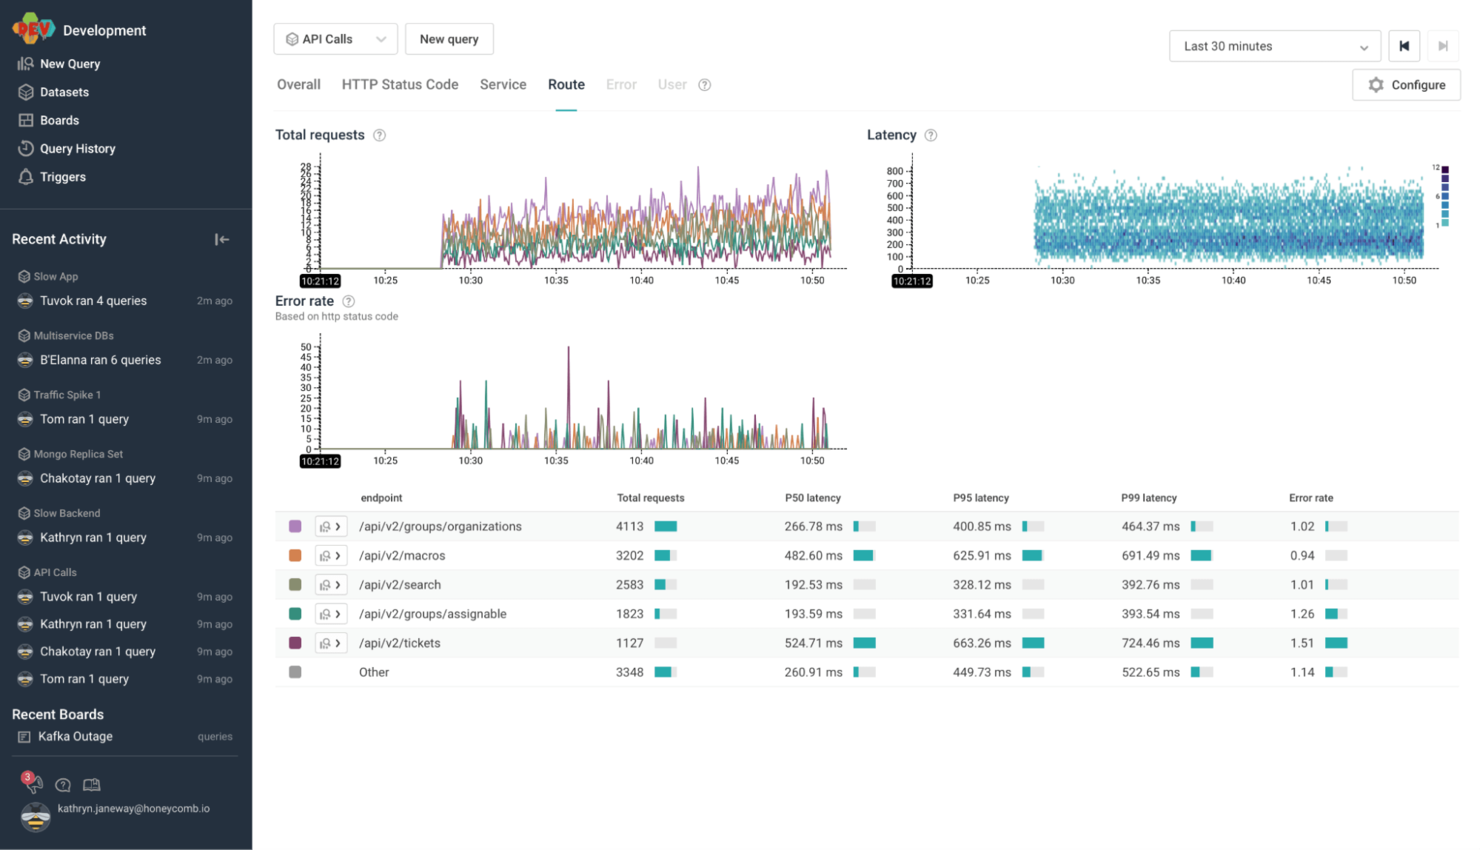
Honeycomb is an event management platform for distributed services that seeks to provide insight from one hub.
Why I picked Honeycomb: If the application you’re looking to monitor is actually a game, then I think Honeycomb might be the right solution for your team. I tested its distributed tracing functions as implemented alongside a feature called BubbleUp; BubbleUp analyzes requests from different teams for common trends to give you a more holistic picture of how users interact with the product. In a game development scenario, the data could be about players and collected from teams such as development, audio, and design.
Honeycomb standout features and integrations:
Features that make Honeycomb ideal for game development companies, in my opinion, include Service Map, which creates a visual representation of all linked services in your application; this is a valuable tool for monitoring games designed as microservices, considering you can also use it to conduct visual debugging.
OpenTelemetry allows you to instrument your code for Honeycomb so you can generate your own telemetry data. You only need to set it up once, and you can use the data on any back-end service you want, so you don’t worry about being locked into a vendor.
Integrations are pre-built for GitHub, LaunchDarkly, CircleCI, Terraform, Consul, AWS Lambda, Slack, PagerDuty, Chef, and GitLab.
Pros and Cons
Pros:
- Strong distributed tracing features
- Good for managing microservices
- Custom telemetry
Cons:
- Takes a while to set up and get used to
- Expensive

Instana Observability, often referred to simply as Instana, is an APM from IBM that provides automated full-stack visibility and quick notifications.
Why I picked IBM Instana: In my evaluation, I found that Instana has robust features for incident reporting, including AI-powered alerts. As soon as it discovers a service, it automatically starts tracking KPIs related to it, i.e., errors, load, and latency and sends out a notification whenever they go above or below an acceptable level.
IBM Instana standout features and integrations:
Features that I found make IBM Instana ideal for incident management include automatically recognizing and logging changes based on whether something goes live or offline, then tying it to other activity to determine if it needs to send an alert. It also provides you with contextual information when it does send an alert so you can decrease the amount of time you spend addressing issues in your application.
Integrations are pre-built for OpsGenie, Microsoft 365, Slack, Traefik, PagerDuty, Jaeger, TIBCO EMS, VMware Tanzu, Coralogix, and Splunk.
Pros and Cons
Pros:
- Strong automation features
- Accurate incident and change detection
- Simplifies remediation with detailed notifications
Cons:
- Takes a while to fully configure
- High processor usage

CloudWatch is an APM that makes up part of the AWS family from Amazon, with a focus on collecting logs and metrics across clouds.
Why I picked Amazon CloudWatch: Even though CloudWatch is a versatile tool that you can deploy even on-premise, I’ve found it works best if you keep it on AWS. You can use it to monitor apps you’ve deployed under different AWS accounts and services, including ECS, S3, and Lambda, and get data from all of them in one place.
Amazon CloudWatch standout features and integrations:
Features that make CloudWatch my preferred APM for AWS include the fact that it’s FedRamp and PCI compliant, with the option to use Amazon Key Management Service (KMS) to encrypt logs and increase security compliance.
As far as gathering the logs, you have several options if you’re on AWS, including VPC Flow Logs and Route 53 for vended logs or collecting them from AWS services that publish them, including ECS and API Gateway.
Integrations are native for other AWS products and services, including DynamoDB, CloudTrail, ECS, EKS, FarGate, API Gateway, VPC Flow Logs, Route 53, Lambda, and EventBridge.
Pros and Cons
Pros:
- Strong support for logging
- Is part of the AWS free tier
- Natively integrates with useful AWS services
Cons:
- Relies heavily on other tools
- Weaker outside AWS

Grafana is an open-source observability platform from Grafana Labs that can handle full-stack monitoring on both cloud and self-hosted environments.
Why I picked Grafana: I chose Grafana because it’s open-source and provides several useful monitoring features for users that want to go the self-managed route. One standout feature is Agent, which you can use to collect telemetry data, including traces, logs, and metrics, then send them to your preferred endpoint as long as it’s compatible with OpenTelemetry, Loki, or Prometheus.
Grafana standout features and integrations:
Features that made me recommend Grafana include its transparency and accessibility. Being open-source gives you the option to build your own features, and generally makes for more secure and cost-effective products. I also liked that you can try a fully-interactive online demo without having to contact the sales team. If your project needs additional monitoring, you can easily integrate additional Grafana tools for both back-end and front-end monitoring, which provide the ability to collect real-user data for logs, metrics, traces, and events.
Integrations are pre-built for GitHub, GitLab, Jenkins, Consul, Traefik, Snowflake, CloudWatch, Kafka, Redis, and Oracle Database.
Pros and Cons
Pros:
- Free interactive web demo
- Robust data visualization features
- Open-source
Cons:
- Requires deeper technical expertise to get the most out of it
- Logs don’t persist natively
Other Application Monitoring Tools
Still looking? Here are some other solid tools I encountered while researching this list that might give you some additional options.
- Google Cloud Operations
APM for Google Cloud
- SolarWinds Server and Application Monitor
Dependency mapping
- LogRocket
For e-commerce companies
- eG Innovations
For Node.js applications
- Icinga
For open-source monitoring
- Dotcom Monitor
For simulating & scripting user behavior
- Coralogix
Tracing data
- Sumo Logic
For on-premise deployments
- LogicMonitor
Automation features
- Zabbix
Network monitoring features
- Checkmk
For ITOps
- IBM Turbonomic
For Kubernetes environments
- Veeam ONE
Disaster recovery features
- Azure Monitor Application Insights
APM for Azure
- Microsoft System Center
For data center management


How I Evaluate Application Monitoring Tools
I evaluate tools on two layers: the baseline APM capabilities needed to trace a latency spike through microservices, and the differentiators that make one tool a better fit than another.
Core Functionality (Table Stakes For This List)
When I'm selecting tools for my list, I rank each one on a scale from 0 (does not offer the functionality) to 5 (excels in this area) for each core functionality listed below. Then, I calculate the tool's total score into a percentage. Each tool needs to achieve a minimum total score of 75% to be considered for inclusion.
- Real-Time Performance Monitoring: I check whether the tool surfaces response times, throughput, and resource usage in real time—like catching a sudden latency spike on a checkout API mid-deployment.
- Distributed Tracing: Tracing a single request across dozens of microservices is where tools prove their value, so I evaluate how each one maps dependencies and isolates slow spans.
- Error & Exception Tracking: I look for automatic error grouping with full stack traces and contextual data, such as tying a surge in 500 errors back to a specific release or environment.
- Alerting & Anomaly Detection: Good alerting goes beyond static thresholds. I evaluate whether tools support dynamic baselines and route notifications to channels like Slack or PagerDuty.
- Metrics, Logs & APM Dashboards: Correlating a memory leak in metrics with a matching log pattern and a slow trace should happen in one view. I look at how well each tool unifies these signals.
- Multi-Stack & Cloud Integration: Whether your stack runs on Kubernetes, serverless functions, or VMs across AWS, Azure, or GCP, I check the breadth of supported languages, frameworks, and platforms.
Once I have a list of tools that meet this criteria, I consider what sets each platform apart.
Differentiating Factors (What Sets Vendors Apart)
Here's how I compare and contrast different vendors:
Standout Features
AIOps capabilities matter here—when an on-call engineer gets paged at 2 a.m., automated root cause analysis can cut triage from hours to minutes. I also evaluate real user monitoring, which reveals how actual users experience your app rather than what your servers report. Release tracking is another differentiator I look for. Tools that correlate error spikes or latency shifts with a specific deployment make it far easier to decide whether to roll back or push a fix forward.
Beyond Features
Pricing predictability is a big one—telemetry costs can balloon fast, so I evaluate whether a vendor charges by host, data volume, or user, and how transparent those costs stay at scale. Integration support also matters. I check for native OpenTelemetry compatibility and connectors to incident tools like PagerDuty or ServiceNow, since APM data only helps if it reaches your on-call workflows. Security and compliance certifications like SOC 2 Type II and HIPAA are worth confirming early, especially if your team handles sensitive data.
How to Choose Application Monitoring Tool
It’s easy to get bogged down in long feature lists and complex pricing structures. To help you stay focused as you work through your unique software selection process, here’s a checklist of factors to keep in mind:
| Factor | What to Consider |
|---|---|
| Scalability | Can the tool grow with your business? Ensure it handles increased traffic and data without compromising performance. |
| Integrations | Does it integrate with your existing software stack? Look for compatibility with tools you already use to avoid disruptions. |
| Customizability | Can the tool be tailored to your specific needs? Assess its flexibility to adapt to your workflow and requirements. |
| Ease of use | Is the interface user-friendly? Consider how quickly your team can learn to use it effectively without extensive training. |
| Implementation and onboarding | How long will setup take? Check for available resources like tutorials or support that can ease the transition. |
| Cost | Does it fit your budget? Compare pricing plans and consider long-term costs, including any hidden fees or additional charges. |
| Security safeguards | Are data protection measures in place? Verify compliance with industry standards and evaluate encryption and access controls. |
What Are Application Monitoring Tools?
Application monitoring tools are software solutions designed to track, analyze, and manage the performance of applications. IT professionals, developers, and operations teams generally use these tools to ensure optimal application performance and user satisfaction.
Monitoring, alerting, and reporting capabilities help with identifying issues, maintaining uptime, and optimizing resources. These tools ultimately provide peace of mind by ensuring applications run smoothly and efficiently.
Features
When selecting application monitoring tools, keep an eye out for the following key features:
- Real-time monitoring: Continuously tracks application performance to identify and address issues as they arise.
- Alerting system: Sends notifications to users when performance metrics fall outside acceptable thresholds, enabling quick response.
- Error tracking: Identifies and logs errors within applications, helping developers troubleshoot and resolve issues efficiently.
- Customizable dashboards: Allows users to tailor the interface to display the most relevant data for their specific needs.
- Integrations: Connects seamlessly with other tools and hardware monitoring software, ensuring a cohesive workflow and data sharing.
- Scalability: Adapts to growing business needs, handling increased data and traffic without affecting performance.
- User experience monitoring: Evaluates end-user interactions to ensure optimal application functionality and satisfaction.
- Data visualization: Transforms complex data into easily understandable charts and graphs for better analysis.
- Security safeguards: Protects sensitive data through encryption and access controls, ensuring compliance with industry standards.
- Reporting capabilities: Generates detailed reports on application performance, providing insights for informed decision-making.
Benefits
Implementing application monitoring tools provides several benefits for your team and your business. Here are a few you can look forward to:
- Improved uptime: By identifying issues quickly through real-time monitoring, these tools help keep applications running smoothly.
- Efficient troubleshooting: Error tracking and alert systems enable faster resolution of problems, reducing downtime and user frustration.
- Enhanced user experience: Monitoring user interactions ensures applications meet performance expectations, leading to higher satisfaction.
- Data-driven insights: Reporting and data visualization provide actionable insights, helping teams make informed decisions.
- Scalability: Tools that adapt to growing data and traffic needs ensure consistent performance as your business expands.
- Cost savings: By preventing major outages and optimizing resource usage, these tools help save on operational costs.
- Security assurance: Features like security safeguards protect sensitive data, maintaining compliance and building user trust.
Costs & Pricing
Selecting application monitoring tools requires an understanding of the various pricing models and plans available. Costs vary based on features, team size, add-ons, and more. The table below summarizes common plans, their average prices, and typical features included in application monitoring tools solutions:
Plan Comparison Table for Application Monitoring Tools
| Plan Type | Average Price | Common Features |
|---|---|---|
| Free Plan | $0 | Basic monitoring, limited data retention, and community support. |
| Personal Plan | $5-$25/user/month | Real-time alerts, basic reporting, and email support. |
| Business Plan | $30-$75/user/month | Advanced analytics, integrations with other tools, and phone support. |
| Enterprise Plan | $100-$250/user/month | Customizable dashboards, dedicated account management, and priority support. |
Application Monitoring Tools FAQs
Here are some answers to common questions about application monitoring tools:
Can application monitoring tools integrate with existing software?
Yes, most application monitoring tools can integrate with existing software systems. They often offer APIs and pre-built connectors for popular platforms like AWS, Azure, and Slack. This ensures seamless data flow and collaboration across your tech stack, enhancing overall efficiency.
How do application monitoring tools handle data privacy?
Application monitoring tools prioritize data privacy by employing encryption and access controls. When selecting a tool, review its privacy policies and compliance with regulations like GDPR or HIPAA. Always choose a tool that aligns with your organization’s data protection requirements.
Do these tools require agents, and how does installation differ?
Most tools use agents for deeper visibility into applications and infrastructure. Installation methods range from simple scripts to container-based deployment or package managers. Some tools offer agentless options but with limited functionality or visibility.
Is it necessary to have technical expertise to use application monitoring tools?
No, you don’t need extensive technical expertise to use application monitoring tools. Many tools offer user-friendly interfaces and provide tutorials and support to help you get started. However, having a basic understanding of your application’s architecture can enhance your ability to interpret the data effectively.
What deployment models do application monitoring tools support?
Deployment options vary across tools—some are SaaS-only, while others support on-premise or hybrid environments. The deployment model often affects how data is stored and accessed. It’s important to confirm compatibility with your existing infrastructure.
What’s Next:
If you're in the process of researching application monitoring tools, connect with a SoftwareSelect advisor for free recommendations.
You fill out a form and have a quick chat where they get into the specifics of your needs. Then you'll get a shortlist of software to review. They'll even support you through the entire buying process, including price negotiations.