10 Mejores Herramientas para Monitorización de Servidores Revisadas en 2026

Mejores herramientas de monitoreo de servidores (Shortlist)


El mejor software de monitoreo de servidores ayuda a los equipos a detectar problemas de rendimiento a tiempo, reducir el tiempo de inactividad, rastrear el uso de recursos y mantener los sistemas críticos funcionando de manera confiable. Estas herramientas ofrecen a los equipos de TI y operaciones la visibilidad necesaria para comprender cómo se comportan los servidores bajo carga y responder antes de que los usuarios se vean afectados.
Los equipos suelen buscar soluciones de monitoreo de servidores cuando las malas configuraciones provocan caídas, las revisiones manuales llevan a pasar por alto señales de advertencia o se descuidan vacíos de seguridad en infraestructuras clave. Estos problemas generan lentitud, fallos inesperados y desafíos para los equipos que intentan coordinar la resolución de incidencias en entornos complejos.
Con más de 20 años en la industria como Director de Tecnología (CTO), he probado y revisado docenas de plataformas de software de monitoreo de servidores en entornos reales para evaluar su precisión, opciones de integración y facilidad de uso. Esta guía resalta el mejor software de monitoreo de servidores que mejora la confiabilidad del sistema, facilita una respuesta rápida ante incidentes y ayuda a los equipos a mantener un rendimiento predecible. Cada reseña cubre características, ventajas y desventajas, y los casos de uso ideales para ayudarte a elegir la herramienta adecuada.
Table of Contents
- Mejores Herramientas Seleccionadas
- Por Qué Confiar en Nosotros
- Comparar Especificaciones
- Reseñas
- Otras Herramientas de Monitorización de Servidores
- Software Relacionado
- Criterios de Selección
- Cómo Elegir
- Tendencias
- ¿Qué Son las Herramientas de Monitorización de Servidores?
- Características
- Beneficios
- Costos y Precios
- Preguntas Frecuentes
Por qué confiar en nuestras reseñas de software
Llevamos probando y revisando software desde 2023. Como líderes tecnológicos, sabemos lo crítico y difícil que es tomar la decisión correcta al seleccionar software.
Invertimos en una investigación profunda para ayudar a nuestra audiencia a tomar mejores decisiones de compra de software. Hemos probado más de 2,000 herramientas para diferentes casos de uso tecnológicos y escrito más de 1,000 reseñas de software exhaustivas. Descubre cómo mantenemos la transparencia y nuestra metodología de revisión de software.
Resumen de las mejores herramientas de monitoreo de servidores
Esta tabla comparativa resume los detalles de precios de mis selecciones principales de herramientas de monitoreo de servidores para ayudarte a encontrar la mejor para tu presupuesto y necesidades empresariales.
| Tool | Best For | Trial Info | Price | ||
|---|---|---|---|---|---|
| 1 | Best for agentless Windows server monitoring | 14-day free trial + free demo available | Pricing upon request | Website | |
| 2 | Best open-source solution | Free plan available | Pricing upon request | Website | |
| 3 | Best for continuous server tracking | Free demo available | From $245/25 devices | Website | |
| 4 | Best for large-scale server monitoring | Free plan + 30-day free trial available | From $275/month (billed annually) | Website | |
| 5 | Best for real-time server monitoring | 30-day free trial | From $179/month (billed annually) | Website | |
| 6 | Best for extensive server metric tracking | 30-day free trial + free demo available | From $10/month (billed annually) | Website | |
| 7 | Best for AI-powered application performance | Free trial available | From $7/host/month | Website | |
| 8 | Best for distributed tracing and error debugging | Free plan + free trial + free demo available | From $26/month (billed annually) | Website | |
| 9 | Best for cloud-scale infrastructure monitoring | Free plan available | From $15/host/month (billed annually) | Website | |
| 10 | Best for endpoint management and patch compliance | 14-day free trial available | Pricing upon request | Website |
-

TestDevLab
Visit Website -
Site24x7
Visit WebsiteThis is an aggregated rating for this tool including ratings from Crozdesk users and ratings from other sites.4.7 -
GitHub Actions
Visit WebsiteThis is an aggregated rating for this tool including ratings from Crozdesk users and ratings from other sites.4.8


Reseñas de las mejores herramientas de monitoreo de servidores
A continuación encontrarás mis resúmenes detallados de las mejores herramientas de monitoreo de servidores que entraron en mi selección. Mis reseñas ofrecen un análisis detallado de las características clave, ventajas y desventajas, integraciones y casos de uso ideales de cada herramienta para ayudarte a encontrar la mejor para ti.
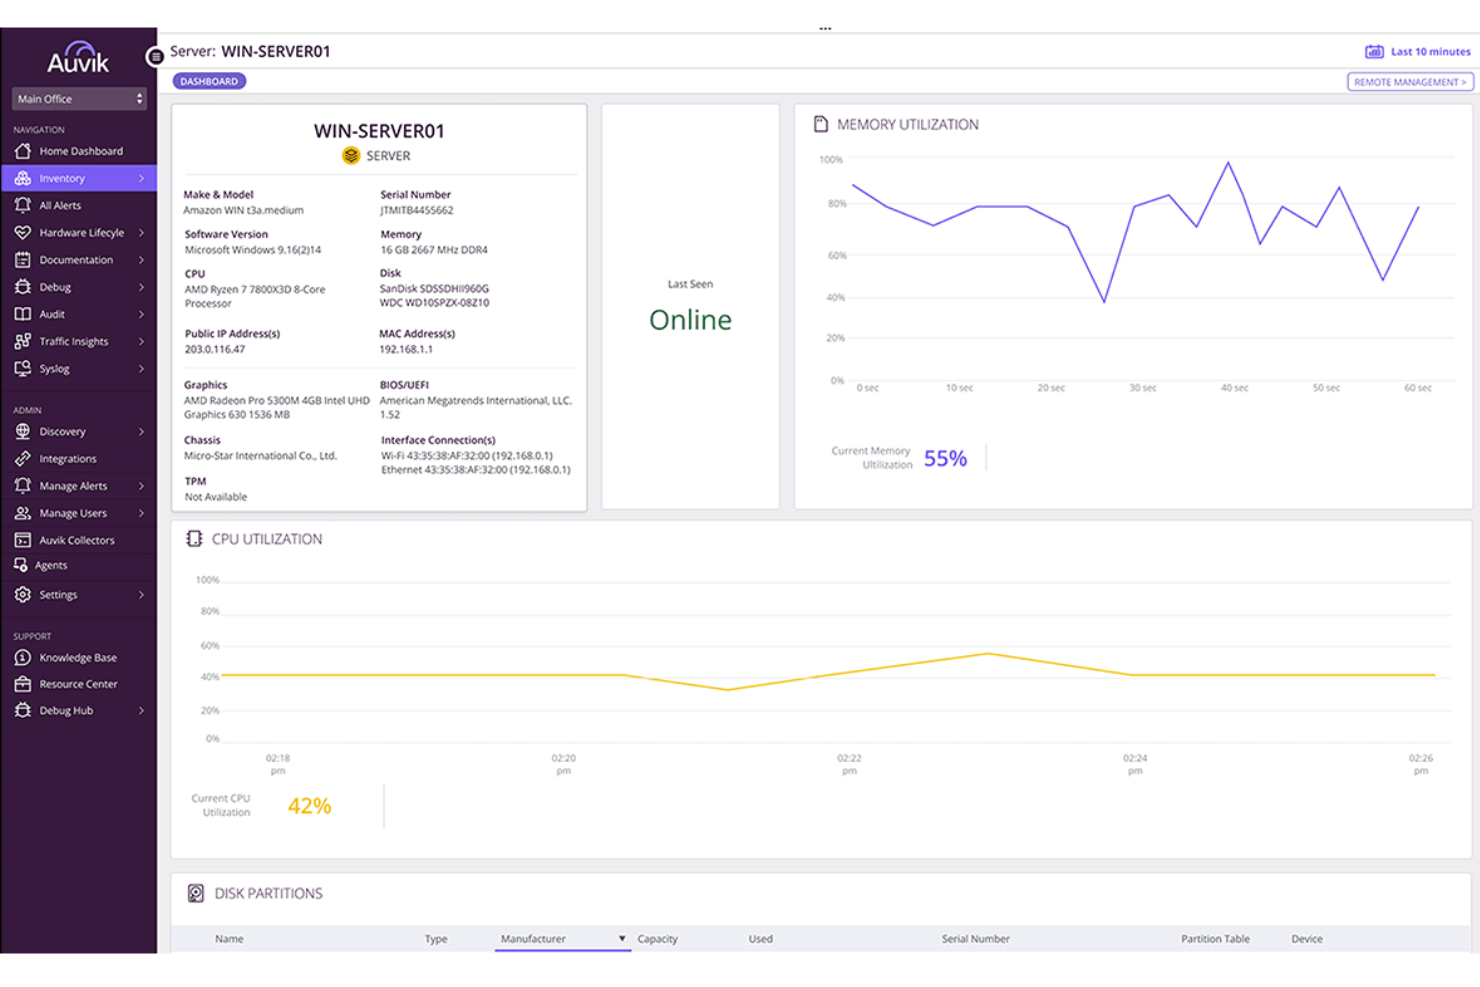
Auvik gives IT teams and managed service providers a way to monitor, map, and manage server and network infrastructure from a single cloud-based dashboard, helping you detect issues and maintain uptime across complex environments.
Who Is Auvik Best For?
Auvik is a strong fit for managed service providers and internal IT teams that need centralized visibility across multi-site or multi-client network and server environments.
Why I Picked Auvik
I picked Auvik as one of the best because I love how it handles Windows server monitoring without requiring you to rip and replace your existing setup. The agentless path via the Auvik Collector gives you real-time visibility into CPU, memory, disk utilization, and online status—without installing software on each server. I also like the Windows Services alerting, where my team can build custom alert rules using Alerts 2.0 to trigger on specific service states, service names, or utilization thresholds, with suppression options to cut down on noise from services that self-recover. The automated software inventory pulls application name, vendor, version, and install date from each monitored server, which is genuinely useful when you're doing a security audit or chasing down a software compliance issue.
Auvik Key Features
- Automated server discovery: Auvik automatically discovers Windows servers and surfaces detailed component and service information within minutes of deployment.
- Performance dashboards: View CPU, memory, and disk utilization trends over time in dedicated server dashboards, with historical data you can use to spot patterns and plan capacity.
- Performance forecasting: Auvik tracks CPU and memory metrics over time to identify usage trends and predict potential issues before they affect server availability.
- Multi-site infrastructure visibility: Monitor servers and network devices across unlimited sites from a single cloud-based dashboard, with all alerts and device data in one place.
Auvik Integrations
Auvik offers native integrations with ConnectWise, Autotask, ServiceNow, Slack, PagerDuty, Freshdesk, Zendesk, Microsoft Teams, and Webex, and also provides an API for custom integrations.
Pros and Cons
Pros:
- Agentless monitoring provides fast setup for Windows servers
- Real-time alerts help teams respond before performance degrades
- Automated configuration backups protect against changes gone wrong
Cons:
- Limited support for Linux and other non-Windows servers
- Advanced features may require additional setup and tuning
New Product Updates from Auvik
Auvik Adds Aurora Troubleshooting Assistance
Auvik introduces Aurora Troubleshooting Assistance with AI-powered troubleshooting guidance, possible root causes, conversation downloads, and feedback tools. The open beta helps IT teams diagnose network issues faster with contextual recommendations tailored to specific devices and alerts. For more information, visit Auvik's official site.
 .
.
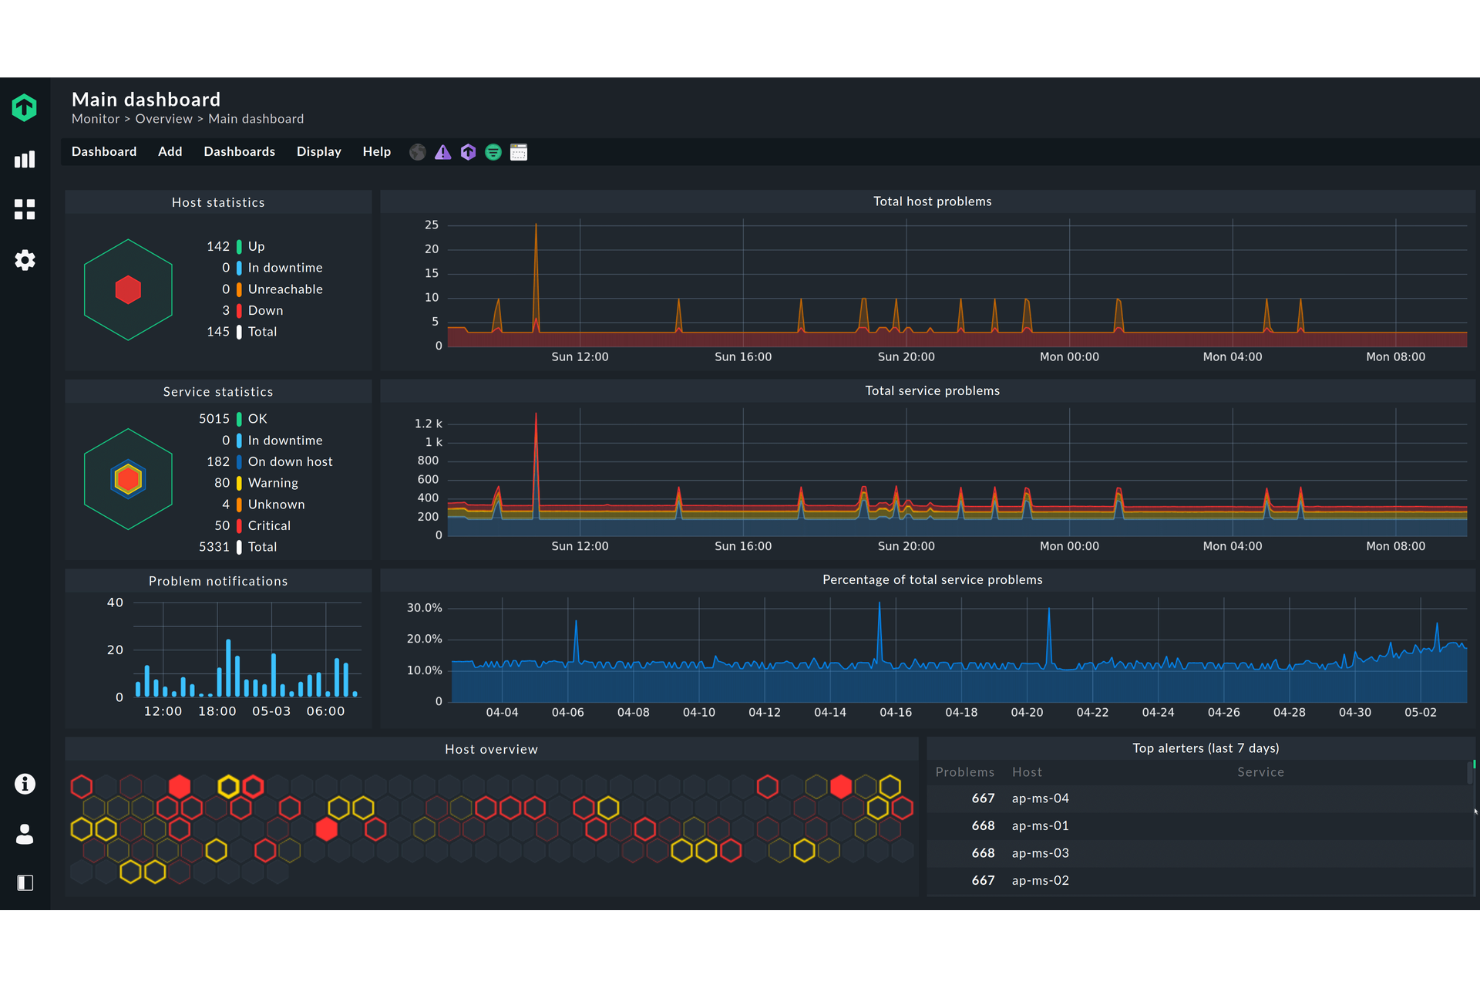
Icinga is a monitoring platform built for IT teams and system administrators who need deep visibility into server health, network performance, and infrastructure status across complex environments.
Who Is Icinga Best For?
Icinga is a strong fit for mid-to-large IT teams that need a highly customizable, open-source monitoring solution they can adapt to complex, multi-environment infrastructure.
Why I Picked Icinga
Icinga earns its spot on my shortlist because it's one of the few genuinely open-source server monitoring platforms that doesn't water down its feature set to push you toward a paid tier. I like how Icinga's check execution engine lets my team define custom monitoring logic using any scripting language, so we're not locked into predefined check templates. The Icinga Director module is particularly useful—it gives us a web-based configuration interface for managing hosts, services, and notifications at scale without touching config files directly. For teams running hybrid or on-premises infrastructure, that level of control is hard to replicate in a closed-source tool.
Icinga Key Features
- Distributed monitoring: Deploy satellite zones to monitor remote networks and data centers from a central Icinga instance.
- Alerting and escalation rules: Configure notification workflows that route alerts to the right team members based on severity and time windows.
- Icinga DB: A high-performance backend that stores and processes monitoring data for fast querying and reporting.
- Graphing and visualization: Integrate with tools like Grafana to display real-time performance metrics and historical server data.
Icinga Integrations
Icinga offers native integrations with Grafana, Jira, Slack, PagerDuty, ServiceNow, InfluxDB, Elasticsearch, Graylog, and has an API for custom integrations.
Pros and Cons
Pros:
- Highly customizable for various IT infrastructure needs
- Scalable for both small and large environments
- Free to use with no setup fees
Cons:
- Setup and configuration comes with a learning curve
- Occasional performance issues reported during high-load scenario
New Product Updates from Icinga
Icinga Adds OpenTelemetry Support
Icinga introduces OpenTelemetry metrics support, HTTP response streaming, and key system updates. These improvements enhance performance, scalability, and integration with modern monitoring tools. For more information, visit Icinga’s official site.
 .
.
ManageEngine OpManager is a network and server monitoring platform built for IT teams and system administrators who need to track server health, performance, and uptime across complex infrastructures.
Who Is ManageEngine OpManager Best For?
ManageEngine OpManager is well-suited to mid-size and large IT teams that manage distributed server environments and need centralized visibility.
Why I Picked ManageEngine OpManager
ManageEngine OpManager earns its spot on my shortlist because of how thoroughly it covers continuous server tracking—monitoring intervals can go as low as 30 seconds, and real-time "heartbeat" monitors can run at 1-second intervals for mission-critical resources. It tracks over 300 dedicated performance metrics across 130+ server vendors, from CPU and memory utilization to disk latency and deadlocks per second. The ML-powered adaptive thresholds are a genuine differentiator—OpManager learns what "normal" looks like for each metric and automatically adjusts alarm thresholds every hour, reducing false positives. This continuous, self-calibrating visibility is hard to replicate with manual threshold configuration.
ManageEngine OpManager Key Features
- Server log monitoring: Tracks Windows event logs, syslogs, and application logs for Exchange, IIS, and MS SQL servers, with rule-based alerting for specific log events.
- Automated workflow builder: Uses a drag-and-drop, code-free interface with 70+ actions to build sequential remediation workflows that can restart services or spin up VMs automatically.
- 3D data center floor views: Lets you map server racks and datacenter floors in 2D or 3D, with real-time device status overlaid on the physical layout.
- Storage capacity forecasting: Analyzes historical and current usage trends to generate reports predicting future storage utilization before capacity issues arise.
ManageEngine OpManager Integrations
ManageEngine OpManager offers native integrations with ServiceDesk Plus, AlarmsOne, Analytics Plus, Applications Manager, NetFlow Analyzer, Network Configuration Manager, and has native integrations across the Microsoft ecosystem, including Microsoft 365 and Azure. An API is available for custom integrations.
Pros and Cons
Pros:
- Scalability for growing networks
- Real-time alerting
- Comprehensive monitoring capabilities
Cons:
- Occasional update issues
- Complex initial setup
New Product Updates from ManageEngine OpManager
ManageEngine OpManager Vendor Templates and NCM XML Import
ManageEngine OpManager introduces enhanced vendor template integration and device template import for the NCM module using XML files. This update helps teams improve device classification and speed up configuration workflows. For more information, visit ManageEngine OpManager’s official site.
 .
.
Checkmk is a monitoring platform built for IT teams and enterprises that need to track server health, performance, and availability across complex, distributed environments.
Who Is Checkmk Best For?
Checkmk is a strong fit for mid-to-large enterprises and managed service providers running extensive server infrastructure across on-premises, cloud, or hybrid environments.
Why I Picked Checkmk
Checkmk earns its spot on my shortlist because of how well it handles large-scale server monitoring without buckling under the weight of complex infrastructure. I particularly like its distributed monitoring architecture, which lets my team scale across hundreds of sites and monitor millions of devices from a single setup. The auto-discovery feature is useful—it detects hosts and services automatically, so onboarding new servers doesn't require manual configuration at every step. The rule-based 1-to-N configuration lets me apply monitoring rules across thousands of hosts at once, rather than configuring each one individually.
Checkmk Key Features
- Predictive monitoring: Uses historical data and algorithms to dynamically adjust thresholds and forecast future resource consumption before issues occur.
- Log monitoring: Collects and filters events from syslog, SNMP traps, Windows event logs, and log files, collapsing duplicate entries to reduce alert noise.
- Agent Bakery: Centrally manages and automates agent deployment and updates across hosts, reducing manual overhead for large server fleets.
- Hardware and software inventory: Automatically identifies and tracks all hardware and software assets, monitoring changes and integrating data into your CMDB view.
Checkmk Integrations
Checkmk offers 20+ native integrations, including ServiceNow, Jira, Grafana, Nagios, Prometheus, VMware vSphere, AWS, Azure, Google Cloud Platform, Slack, and Zapier. An API is available for custom integrations.
Pros and Cons
Pros:
- REST API for integration with third-party tools
- Customizable dashboards
- Scalable monitoring
Cons:
- Potential learning curve for beginners
- Complex setup

PRTG is a monitoring platform built for IT teams and system administrators who need to keep servers, networks, and infrastructure running smoothly with customizable dashboards, automated alerts, and support for a wide range of protocols.
Who Is PRTG Best For?
PRTG is a strong fit for mid-size to large IT teams managing complex, multi-device environments who need centralized visibility across servers, networks, and applications.
Why I Picked PRTG
I picked PRTG as one of the best for real-time server monitoring because of how granular and immediate its sensor-based monitoring is. Each sensor tracks a single measured value—CPU load, memory usage, disk space—and you can configure the scanning interval per sensor, so you're getting live data at whatever cadence your environment demands. PRTG's alerting goes beyond simple up/down notifications: you can set threshold triggers that fire before a server hits a critical state, which means my team can catch a disk filling up or a memory spike before it causes an outage. The AI-driven anomaly detection adds another layer by adapting baselines to your environment automatically, so alerts stay relevant rather than noisy.
PRTG Key Features
- Distributed monitoring: Monitor multiple remote locations from a single dashboard using probes that communicate via TLS encryption.
- Customizable reporting: Build and schedule reports using custom templates to share infrastructure status with stakeholders.
- Maps and dashboards: Design real-time network maps with live status information using the drag-and-drop map designer.
- Mobile app access: Monitor your environment on the go using PRTG's native apps for iOS and Android.
PRTG Integrations
PRTG offers native integrations with Amazon CloudWatch, VMware vSphere, Microsoft Azure, Google Cloud Platform, Cisco, Dell EMC, HPE, NetApp, and has native integrations across the Microsoft ecosystem, including Microsoft 365 and Azure. An API is available for custom integrations.
Pros and Cons
Pros:
- User-friendly visual interface
- Customizable monitoring and alerting
- Scalable for a wide range of network sizes
Cons:
- More advanced features may come with a learning curve
- High costs for larger deployments
New Product Updates from PRTG
PRTG Introduces New Monitoring Sensors In Beta
This week, PRTG introduces three BETA sensors that broaden your monitoring scope for Proxmox VE clusters and SIMATIC S7-300/400 PLCs, giving you deeper operational insights. For more information, visit PRTG’s official site.
 .
.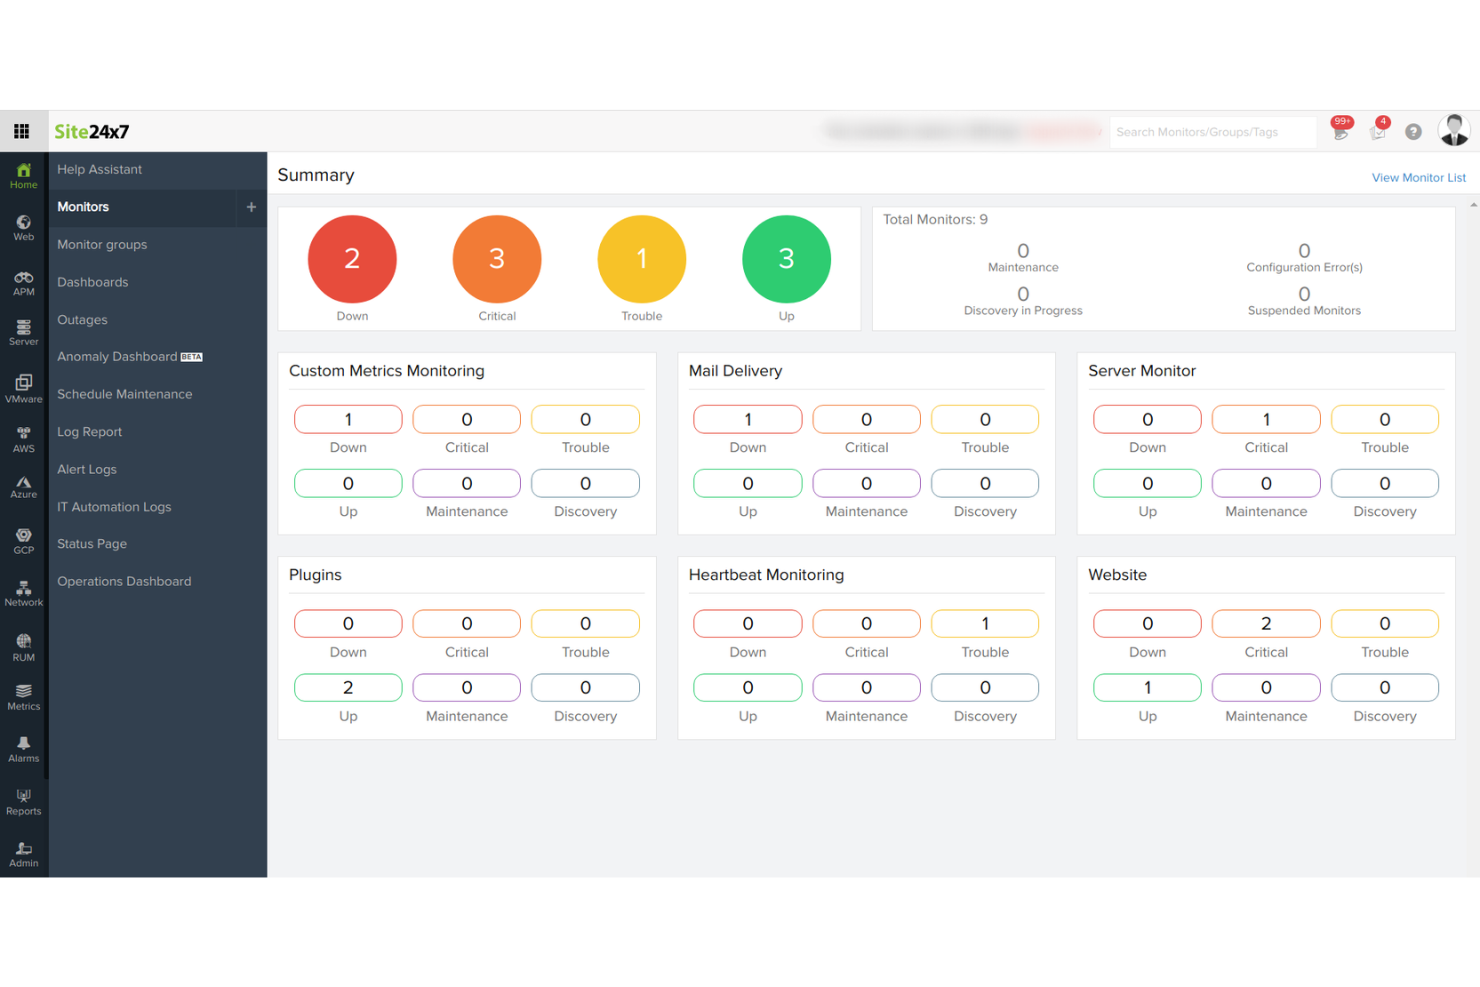
Site24x7 gives IT teams and managed service providers a unified platform to monitor server health, performance, and uptime across cloud and on-premises environments, helping you catch issues before they impact users.
Who Is Site24x7 Best For?
Site24x7 is a good fit for IT teams and MSPs that manage mixed infrastructure environments and need a single tool to monitor servers, applications, and networks together.
Why I Picked Site24x7
Site24x7 earns its spot on my shortlist because of how deep it goes on server metric tracking. I can monitor CPU usage, memory, disk I/O, network throughput, and running processes all from a single dashboard—without needing to stitch together separate tools. I also like the process monitoring feature, which lets me track specific services and get alerted the moment one stops responding. Site24x7's server monitoring reports give me historical performance data I use to spot trends before they turn into incidents.
Site24x7 Key Features
- AI-powered anomaly detection: Site24x7 uses machine learning to flag unusual server behavior and forecast performance degradation before it causes an outage.
- Log management: Collect, search, and analyze server log data directly within the platform to correlate log events with performance metrics.
- VMware and container monitoring: Track VMware ESX/ESXi hosts, Docker containers, and Kubernetes clusters alongside physical servers from one console.
- Customizable alerting: Set threshold-based or anomaly-triggered alerts with escalation policies to route notifications to the right team members.
Site24x7 Integrations
Site24x7 offers 100+ native integrations, including AWS, Azure, Google Cloud Platform, Microsoft Teams, Slack, PagerDuty, Jira, ServiceNow, Opsgenie, Datadog, and Zapier. An API is available for custom integrations.
Pros and Cons
Pros:
- Customizable dashboards and reports
- Real-time alerts and notifications
- Comprehensive monitoring capabilities
Cons:
- Limited customization in alerting mechanisms
- Complexity in initial setup for large environments
New Product Updates from Site24x7
Site24x7 Adds Synchronization Statuses for MSPs
Site24x7 now provides MSPs enhanced alerts and synchronization statuses in a centralized notification center to spot configuration sync issues sooner and accelerate incident response. For more information, visit Site24x7's official site.


Dynatrace gives IT teams and enterprises a unified platform to monitor server health, analyze infrastructure performance, and pinpoint issues across complex cloud and hybrid environments.
Who Is Dynatrace Best For?
Dynatrace is a strong fit for large enterprises and DevOps teams managing complex, multi-cloud or hybrid infrastructures who need deep visibility across their full technology stack.
Why I Picked Dynatrace
Dynatrace earns its spot on my shortlist because of how its Davis AI engine handles root cause analysis. Instead of surfacing a flood of alerts for my team to sort through, Davis automatically pinpoints the exact source of a performance issue—down to the code level—before users are even impacted. I also like the Smartscape dependency graph, which gives a real-time map of how services, processes, and hosts connect, so when an application slows down, I can see exactly which upstream or downstream component is responsible. That combination of causal AI and live topology mapping makes it genuinely different from tools that just collect metrics and leave the diagnosis to you.
Dynatrace Key Features
- OneAgent deployment: A single agent installs on any host and automatically collects metrics, logs, traces, and topology data across your full stack without manual configuration.
- Log monitoring with Grail: Dynatrace's Grail data lakehouse ingests and stores logs in context with traces and metrics, so you can query across all data types without managing schemas or storage tiers.
- AutomationEngine: Connects with incident management and remediation tools to trigger auto-remediation workflows, automatic ticketing, and real-time CMDB updates when issues are detected.
- OpenPipeline: A high-performance stream processing layer that ingests, enriches, and contextualizes data from any source before it reaches storage or analytics.
Dynatrace Integrations
Dynatrace offers 650+ native integrations, including ServiceNow, AWS, Azure, Google Cloud Platform, Kubernetes, VMware, Red Hat OpenShift, Slack, PagerDuty, Jira, and Zapier. An API is available for custom integrations and automation.
Pros and Cons
Pros:
- A wide array of integrations
- Comprehensive application monitoring
- Deep AI-driven insights
Cons:
- The setup might be challenging for novices
- Complexity requires dedicated training

Sentry gives IT teams and developers real-time visibility into server-side errors and performance issues, helping you identify, diagnose, and resolve problems across distributed systems and cloud environments.
Who Is Sentry Best For?
Sentry is a strong fit for engineering and DevOps teams building and maintaining complex, multi-service applications who need deep visibility into errors and performance at the code level.
Why I Picked Sentry
I picked Sentry as one of the best because its distributed tracing goes deeper than most monitoring tools. Where other platforms show you that something is slow, Sentry's Trace Explorer lets you follow a single request across every service, database call, and API hop—so you can pinpoint the exact span causing a latency spike without jumping between tools. I also like how errors and traces are connected in the same view, meaning when a background job fails, I can see what triggered it upstream. Seer—Sentry's AI debugging agent—analyzes stack traces, logs, replays, and trace data together to automatically root-cause issues and even suggest a fix.
Sentry Key Features
- Real-time error monitoring: Captures and groups exceptions as they occur across your server-side applications, with full stack traces and contextual data attached to each issue.
- Performance monitoring: Tracks transaction throughput, latency percentiles, and slow database queries to surface bottlenecks in backend services.
- Session replay: Records user sessions so you can reproduce the exact conditions that led to a server-side error or crash.
- Custom alerting: Lets you configure threshold- or anomaly-based alerts on error rates, latency, and performance metrics across specific projects or environments.
Sentry Integrations
Sentry offers 100+ native integrations, including GitHub, GitLab, Jira, Slack, Trello, PagerDuty, Datadog, AWS, Azure DevOps, Google Cloud Platform, and Zapier. An API is available for custom integrations and automation with CI/CD workflows.
Pros and Cons
Pros:
- Strong error tracking with per-user exception tracking
- Comprehensive monitoring, including performance and crash reporting
- Effective frontend observability with session replay features
Cons:
- Less coverage for infrastructure-level monitoring
- Complex implementation especially for diverse platform stacks
New Product Updates from Sentry

Sentry Adds Log Export in CSV and JSONL
Sentry now supports exporting up to 10,000 log lines from Explore → Logs in CSV or JSON Lines, with downloads available in-browser or as background downloads and email. For more information, visit Sentry's official site.
 .
.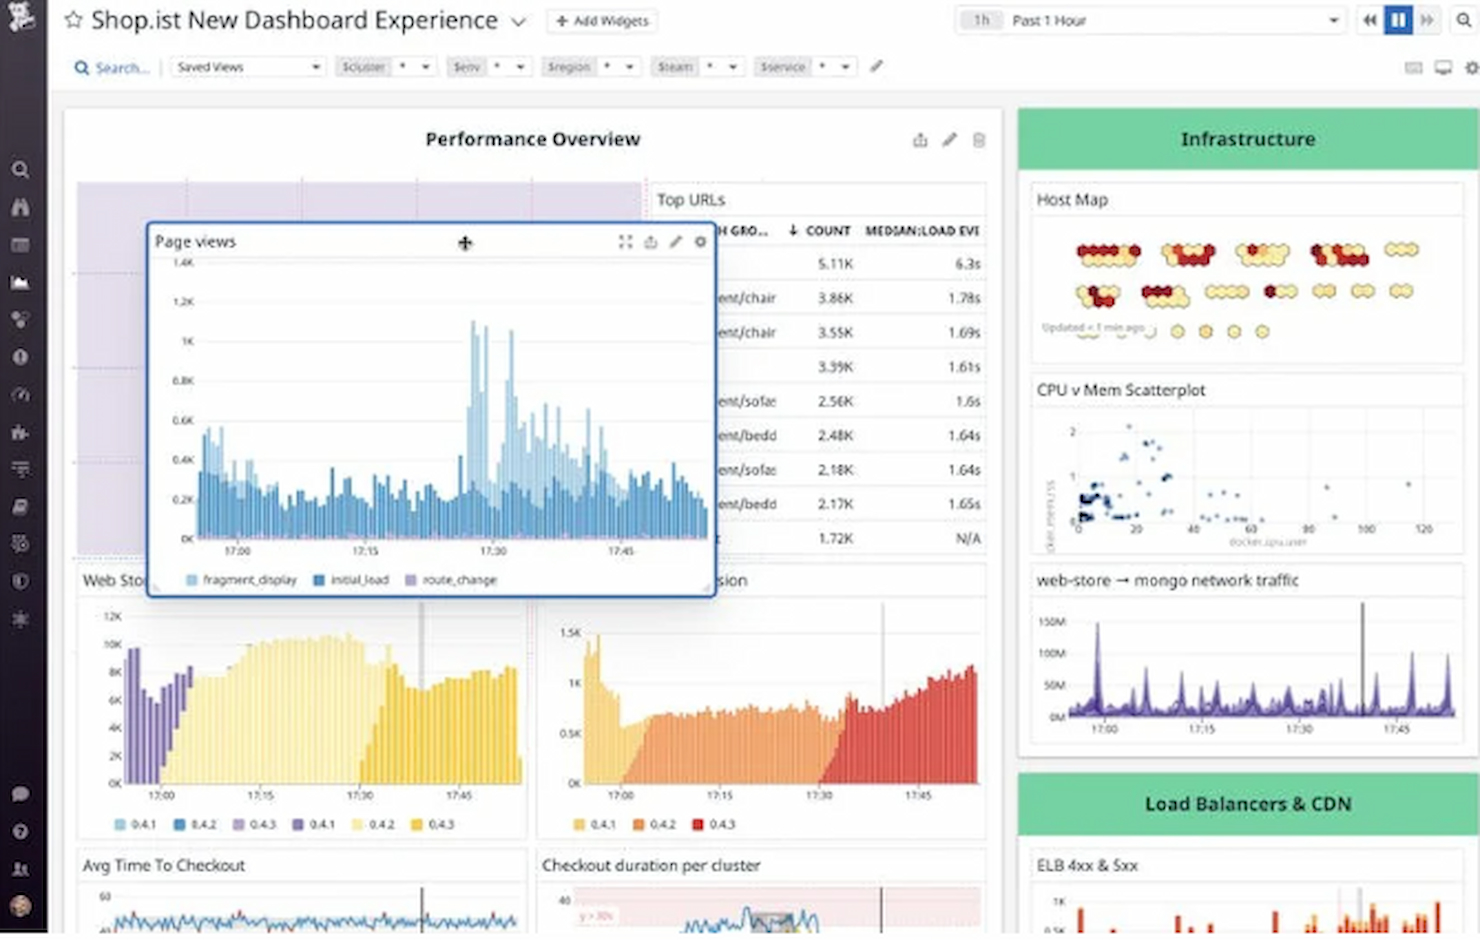
Datadog gives IT teams and DevOps professionals a unified platform to monitor server health, track performance metrics, and troubleshoot issues across complex cloud and hybrid environments.
Who Is Datadog Best For?
Datadog is a strong fit for mid-size to enterprise engineering teams running cloud-native or hybrid infrastructure at scale.
Why I Picked Datadog
Datadog earns its spot on my shortlist because of how well it handles monitoring at cloud scale, where the sheer volume of hosts, containers, and services makes most tools buckle. I like that it tracks tens of thousands of infrastructure metrics out of the box, with continuous historical records that persist even after infrastructure is decommissioned—something that's genuinely useful when you're doing post-incident analysis on ephemeral cloud resources. I also use the tag-based search and analytics to slice across multi-cloud environments without writing complex queries, which saves real time when you're managing hundreds of hosts across AWS, Azure, and GCP simultaneously. The AIOps-driven alert correlation is another feature I rely on heavily—it surfaces the signal from the noise instead of flooding on-call engineers with redundant alerts.
Datadog Key Features
- Live process monitoring: View real-time CPU, memory, and I/O consumption at the individual process level across all your hosts.
- Network performance monitoring: Track request volume, latency, and errors between services and infrastructure components across your environment.
- Log management: Collect, parse, and search logs from servers and services, with the ability to correlate them directly with metrics and traces.
- Custom dashboards: Build visualizations that combine metrics, logs, and traces from across your infrastructure into a single view.
Datadog Integrations
Datadog offers 600+ native integrations, including AWS, Azure, Google Cloud Platform, Kubernetes, Docker, Slack, PagerDuty, Jira, GitHub, ServiceNow, and Zapier. An API is available for custom integrations.
Pros and Cons
Pros:
- Extensive integrations list
- Comprehensive monitoring and alerting
- Tailored for cloud environments
Cons:
- Additional costs for extra features
- The learning curve for advanced features
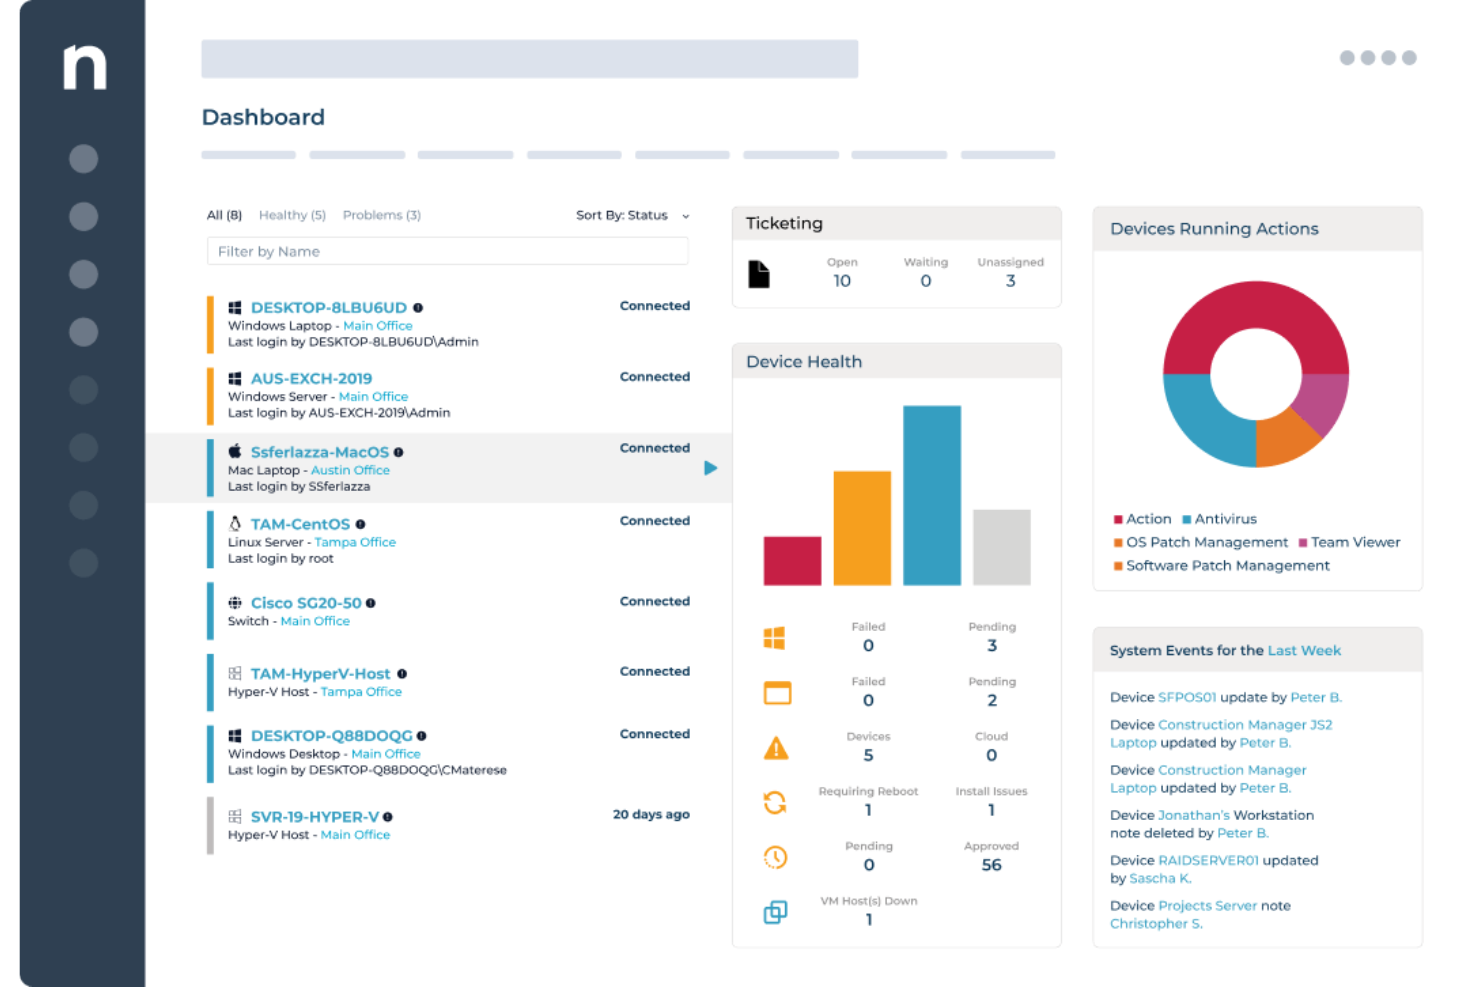
NinjaOne gives IT teams and managed service providers a unified platform to monitor servers, automate patching, and manage endpoints across distributed environments, helping reduce downtime and simplify infrastructure oversight.
Who Is NinjaOne Best For?
NinjaOne is a strong fit for MSPs and internal IT teams managing large fleets of servers and endpoints across multiple locations or client environments.
Why I Picked NinjaOne
I picked NinjaOne as one of the best because its patch management handles the full compliance lifecycle, not just deployment. The Patch Intelligence feature analyzes telemetry and deployment signals to automatically flag unstable updates and pause risky patches before they cause disruption. You can set device-role-based patching policies so servers running different workloads are patched on different schedules without manual intervention. Additionally, the patch compliance reporting gives a clear, on-demand view of what's been patched, what hasn't, and where vulnerabilities lie across every endpoint.
NinjaOne Key Features
- Real-time endpoint monitoring: View device health, configurations, and compliance status across all endpoints from a single cloud-native console.
- Automated endpoint remediation: Use condition-based scripting to detect and fix endpoint issues automatically without technician intervention.
- Software and OS deployment: Roll out Windows software, updates, and configurations across endpoints using repeatable, automation-driven workflows.
- Hardware and software inventory: Get a live view of every device in your environment, including hardware specs, installed software, and warranty status.
NinjaOne Integrations
NinjaOne offers native integrations with ConnectWise, Autotask, Zendesk, Webroot, Bitdefender, TeamViewer, Splashtop, Acronis, and the Microsoft ecosystem, including Microsoft 365 and Azure. An API is available for custom integrations.
Pros and Cons
Pros:
- Automated endpoint discovery
- Flexible reporting with custom metrics
- Comprehensive API documentation
Cons:
- Complexity in setting up alerts for non-standard events
- Occasional delays in patch deployment
New Product Updates from NinjaOne
NinjaOne Adds Windows Agent Deployment to Network Discovery
NinjaOne adds Windows agent deployment directly from Network Discovery. This update helps IT teams move from discovering unmanaged Windows devices to monitoring, patching, and managing them faster. For more information, visit NinjaOne’s official site.
 .
.Otras herramientas de monitoreo de servidores
Aquí tienes algunas opciones adicionales de herramientas de monitoreo de servidores que no entraron en mi selección, pero que aún vale la pena revisar:
- Nagios
For comprehensive IT infrastructure monitoring
- LogicMonitor
For hybrid infrastructure monitoring
- AppDynamics
For end-to-end business transaction tracking
- New Relic
For real-time application analytics
- Dotcom Monitor
For simulating real user interactions
- Sumo Logic
Good for log management and analysis
- Atera
Good for integrated RMM and PSA solution
- Zabbix
For scalability with large networks
- WhatsUp Gold
Good for network monitoring and visualization
- Netdata
Good for real-time performance troubleshooting
- Prometheus
For powerful query language capabilities
- Sensu
Good for flexible monitoring via plugins
- ManageEngine
For integrated IT management


How I Evaluate Server Monitoring Software
I evaluate server monitoring tools in two layers: baseline capabilities—like sub-minute polling and hybrid coverage—that qualify a tool, and differentiators that determine the best fit.
Core Functionality (Table Stakes For This List)
When I'm selecting tools for my list, I rank each one on a scale from 0 (does not offer the functionality) to 5 (excels in this area) for each core functionality listed below. Then, I calculate the tool's total score into a percentage. Each tool needs to achieve a minimum total score of 75% to be considered for inclusion.
- Real-Time Resource Monitoring: I check how granularly each tool tracks CPU, memory, disk I/O, and network throughput, and whether polling intervals are fast enough to catch brief spikes.
- Multi-OS & Environment Support: A tool should cover Windows, Linux, and Unix hosts across on-prem, virtual, and cloud environments so hybrid fleets don't require separate solutions.
- Alerting & Notification Options: I evaluate whether thresholds are customizable per metric and whether alerts route to channels teams actually use, like Slack, PagerDuty, or email.
- Uptime & Availability Checks: Consistent ping, HTTP, and TCP checks with downtime logging matter here, especially for teams tracking SLA commitments across customer-facing services.
- Historical Data & Reporting: I look at retention depth and whether dashboards support trend analysis for capacity planning, like spotting a disk volume that's been filling steadily over months.
- Agent & Agentless Collection: Flexible deployment options matter. Some environments can't run agents on legacy hosts, so support for SNMP, WMI, SSH, or API-based polling is important.
Once I have a list of tools that meet this criteria, I consider what sets each platform apart.
Differentiating Factors (What Sets Vendors Apart)
Here's how I compare and contrast different vendors:
Standout Features
Auto-discovery and dependency mapping save serious time when you're onboarding hundreds of servers. I look for tools that detect new hosts and visualize how services connect. Root cause analysis builds on that by correlating events across the stack, so you're fixing the actual problem instead of chasing symptoms during an outage. For teams running containerized workloads, native Kubernetes and Docker monitoring alongside traditional server metrics keeps everything in one place.
Beyond Features
Pricing structure matters a lot here. Per-host, per-metric, and data-ingestion models scale very differently, and surprise overages can hit hard when you're monitoring thousands of endpoints. I also evaluate integration depth with incident management and ITSM platforms like ServiceNow and PagerDuty, since monitoring data only helps if it feeds directly into your response workflows. Deployment flexibility is another factor I consider, especially for teams in regulated environments that need self-hosted options alongside cloud convenience.
Cómo elegir herramientas de monitoreo de servidores
Es fácil perderse entre largas listas de funciones y estructuras de precios complicadas. Para ayudarte a mantener el enfoque durante tu proceso único de selección de software, aquí tienes una lista de factores a tener en cuenta:
| Factor | Qué considerar |
| Escalabilidad | Asegúrate de que la herramienta pueda crecer junto con tu empresa. Busca software de monitoreo empresarial capaz de manejar más datos y usuarios sin perder rendimiento, especialmente si estás en etapa de expansión. |
| Integraciones | Verifica la compatibilidad con tus sistemas actuales. La herramienta debe integrarse fácilmente con tu pila de software existente, como AWS, Azure o Slack, para ahorrar tiempo y esfuerzo. |
| Personalización | Elige herramientas que permitan personalizar paneles y reportes. Esto garantiza que tu equipo reciba los análisis específicos que necesita sin información innecesaria. |
| Facilidad de uso | Evalúa la interfaz para determinar su nivel de intuición. Tu equipo debe navegarla sin dificultad, reduciendo la curva de aprendizaje y acelerando la adopción. |
| Presupuesto | Compara los planes de precios para que se ajusten a tus limitaciones financieras. Considera el costo total, incluidos cargos ocultos o complementos necesarios, para evitar sobrepasar tu presupuesto. |
| Salvaguardas de seguridad | Da prioridad a herramientas con sólidas medidas de seguridad. Asegúrate de que ofrezcan cifrado de datos, controles de acceso y cumplimiento con estándares de la industria para proteger la información sensible. |
| Fiabilidad | Busca garantías comprobadas de disponibilidad. Una herramienta fiable permite monitoreo continuo sin interrupciones frecuentes, manteniendo tus operaciones fluidas. |
| Opciones de soporte | Considera tanto la disponibilidad como la calidad del soporte al cliente. El acceso a asistencia 24/7, gestores de cuenta dedicados y recursos de ayuda completos es fundamental. |
Tendencias en herramientas de monitoreo de servidores
En mi investigación, consulté innumerables actualizaciones de productos, notas de prensa y registros de versiones de diversos proveedores de herramientas de monitoreo de servidores. Aquí tienes algunas de las tendencias emergentes a las que presto atención:
- Información impulsada por IA: Muchas herramientas ahora utilizan inteligencia artificial para ofrecer análisis predictivos, ayudándote a anticipar problemas antes de que ocurran. Esta tendencia está haciendo el monitoreo más proactivo, con proveedores alternativos a Nagios como Dynatrace incorporando IA para alertas y diagnósticos más inteligentes.
- Visibilidad de pila completa: Los usuarios buscan visibilidad en toda su infraestructura tecnológica, no solo en los servidores. Herramientas como New Relic están ampliándose para ofrecer información sobre aplicaciones, infraestructura y la experiencia de usuario todo en un solo lugar, proporcionando una visión holística.
- Visualización de datos en tiempo real: A medida que los datos aumentan, la necesidad de visualización en tiempo real se vuelve clave. Los proveedores mejoran los paneles para mostrar flujos de datos en vivo, permitiendo que los equipos reaccionen instantáneamente a los cambios en sus entornos.
- Monitoreo nativo en la nube: Con más empresas trasladándose a la nube, las herramientas de monitoreo están evolucionando para soportar arquitecturas nativas de la nube. Soluciones como Datadog ofrecen funciones diseñadas específicamente para entornos en la nube, garantizando compatibilidad y eficiencia.
- Monitoreo de seguridad mejorado: La seguridad es una preocupación creciente y las herramientas ahora ofrecen funciones de seguridad más avanzadas. Las soluciones de monitoreo están integrando detección de amenazas y comprobaciones de cumplimiento para proteger los datos, respondiendo a la demanda de los usuarios por sistemas más seguros.
¿Qué son las herramientas de monitoreo de servidores?
Las herramientas de monitoreo de servidores rastrean continuamente el estado y el rendimiento del servidor—CPU, memoria, disco, I/O, procesos, servicios y red—para que los equipos de IT y DevOps puedan detectar problemas temprano, resolver incidentes más rápido y mantener acuerdos de nivel de servicio (SLO) en entornos locales, en la nube e híbridos.
Las alertas en tiempo real, los indicadores de rendimiento y las capacidades de visualización de datos ayudan a una monitorización proactiva y una rápida resolución de problemas, de forma similar a cómo las herramientas de monitoreo de sitios web rastrean el tiempo de actividad y el rendimiento.
Características de las herramientas de monitoreo de servidores
Al seleccionar herramientas de monitoreo de servidores, presta atención a las siguientes funciones clave:
- Monitoreo en tiempo real: Obtén actualizaciones instantáneas sobre el estado y el rendimiento de tu servidor. El monitoreo en tiempo real te permite detectar problemas en el momento en que ocurren, para que puedas intervenir y solucionarlos antes de que se conviertan en grandes inconvenientes.
- Alertas automatizadas: Recibe notificaciones por correo electrónico, SMS o alertas en el panel de control cuando tus servidores alcanzan los umbrales establecidos para CPU, memoria, espacio en disco u otras métricas. No tendrás que supervisar manualmente tus servidores; el sistema te avisará cuando sea momento de actuar.
- Seguimiento del uso de recursos: Supervisa estadísticas detalladas como la utilización de CPU, consumo de memoria, actividad de disco y tráfico de red en todos tus servidores. Esto te ayuda a tomar decisiones más inteligentes sobre actualizaciones, escalabilidad o balanceo de carga.
- Datos históricos e informes: Accede a registros e informes que registran el rendimiento del servidor a lo largo del tiempo. Revisar tendencias históricas te ayuda a identificar problemas recurrentes o momentos en los que podrías necesitar mayor capacidad en el servidor.
- Tableros personalizables: Personaliza tu panel de monitoreo para mostrar la información que más te interesa. Los widgets de arrastrar y soltar te permiten visualizar métricas clave y obtener una visión general adaptada a tu flujo de trabajo.
- Monitoreo de procesos y servicios: Mantén bajo control procesos o servicios específicos que se ejecutan en tus servidores. Sabrás de inmediato si alguna tarea crítica deja de funcionar, para que puedas restablecer todo rápidamente.
- Compatibilidad multiplataforma: Supervisa servidores sin importar su sistema operativo, ya sea Windows, Linux o macOS. Puedes gestionar entornos mixtos sin cambiar de herramientas.
- Integración con sistemas de notificación: Conecta tu herramienta de monitoreo con aplicaciones de colaboración como Slack o sistemas de tickets. Esto evita correos electrónicos innecesarios y ayuda a tu equipo a actuar rápido cuando algo requiere atención.
- Seguridad y controles de acceso: Controla quién puede ver o modificar las configuraciones de tu monitoreo. Las sólidas funciones de seguridad te ayudan a prevenir cambios no autorizados y mantener protegida la información sensible del servidor.
- Escalabilidad: Añade fácilmente nuevos servidores y servicios a medida que crece tu negocio. Esto garantiza que tu solución de monitoreo se adapte a tus crecientes necesidades sin perder el ritmo.
Funciones comunes de IA en herramientas de monitoreo de servidores
Las herramientas de monitoreo de servidores modernas suelen aprovechar la inteligencia artificial para mejorar el rendimiento y simplificar la gestión. Aquí tienes algunas funciones impulsadas por IA que debes buscar:
- Detección de anomalías: Los algoritmos de IA identifican automáticamente patrones inusuales o desviaciones en el rendimiento del servidor, ayudándote a detectar problemas antes de que escalen.
- Analítica predictiva: Los modelos de aprendizaje automático predicen posibles fallas del servidor o escasez de recursos, lo que te permite tomar medidas preventivas y minimizar tiempos de inactividad.
- Análisis automatizado de causa raíz: La IA localiza rápidamente el origen de los problemas de rendimiento, reduciendo el tiempo y el esfuerzo necesarios para la resolución de incidencias.
- Alertas inteligentes: Los sistemas inteligentes minimizan los falsos positivos aprendiendo el comportamiento normal de tu servidor y solo te notifican cuando algo realmente requiere atención.
- Planificación de capacidad: La IA analiza las tendencias de uso para recomendar la asignación óptima de recursos y estrategias de escalado, asegurando que tus servidores puedan afrontar demandas futuras.
- Automatización auto-sanadora: Algunas herramientas usan IA para resolver automáticamente problemas comunes, como reiniciar servicios o reasignar recursos, sin intervención humana.
- Umbrales de monitoreo adaptativos: La IA ajusta dinámicamente los umbrales de alertas según los datos históricos y los patrones de uso, manteniendo las notificaciones relevantes conforme evoluciona tu entorno.
Beneficios
Implementar herramientas de monitoreo de servidores proporciona varios beneficios para tu equipo y tu negocio. Aquí tienes algunos que puedes esperar:
- Resolución proactiva de problemas: Las alertas en tiempo real y la analítica predictiva permiten que tu equipo aborde los problemas antes de que escalen, reduciendo el tiempo de inactividad.
- Rendimiento mejorado: El monitoreo de las métricas de desempeño ayuda a mantener operaciones óptimas del servidor, mejorando la eficiencia general.
- Toma de decisiones informada: Los tableros personalizables y los informes automatizados ofrecen información útil para guiar las decisiones estratégicas de tu equipo.
- Mayor seguridad: Las funciones de monitoreo de seguridad detectan amenazas y aseguran el cumplimiento, protegiendo tus datos de posibles brechas.
- Soporte de escalabilidad: Las herramientas diseñadas para escalar crecen junto con tu negocio, adaptándose sin inconvenientes a mayores volúmenes de datos y usuarios.
- Visibilidad integral: La observabilidad de pila completa proporciona a tu equipo una vista completa de tu infraestructura, mejorando las capacidades de monitoreo.
Costos y precios
Seleccionar herramientas de monitorización de servidores requiere comprender los distintos modelos y planes de precios disponibles. Los costos varían según las características, el tamaño del equipo, los complementos y más. La siguiente tabla resume los planes comunes, sus precios promedio y las características típicas incluidas en las soluciones de herramientas de monitorización de servidores:
Tabla comparativa de planes para herramientas de monitorización de servidores
| Tipo de plan | Precio promedio | Características comunes |
| Plan gratuito | $0 | Monitorización básica, paneles limitados y alertas estándar. |
| Plan personal | $5-$25/usuario/mes | Métricas de rendimiento, paneles personalizables e informes básicos. |
| Plan empresarial | $30-$75/usuario/mes | Análisis avanzados, alertas en tiempo real y capacidades de integración. |
| Plan corporativo | $100-$300/usuario/mes | Observabilidad de pila completa, análisis predictivo y soporte dedicado. |
Preguntas frecuentes sobre herramientas de monitoreo de servidores
Aquí tienes algunas respuestas a preguntas comunes sobre las herramientas de monitoreo de servidores:
¿Por qué es importante el seguimiento de inventario en ciberseguridad?
El seguimiento de inventario es fundamental para la ciberseguridad porque te ayuda a identificar, monitorear y gestionar cada dispositivo y activo de software en tu entorno de TI. Con un inventario completo, puedes detectar dispositivos no autorizados, rastrear vulnerabilidades y asegurar que el software cumpla con las normativas. Un seguimiento preciso ayuda a reducir violaciones de datos al resaltar brechas de seguridad o de gestión de parches y te proporciona una visión clara para auditorías y respuesta ante incidentes.
¿Cómo puede el software de gestión de inventario de TI ayudar en auditorías de cumplimiento?
El software de gestión de inventario de TI facilita las auditorías de cumplimiento al mantener registros precisos de todo el hardware y software. Puedes generar reportes rápidamente, rastrear historiales de activos y demostrar detalles de licencias o configuraciones cuando se requiera. La documentación automatizada y los registros de cambios te ayudan a estar preparado para auditorías, reducir el papeleo manual y simplificar las revisiones regulatorias.
¿Qué integraciones debo buscar en las herramientas de gestión de inventario de TI?
Busca herramientas de inventario de TI que se integren con tus sistemas existentes como software de mesa de ayuda, bases de datos de gestión de configuraciones (CMDB), software de servidores de aplicaciones y soluciones de gestión de endpoints. Las integraciones con herramientas de seguridad, servicios de directorio y proveedores de la nube simplifican los flujos de trabajo y aseguran que tus datos de inventario estén actualizados en toda tu infraestructura de TI. Las herramientas de monitoreo de servidores supervisan continuamente la salud y el rendimiento del servidor—CPU, memoria, disco, E/S, procesos, servicios y red—de modo que los equipos de TI y DevOps pueden detectar problemas de forma temprana, resolver incidentes más rápido y mantener los SLO en entornos locales, en la nube o híbridos.
¿Cómo apoyan estas herramientas los entornos de trabajo remoto o híbrido?
La mayoría de las plataformas modernas de gestión de inventario de TI ofrecen acceso en la nube, instalación remota de agentes y sincronización en tiempo real. Puedes monitorear dispositivos en cualquier lugar—ya sea en casa o en diferentes oficinas—rastrear hardware asignado a trabajadores remotos y automatizar actualizaciones. Esto reduce los puntos ciegos y te permite responder más rápido a los problemas, sin importar dónde esté tu equipo.
¿Qué funciones ayudan a reducir la pérdida o el robo de hardware?
Muchas herramientas de gestión de inventario de TI ofrecen etiquetado de activos, geolocalización, registros de entrega/recepción y alertas para actividades inusuales. Estas funciones te permiten rastrear la asignación de dispositivos, registrar movimientos y recuperar hardware perdido más rápido. También puedes configurar recordatorios automáticos para devoluciones o mantenimientos, minimizando el riesgo de pérdida o robo.
¿Cómo funciona el descubrimiento automático de activos en las plataformas modernas de gestión de inventario?
El descubrimiento automático de activos escanea tu red para encontrar todos los dispositivos conectados y el software instalado. El sistema actualiza continuamente tu inventario, detecta activos nuevos o no autorizados y te ayuda a mantener una base de datos precisa de activos. Esto ahorra tiempo, mejora la seguridad y reduce los errores de seguimiento manual.
¿Qué sigue?
Si estás investigando software de monitoreo de servidores, conéctate con un asesor de SoftwareSelect para recibir recomendaciones gratuitas.
Completa un formulario y programa una charla para compartir los detalles de tus necesidades. Recibirás una lista seleccionada de software para revisar y soporte durante todo el proceso de compra, incluidas las negociaciones de precios.