10 Best Enterprise Monitoring Software Of 2026

10 Best Enterprise Monitoring Software Shortlist


Managing your enterprise's IT infrastructure can be overwhelming. You're juggling system performance, security, and compliance, all while ensuring everything runs smoothly. That's where enterprise monitoring software comes in.
In my experience, these tools are essential for maintaining operational efficiency and identifying potential issues before they escalate. They help your team stay on top of network performance and system health without constant manual oversight.
I've reviewed the top enterprise monitoring solutions on the market, providing an unbiased look at their features, pros, and cons. In this article, you'll find insights to help you choose the best software for your needs, ensuring your systems are always in check.
Why Trust Our Software Reviews
We’ve been testing and reviewing software since 2023. As tech leaders ourselves, we know how critical and difficult it is to make the right decision when selecting software.
We invest in deep research to help our audience make better software purchasing decisions. We’ve tested more than 2,000 tools for different tech use cases and written over 1,000 comprehensive software reviews. Learn how we stay transparent & our software review methodology.
Best Enterprise Monitoring Software Summary
This comparison chart summarizes pricing details for my top enterprise monitoring software selections to help you find the best one for your budget and business needs.
| Tool | Best For | Trial Info | Price | ||
|---|---|---|---|---|---|
| 1 | Best for diversified network monitoring | Free demo available | From $245/25 devices | Website | |
| 2 | Best for MSPs and internal IT teams | 30-day free trial + free demo available | From $129/technician/month (billed annually) | Website | |
| 3 | Best for open-source solution | Free plan available | Pricing upon request | Website | |
| 4 | Best for scalability and adaptability | Free plan + 30-day free trial available | From $275/month (billed annually) | Website | |
| 5 | Best for diverse tech monitoring | 30-day free trial | From $179/month (billed annually) | Website | |
| 6 | Best for data-driven decisions | 60-day free trial | Pricing upon request | Website | |
| 7 | Best for tailored enterprise solutions | 14-day free trial + free demo available | From $0.05/GB | Website | |
| 8 | Best for SaaS-based performance | Free 15-day trial | From $16/hybrid unit/month | Website | |
| 9 | Best for business performance insights | Free trial available | Pricing upon request | Website | |
| 10 | Best for comprehensive reporting analytics | Not available | From $45/user/month (billed annually) + $150 base fee per month | Website |

-

TestDevLab
Visit Website -
Site24x7
Visit WebsiteThis is an aggregated rating for this tool including ratings from Crozdesk users and ratings from other sites.4.7 -
GitHub Actions
Visit WebsiteThis is an aggregated rating for this tool including ratings from Crozdesk users and ratings from other sites.4.8


Best Enterprise Monitoring Software Reviews
Below are my detailed summaries of the best enterprise monitoring software that made it onto my shortlist. My reviews offer a detailed look at the key features, pros & cons, integrations, and ideal use cases of each tool to help you find the best one for you.

ManageEngine OpManager is a proficient enterprise monitoring software tailored for a wide spectrum of network monitoring requirements. With its extensive features, it addresses the challenges of monitoring diversified networks, reinforcing its position as a top choice.
Why I Picked ManageEngine OpManager:
Choosing the right tool for diversified network monitoring wasn't straightforward, but ManageEngine OpManager differentiated itself with its comprehensive feature set. Comparing its offerings and judging its capabilities in relation to other contenders, it became evident that its approach to infrastructure monitoring software is both diverse and robust.
Hence, I am of the opinion that it's the "best for diversified network monitoring".
Standout Features and Integrations:
ManageEngine OpManager boasts exceptional virtualization monitoring tools and efficient DNS tracking, ensuring that every aspect of a network is under surveillance. Furthermore, it employs advanced techniques to swiftly detect and mitigate potential downtime scenarios.
In terms of integrations, OpManager smoothly collaborates with a plethora of IT management solutions, making it versatile for various infrastructure setups.
Pros and Cons
Pros:
- Wide range of integrations augments its utility for complex setups
- Advanced virtualization and DNS tracking ensure network reliability
- Comprehensive monitoring tools catering to diverse network requirements
Cons:
- Initial setup and customization can be time-consuming
- The interface may seem complex for users unfamiliar with network monitoring
- Lack of transparent pricing may deter some organizations
New Product Updates from ManageEngine OpManager
ManageEngine OpManager Vendor Templates and NCM XML Import
ManageEngine OpManager introduces enhanced vendor template integration and device template import for the NCM module using XML files. This update helps teams improve device classification and speed up configuration workflows. For more information, visit ManageEngine OpManager’s official site.
 .
.
For those seeking an enterprise monitoring software solution, Atera offers a comprehensive approach to IT infrastructure management, tailored for managed service providers (MSPs) and internal IT teams. Its all-in-one platform integrates remote monitoring and management (RMM), patch management, and operational automation, addressing the need for efficient oversight and control over IT operations.
Why I Picked Atera
I picked Atera for its unique ability to integrate remote monitoring and management (RMM) with patch management and operational automation, making it a great option for enterprise monitoring. The platform's AI capabilities automate IT operations, providing real-time insights and improving efficiency. Additionally, Atera's comprehensive help desk services and ticketing systems support seamless IT management, catering to the specific needs of MSPs and IT teams.
Atera Key Features
In addition to its core functionalities, Atera offers several features that enhance its utility as an enterprise monitoring solution.
- Server Monitoring: The platform tracks server health continuously, sends real-time alerts if metrics exceed thresholds, and offers detailed analytics on performance and utilization.
- Asset & Inventory Scanning: Devices are auto-discovered (including network hardware via SNMP) and inventoried, giving you visibility into what’s connected and where.
- AI Copilot (Generative IT Assistance): Atera’s AI Copilot can generate scripts, CLI commands and summaries of sessions, helping technicians accelerate diagnostics and responses.
- Reporting & Analytics: You can schedule automated reports (system health, patch status, software inventory, technician performance, customer satisfaction).
Atera Integrations
Integrations include Bitdefender, Acronis, Webroot, Splashtop, TeamViewer, AnyDesk, QuickBooks, Xero, FreshBooks, and Stripe.
Pros and Cons
Pros:
- Threshold alerts and remote maintenance tools reduce response time for device incidents.
- Built-in asset and software inventory gives visibility into hardware and software deployments.
- Consolidates IT management into a single platform, simplifying operations.
Cons:
- Project management and complex SLA tracking are relatively limited.
- Less granular control for highly complex custom workflows or integrations.
New Product Updates from Atera

Atera Adds SNMP Scanning and AI-Powered Monitoring Updates
Atera has added dedicated SNMP scanning, AI-powered monitoring, and improved scan controls to simplify device management. These updates help teams discover devices and configure network monitoring faster. For more information, visit Atera’s official site.

Icinga is an open‑source monitoring system that continuously checks the availability and performance of your network resources, servers, and applications.
Why I Picked Icinga:
I picked Icinga because of its robust infrastructure monitoring capabilities. It allows you to keep tabs on servers, networks, Kubernetes, databases, and more, providing you with the necessary insights to manage complex IT environments. It also provides agent‑based monitoring, which allows you to deploy lightweight agents on your servers to gather CPU, memory, process, and other system metrics locally.
Standout Features and Integrations:
Other important features include support for cluster‑aware monitoring zones, where checks are distributed across geographic or segmented zones and results are sent to parent nodes for centralized handling. Icinga also includes detailed logging and monitoring health indicators via multiple log backends (file, syslog, journald, Windows event log).
Some of Icinga's integrations include Grafana, AWS, Azure, Puppet, Ansible, Chef, Terraform, Jira, PagerDuty, ServiceNow, BigPanda, and Stackstorm.
Pros and Cons
Pros:
- Highly customizable for various IT infrastructure needs
- Scalable for both small and large environments
- Free to use with no setup fees
Cons:
- Setup and configuration comes with a learning curve
- Occasional performance issues reported during high-load scenarios
New Product Updates from Icinga
Icinga Adds OpenTelemetry Support
Icinga introduces OpenTelemetry metrics support, HTTP response streaming, and key system updates. These improvements enhance performance, scalability, and integration with modern monitoring tools. For more information, visit Icinga’s official site.
 .
.
Checkmk stands as a formidable enterprise monitoring software, well-equipped to monitor a range of IT components, from servers to applications. Its distinctive edge lies in its ability to scale and adapt, making it particularly apt for growing or evolving businesses.
Why I Picked Checkmk:
While sifting through myriad monitoring platforms, Checkmk caught my eye due to its fluidity in scalability and adaptability. My decision to choose it emerged from its prowess to adapt to the demands of diverse IT infrastructures while maintaining consistent performance. Based on my judgment after comparing it with its counterparts, I concluded it is "best for scalability and adaptability."
Standout Features and Integrations:
Checkmk boasts a suite of standout features including intuitive server monitoring, dynamic thresholds, and advanced troubleshooting tools. Its user-friendly interface ensures even complex tasks become more manageable.
Integration-wise, Checkmk collaborates effortlessly with Solarwinds, offers SMS notifications, and possesses plugins to integrate with a vast array of network devices, further improving its monitoring capabilities.
Pros and Cons
Pros:
- Broad range of plugins for diversified network monitoring
- Advanced troubleshooting tools for quick problem resolution
- Offers extensive scalability options
Cons:
- Price point might be prohibitive for smaller enterprises
- Certain advanced features require a steeper learning curve
- Interface might be daunting for novices

PRTG Enterprise Monitor is a comprehensive monitoring solution designed to oversee large-scale IT infrastructures. It enables you to monitor your entire IT environment, including business services and service level agreements (SLAs), ensuring optimal performance and availability.
Why I Picked PRTG:
PRTG supports a diverse range of technologies and protocols, enabling you to monitor various systems and devices within your infrastructure. I especially like its automatic network discovery feature, which streamlines the initial setup by detecting and configuring devices within your network. Furthermore, PRTG offers real-time alerts through various channels, such as email and push notifications, ensuring that you're promptly informed of any issues that may arise.
Standout Features and Integrations:
Another key feature of PRTG Enterprise Monitor is its centralized overview, allowing you to manage multiple PRTG installations through a single interface. This unified view simplifies the monitoring process across extensive and distributed networks, making it easier to identify and address issues promptly. PRTG also offers distributed monitoring across unlimited remote locations, customizable reports that integrate only the information you need, and multiple user interfaces for web, desktop, and mobile access.
Integrations include AWS, Cisco, Dell Technologies, HPE, VMware, ServiceNow, Check Point, Sonicwall, NetApp, Fujitsu, Lansweeper, and Martello.
Pros and Cons
Pros:
- Provides a comprehensive overview of network infrastructure
- Customizable dashboards and real-time alerts
- Supports multiple monitoring technologies
Cons:
- Initial setup can be time-consuming
- Licensing based on sensors can become expensive for larger networks
New Product Updates from PRTG
PRTG Introduces New Monitoring Sensors In Beta
This week, PRTG introduces three BETA sensors that broaden your monitoring scope for Proxmox VE clusters and SIMATIC S7-300/400 PLCs, giving you deeper operational insights. For more information, visit PRTG’s official site.
 .
.
Splunk Enterprise stands as a pivotal enterprise monitoring software, primarily centered on analyzing large volumes of machine-generated data. This tool is crafted for businesses intent on harnessing data insights to drive better decisions.
Why I Picked Splunk Enterprise:
Selecting Splunk Enterprise was based on its unparalleled capability to turn data into actionable insights, a vital asset in today's data-centric era. In comparing it with other tools, Splunk's data analytics prowess undeniably stood out. Its proficiency in enabling data-driven decisions underscored its designation as "best for data-driven decisions".
Standout Features and Integrations:
Splunk Enterprise is endowed with robust APM tools and an impressive suite of add-ons, ensuring deep data analytics and infrastructure monitoring. Its features are tailored to prevent downtime and ensure smooth operations. Integration-wise, Splunk interfaces with several DevOps tools and supports WMI configurations for improved monitoring.
Pros and Cons
Pros:
- Supports a wide range of integrations, bolstering its versatility
- Varied add-ons for customized monitoring experiences
- Stellar data analytics features for robust insights
Cons:
- Some users might find the interface less intuitive compared to competitors
- Lack of transparent pricing could deter potential users
- The vast array of features may be intimidating for newcomers
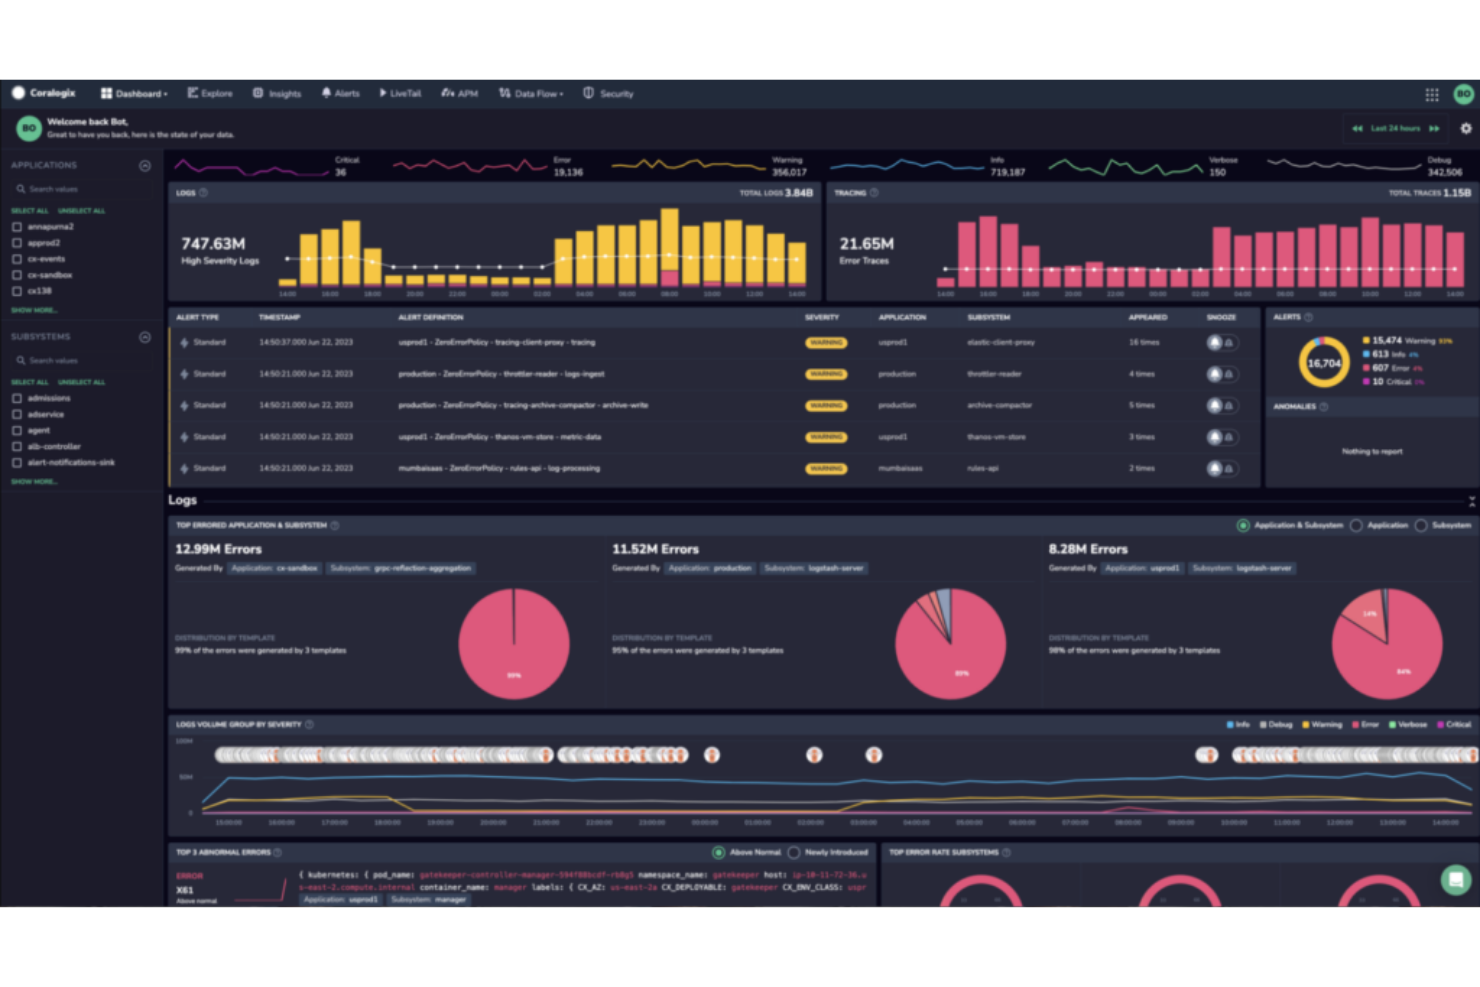
Coralogix offers an enterprise monitoring platform, adept at crafting solutions to specifically fit the intricate needs of large-scale businesses. Its unique approach to tailoring solutions makes it an exemplary choice for customized IT infrastructure monitoring.
Why I Picked Coralogix:
In my exploration of enterprise monitoring software, Coralogix distinctly stood out. What caught my attention and led to my selecting it for this list was its innate ability to adapt and mold its services based on individual enterprise demands.
Its bespoke solutions and its ability to go beyond generic offerings is why I determined it's "best for tailored enterprise solutions."
Standout Features and Integrations:
One of the standout features of Coralogix is its profound automation capabilities which ease the workflow. With its cutting-edge server monitoring and dynamic thresholds, it offers a user-friendly experience even in complex enterprise environments. For integrations, Coralogix collaborates efficiently with platforms like Solarwinds, and Slack for notifications, and offers plugins to connect with various network devices, ensuring smooth monitoring.
Pros and Cons
Pros:
- Extensive plugins for diversified network devices
- Tailored solutions for varied enterprise demands
- Powerful automation for streamlined processes
Cons:
- Learning curve for understanding all features
- Pricing could be a barrier for startups
- Might be overkill for very small businesses

LogicMonitor, a renowned enterprise monitoring software, provides comprehensive monitoring for IT infrastructures, primarily focusing on SaaS applications. Its capabilities are instrumental in ensuring the stellar performance of SaaS-based platforms, making it an industry favorite.
Why I Picked LogicMonitor:
When determining the right tools, LogicMonitor quickly caught my attention due to its specialization in SaaS-based monitoring. Its distinct approach to SaaS performance and comparisons with other tools confirmed my judgment of its superior capability in this niche. This is why I opine that it truly stands as the "best for SaaS-based performance".
Standout Features and Integrations:
LogicMonitor is fortified with intuitive APM tools and virtualization monitoring capabilities, ensuring that SaaS platforms run at their peak. Its advanced alerting system aids in quickly pinpointing and resolving potential issues, preventing unwanted downtime.
Regarding integrations, LogicMonitor connects with numerous DevOps tools and offers a range of add-ons, improving its utility across diverse IT environments.
Pros and Cons
Pros:
- Advanced alerting system ensures prompt issue resolution
- Broad range of integrations supports diverse IT environments
- Specialized SaaS-based monitoring provides targeted insights
Cons:
- Some features might be overkill for smaller organizations
- Absence of transparent pricing can be a hurdle for potential adopters
- The interface might pose a learning curve for some users

AppDynamics offers a holistic perspective on IT infrastructure, focusing on the intersection between technology and business. Tailored for those prioritizing business performance insights, this tool meticulously bridges the gap between technical metrics and their real-world implications on business processes.
Why I Picked AppDynamics:
Among the myriad of enterprise monitoring software I've examined, AppDynamics resonated with its unique approach to merging business and technology perspectives. I chose this platform not just for its comprehensive infrastructure monitoring capabilities but primarily for its ability to contextualize technical data in terms of business impact.
This made it a clear winner when determining the best tool for gaining deep business performance insights.
Standout Features and Integrations:
AppDynamics shines with its application performance monitoring, real-time data collection, and root cause analysis functionalities. These features, coupled with its powerful API integrations, allow a more holistic view of business processes.
As for integrations, AppDynamics works with key platforms like AWS, Azure, and Microsoft, ensuring that users have extensive observability over their IT ecosystems.
Pros and Cons
Pros:
- Effective root cause analysis tools
- Robust integration with major cloud providers
- Comprehensive application monitoring
Cons:
- Limited support for open-source tools
- Pricier base fee compared to some competitors
- Steeper learning curve for newcomers

Netreo serves as a pivot for organizations, focusing intently on delivering precise, in-depth analytics on their network's health and performance. Its edge in comprehensive reporting analytics truly transforms how enterprises perceive and act on their network data.
Why I Picked Netreo:
In my journey of comparing and judging various enterprise monitoring software, Netreo emerged as a clear front-runner, particularly in the domain of reporting. The depth and clarity of its analytics were unparalleled.
I determined that for those enterprises yearning for meticulous, detailed reporting, Netreo was the optimal choice. It's this specific expertise in analytics that makes it "best for comprehensive reporting analytics."
Standout Features and Integrations:
Netreo prides itself on its advanced network performance monitoring and real-time alerting capabilities. The tool's ability to provide granular insights into every facet of an enterprise's IT infrastructure is commendable.
Integration-wise, Netreo boasts strong ties with platforms like Microsoft, Cisco, and SNMP, which amplifies its monitoring potential by allowing a more interconnected view of various system components.
Pros and Cons
Pros:
- Robust integrations with leading platforms
- Detailed real-time notifications
- Advanced infrastructure monitoring tools
Cons:
- Limited open-source tool support
- Priced slightly higher for small enterprises
- Initial setup can be complex for some users
Other Enterprise Monitoring Software
Here are some additional enterprise monitoring software options that didn’t make it onto my shortlist, but are still worth checking out:
- IBM Instana
For application performance management
- Grafana Enterprise
For visualization capabilities
- SolarWinds Observability SaaS
For integrating AIOps with machine learning
- BMC TrueSight Operations Management
For integrated IT ops
- Site24x7
For holistic enterprise monitoring
- Datadog
For cloud infrastructure monitoring
- Dynatrace
Good for AI-driven full-stack monitoring
- Zabbix
Good for open-source infrastructure visibility
- Prometheus
Good for time-series data metrics
- Sensu
Good for multi-cloud monitoring
- Pandora FMS
Good for flexibility across platforms
- ScienceLogic
Good for discovery and dependency mapping
- Micro Focus Operations Bridge
Good for automating IT operations


How I Evaluate Enterprise Monitoring Software
I evaluate these tools in two layers: baseline must-haves—full-stack visibility, alerting, and RBAC—and the differentiators like AIOps, deployment flexibility, and TCO that determine the right fit.
Core Functionality (Table Stakes For This List)
When I'm selecting tools for my list, I rank each one on a scale from 0 (does not offer the functionality) to 5 (excels in this area) for each core functionality listed below. Then, I calculate the tool's total score into a percentage. Each tool needs to achieve a minimum total score of 75% to be considered for inclusion.
- Full-Stack Observability: I check whether a platform can monitor infrastructure, applications, networks, databases, and cloud services from one unified view across hybrid and multi-cloud environments.
- Real-Time Alerting & Incident Management: Configurable alert thresholds, anomaly detection, and routing to tools like PagerDuty or ServiceNow are what I evaluate here.
- Metrics, Logs & Traces Correlation: The ability to cross-reference all three observability pillars matters—especially when you're tracking a latency spike from a trace back through logs to a host metric.
- Enterprise Scalability & High Availability: I look at how well the platform handles high-volume telemetry across thousands of hosts with redundancy, horizontal scaling, and multi-region support.
- Custom Dashboards & Reporting: Teams need dashboards they can tailor to their stack and reports they can share with stakeholders for SLA tracking, capacity planning, and executive summaries.
- Enterprise Security & Compliance: I evaluate RBAC, SSO/SAML support, audit logging, data encryption, and compliance certifications like SOC 2, ISO 27001, HIPAA, and GDPR.
Once I have a list of tools that meet this criteria, I consider what sets each platform apart.
Differentiating Factors (What Sets Vendors Apart)
Here's how I compare and contrast different vendors:
Standout Features
AIOps capabilities are a big differentiator. I look for platforms that use ML to reduce alert noise and surface root causes, not just flag threshold breaches. Auto-discovery and topology mapping also matter, especially when your environment shifts daily with scaling events and deployments. For teams running containerized workloads, native Kubernetes observability—pod-level metrics, cluster health, service mesh tracing—separates the tools built for modern stacks from those retrofitted for them.
Beyond Features
I pay close attention to the integration ecosystem—specifically, OpenTelemetry support and native connections to ITSM and CI/CD tools your team already uses. Vendor lock-in is a real risk in this space. Total cost of ownership also weighs heavily; ingestion-based pricing can spiral fast once you start monitoring thousands of hosts. Deployment flexibility rounds out my evaluation. Some enterprises need on-premise or hybrid options for regulated workloads, so I check whether a platform can meet those requirements without sacrificing functionality.
How to Choose Enterprise Monitoring Software
It’s easy to get bogged down in long feature lists and complex pricing structures. To help you stay focused as you work through your unique software selection process, here’s a checklist of factors to keep in mind:
| Factor | What to Consider |
|---|---|
| Scalability | Can the software grow with your organization? Consider the number of devices and users it supports. Look for solutions that can handle increased loads without performance drops. |
| Integrations | Does it work with your existing tools? Check for compatibility with your current systems and platforms. Missing integrations can lead to inefficiencies. |
| Customizability | Can you tailor the software to fit your workflows? Look for options that allow for custom alerts, dashboards, and reports. |
| Ease of use | Is the software intuitive for your team? Evaluate the learning curve and whether it requires extensive training. A complex interface can slow down adoption. |
| Implementation and onboarding | How long will it take to get started? Consider the time and resources needed for setup and training. Look for vendors offering strong support and resources during this phase. |
| Cost | Does it fit your budget? Compare pricing models and hidden costs like add-ons or support fees. Ensure the value aligns with your financial constraints. |
| Security safeguards | How does it protect your data? Evaluate its encryption methods, access controls, and compliance with industry standards. Security lapses can lead to serious consequences. |
| Support availability | When can you reach out for help? Consider the availability of customer support and the channels offered. Ensure there's timely assistance if issues arise. |
What Is Enterprise Monitoring Software?
Enterprise monitoring software is a tool that tracks the performance and health of IT systems across an organization. IT professionals, network administrators, and system engineers typically use these tools to ensure systems run smoothly and efficiently. Monitoring, alerting, and reporting capabilities help with identifying issues, maintaining uptime, and optimizing resource use. Overall, these tools provide peace of mind by ensuring systems are reliable and efficient.
Features
When selecting enterprise hardware monitoring software, keep an eye out for the following key features:
- Monitoring and alerting: Continuously track system performance and receive alerts for any unusual activity or potential issues, helping maintain uptime.
- Reporting and analytics: Generate detailed reports and analytics to understand system health and performance trends, aiding in informed decision-making.
- Integration capabilities: Connect with existing tools and platforms to ensure seamless operation across various systems and improve workflow efficiency.
- Customizable dashboards: Tailor dashboards to display the most relevant information for your team, enhancing usability and focus.
- Predictive analytics: Use data and trends to anticipate potential issues before they occur, minimizing downtime.
- Security monitoring: Monitor and safeguard against unauthorized access and threats, ensuring data protection and compliance.
- Scalability: Adapt to growing organizational needs by accommodating more devices and users without compromising performance.
- Ease of use: Offer an intuitive interface that simplifies navigation and requires minimal training, promoting quick adoption.
- Automated reporting: Schedule regular reports to be generated and distributed automatically, saving time and effort.
- Multi-cloud support: Manage and monitor resources across different cloud environments, providing flexibility and control.
Benefits
Implementing enterprise monitoring software provides several benefits for your team and your business. Here are a few you can look forward to:
- Improved uptime: By receiving alerts and monitoring system performance, you can address issues quickly and keep systems running smoothly.
- Informed decision-making: Reporting and analytics provide insights into system health, helping you make data-driven decisions.
- Enhanced security: Continuous security monitoring helps protect against unauthorized access and threats, ensuring compliance and data protection.
- Cost savings: Predictive analytics and automated reporting help identify inefficiencies, allowing you to optimize resources and reduce costs.
- Customizable insights: Tailored dashboards and reports ensure your team focuses on the most relevant data, improving productivity.
- Scalability: As your organization grows, scalable solutions accommodate more devices and users without sacrificing performance.
- Ease of adoption: An intuitive interface reduces the learning curve, making it easier for your team to adopt and benefit from the software.
Costs & Pricing
Selecting enterprise monitoring software requires an understanding of the various pricing models and plans available. Costs vary based on features, team size, add-ons, and more. The table below summarizes common plans, their average prices, and typical features included in enterprise monitoring software solutions:
Plan Comparison Table for Enterprise Monitoring Software
| Plan Type | Average Price | Common Features |
|---|---|---|
| Free Plan | $0 | Basic monitoring, limited alerts, and community support. |
| Personal Plan | $5-$25/user/month | Monitoring and alerts, basic reporting, and email support. |
| Business Plan | $30-$75/user/month | Advanced monitoring, detailed analytics, integrations, and phone support. |
| Enterprise Plan | $100+/user/month | Custom dashboards, predictive analytics, priority support, and security features. |
Enterprise Monitoring Software FAQs
Here are some answers to common questions about enterprise monitoring software:
How do I evaluate enterprise monitoring tools for scalability and performance?
Start by testing the software with your current infrastructure and projecting future needs. Look for monitoring tools that easily handle growing data volumes and offer high-availability architecture. Check for real-time analytics, distributed deployment options, and clear benchmarks for scaling. Ask vendors for references from companies of similar size or complexity to yours.
What are common integration challenges with enterprise monitoring software?
Integrations can be challenging when dealing with legacy systems, diverse cloud providers, or custom applications. You may run into problems with data silos, lack of APIs, or incompatible protocols. To avoid headaches, choose a monitoring platform with flexible integration capabilities, robust APIs, and proven connectors for your core infrastructure.
How can I ensure data security and compliance with enterprise monitoring platforms?
Make sure you review the platform’s security certifications and compliance features before deployment. Look for support for encryption, user access controls, and audit trails. Confirm the vendor follows industry standards like SOC 2 or ISO 27001 and check if they support your region’s compliance needs, such as GDPR or HIPAA.
What’s the best approach for migrating from legacy monitoring systems?
Start by mapping out all critical monitoring requirements and identifying gaps in your current setup. Run the new and legacy systems in parallel during the transition to ensure data consistency and continuity. Plan for staged migration, thorough testing, and provide training for your ops team to minimize disruption.
How can enterprise monitoring tools improve incident response and reduce downtime?
Enterprise monitoring solutions provide real-time alerts, automated root cause analysis, and unified dashboards. This lets your team spot issues quickly and act before they snowball. Setting up custom alerts, escalation processes, and integrating monitoring with incident management tools can further shorten resolution times.
What’s Next:
If you're in the process of researching enterprise monitoring software, connect with a SoftwareSelect advisor for free recommendations.
You fill out a form and have a quick chat where they get into the specifics of your needs. Then you'll get a shortlist of software to review. They'll even support you through the entire buying process, including price negotiations.