10 Mejores Software de Monitoreo de Redes Analizados para 2026

Mejor lista corta de software de monitoreo de red


Gestionar una red puede ser complicado. Tienes que ocuparte de varios dispositivos, mantener la seguridad de los datos y asegurarte de que todo funcione sin problemas. El software de monitoreo de red puede ayudarte con estos desafíos al ofrecerte información y alertas, permitiendo que tu equipo se enfoque en lo que realmente importa.
He probado y revisado muchas de estas herramientas para ofrecerte una visión imparcial de las mejores opciones disponibles. En este artículo, encontrarás una revisión detallada del mejor software de monitoreo de red que puede adaptarse a las necesidades de tu equipo.
Creo en ofrecer información bien investigada y confiable para que puedas tomar decisiones informadas. Vamos a profundizar en qué hace destacar a estas herramientas y cómo pueden ayudar a tu equipo a tener éxito.
Table of Contents
- Mejor Lista de Software
- Por Qué Confiar en Nosotros
- Comparar Especificaciones
- Reseñas
- Otras Opciones de Software de Monitoreo de Redes
- Otras Reseñas Relacionadas
- Criterios de Selección
- Cómo Elegir
- ¿Qué es el Software de Monitoreo de Redes?
- Características
- Beneficios
- Costos y Precios
- Preguntas Frecuentes
Por qué confiar en nuestras reseñas de software
Llevamos probando y revisando software desde 2023. Como líderes tecnológicos, sabemos lo crítico y difícil que es tomar la decisión correcta al seleccionar software.
Invertimos en una investigación profunda para ayudar a nuestra audiencia a tomar mejores decisiones de compra de software. Hemos probado más de 2,000 herramientas para diferentes casos de uso tecnológicos y escrito más de 1,000 reseñas de software exhaustivas. Descubre cómo mantenemos la transparencia y nuestra metodología de revisión de software.
Resumen del mejor monitoreo de red
| Tool | Best For | Trial Info | Price | ||
|---|---|---|---|---|---|
| 1 | Best for visual representations of networks | 14-day free trial + free demo available | Pricing upon request | Website | |
| 2 | Best for network visibility and device discovery | 30-day free trial + free demo available | From $129/technician/month (billed annually) | Website | |
| 3 | Best for multi-vendor network monitoring | Free demo available | From $245/25 devices | Website | |
| 4 | Best open-source solution | Free plan available | Pricing upon request | Website | |
| 5 | Best for scalable IT monitoring | Free plan + 30-day free trial available | From $275/month (billed annually) | Website | |
| 6 | Best for unified MSP management | 21-day free trial + free demo available | From $149/technician/month (billed annually) | Website | |
| 7 | Best for DNS security and threat prevention | Free trial + free demo available | Pricing upon request | Website | |
| 8 | Best for comprehensive device coverage | 30-day free trial + free demo available | From $10/month (billed annually) | Website | |
| 9 | Best for proactive network issue prevention | 30-day free trial | From $179/month (billed annually) | Website | |
| 10 | Best for network monitoring in complex environments | Free trial available | From $7/host/month | Website |

-

TestDevLab
Visit Website -
Site24x7
Visit WebsiteThis is an aggregated rating for this tool including ratings from Crozdesk users and ratings from other sites.4.7 -
GitHub Actions
Visit WebsiteThis is an aggregated rating for this tool including ratings from Crozdesk users and ratings from other sites.4.8


Reseñas del mejor software de monitoreo de red
Aquí encontrarás mis elecciones para el mejor software y herramientas de monitoreo de red:

Auvik gives IT teams and managed service providers a cloud-based platform to automatically discover, map, and monitor complex networks, helping them identify issues and maintain reliable infrastructure.
Who Is Auvik Best For?
Auvik is a strong fit for managed service providers and in-house IT teams that need to monitor and manage multi-site or multi-client network environments.
Why I Picked Auvik
Auvik earns its spot as one of the best on my shortlist because of how its automated network topology maps work in practice. The moment you install a collector, Auvik draws your network map from scratch—every switch, firewall, router, and IP-connected device appears with its Layer 1, 2, and 3 connections visible. I love that the map updates in real time as your network changes, so you're never working from a stale diagram when you're trying to trace an issue. On top of that, the path analysis feature lets you trace the route between any two devices and see alerts and performance data overlaid directly on that path, which makes root cause analysis much faster than jumping between separate tools.
Auvik Key Features
- Automated configuration backup: Auvik automatically backs up device configurations and lets you compare versions side-by-side to spot unauthorized changes.
- 64+ preconfigured alerts: Auvik ships with a library of pre-built alerts that surface directly on your live network map from day one, with no manual setup required.
- Multi-tenant dashboard: A centralized dashboard gives you real-time visibility across all sites and client environments from a single pane of glass.
- Network traffic analysis: Auvik monitors bandwidth usage, application flows, and geo data at the interface level so you can pinpoint performance bottlenecks.
Auvik Integrations
Integrations include ConnectWise, Autotask, ServiceNow, Slack, Microsoft Teams, Cisco Meraki, VMware, Palo Alto Networks, Fortinet, and an open API for custom integrations.
Pros and Cons
Pros:
- Quick and accurate alerting system
- Single dashboard monitoring
- Detailed visual graphical representation of networks
Cons:
- Could use more integrations
- Customizing the platform can be time consuming
New Product Updates from Auvik
Auvik Adds Aurora Troubleshooting Assistance
Auvik introduces Aurora Troubleshooting Assistance with AI-powered troubleshooting guidance, possible root causes, conversation downloads, and feedback tools. The open beta helps IT teams diagnose network issues faster with contextual recommendations tailored to specific devices and alerts. For more information, visit Auvik's official site.
 .
.
For network administrators and IT professionals seeking to monitor and manage their networks, Atera offers a comprehensive solution. It is tailored for managed service providers and IT departments aiming to oversee multiple networks with ease. It addresses challenges like device discovery and network visibility, ensuring you can maintain a robust network infrastructure.
Who Is Atera Best For?
IT generalists and MSPs in small to mid-sized businesses serving distributed clients. It supports teams that need network visibility and automated device discovery within a unified management platform.
Why I Picked Atera
I picked Atera for its exceptional network visibility, which is crucial for any network monitoring tool. Atera's Network Discovery feature stands out, offering an in-depth view of all devices within a network. This feature automatically scans and updates the network inventory, ensuring you always have the latest information on your network assets. Additionally, its continuous monitoring capabilities track key metrics like CPU, RAM, and bandwidth usage, helping you maintain optimal network performance.
Atera Key Features
In addition to its network visibility, Atera offers several other features that enhance its functionality:
- Remote Monitoring and Management (RMM): This feature allows you to monitor your network's health and performance from a single dashboard.
- Automated Patch Management: Keep your systems up-to-date with automated patching, reducing vulnerabilities.
- Helpdesk and Ticketing System: Streamline your support process with an integrated ticketing system.
- Reporting and Analytics: Gain insights with detailed reports on network performance and issues.
Atera Integrations
Integrations include Microsoft Teams, Slack, Acronis, Splashtop, and an API is available for custom integrations.
Pros and Cons
Pros:
- Centralized inventory for network assets
- Real-time CVE vulnerability scanning
- Auto-discovery of devices
Cons:
- Some features require separate add-ons
- Customization options may feel limited
New Product Updates from Atera

Atera Adds Multiple API Tokens With Access Controls
Atera now supports multiple API tokens with configurable expiration dates, IP restrictions, and permission scopes, giving teams tighter control and safer delegation of API access. For more information, visit Atera's official site.

ManageEngine OpManager gives IT teams and network administrators a unified platform to monitor, troubleshoot, and manage complex network infrastructures across physical, virtual, and cloud environments.
Who Is ManageEngine OpManager Best For?
ManageEngine OpManager is a strong fit for mid-size to large enterprises running complex network infrastructures that span multiple device vendors and technology stacks.
Why I Picked ManageEngine OpManager
I picked ManageEngine OpManager as one of the best because of how well it handles environments where Cisco, Juniper, Fortinet, and HP devices coexist on the same network. Most teams run mixed-vendor stacks, and OpManager's SNMP-based device discovery classifies hardware by category—routers, switches, firewalls—regardless of vendor. I also like the network path analysis feature, which lets my team trace the route traffic takes across multi-vendor hops and pinpoint where degradation occurs. The AI-based adaptive thresholds adjust based on real-time performance trends, reducing the need to retune alert baselines when new devices from different vendors are added.
ManageEngine OpManager Key Features
- Network mapping: Automatically generates L1/L2 topology maps to visualize device relationships and pinpoint outages across your infrastructure.
- IT workflow automation: Lets you build automated response workflows to handle first-level fault troubleshooting and routine maintenance tasks without manual intervention.
- Storage capacity forecasting: Analyzes historical and current usage trends to predict when storage resources will be exhausted before it becomes a problem.
- Distributed network monitoring: Monitors network resources across remote branch offices and data centers from a single unified console using a probe-central architecture.
ManageEngine OpManager Integrations
Integrations include ServiceDesk Plus, NetFlow Analyzer, Network Configuration Manager, Firewall Analyzer, OpUtils, AlarmsOne, Applications Manager, Analytics Plus, Site24x7, and AssetExplorer.
Pros and Cons
Pros:
- Router performance metrics like temperature, voltage, and buffer statistics
- Mapping and visualization of performance degradation and network outages
- 2,000+ performance metrics for network monitoring
Cons:
- Complex setup and configuration process
- Limited customization options for dashboards and reports
New Product Updates from ManageEngine OpManager
ManageEngine OpManager Vendor Templates and NCM XML Import
ManageEngine OpManager introduces enhanced vendor template integration and device template import for the NCM module using XML files. This update helps teams improve device classification and speed up configuration workflows. For more information, visit ManageEngine OpManager’s official site.
 .
.
Icinga is a flexible network monitoring platform built for IT teams and system administrators who need deep visibility, real-time alerts, and customizable dashboards to keep complex infrastructures running smoothly.
Who Is Icinga Best For?
Icinga is a strong fit for mid-to-large IT teams and DevOps engineers who need a highly customizable, open-source monitoring solution for complex, distributed infrastructure environments.
Why I Picked Icinga
Icinga earns its spot on my shortlist because it's one of the few genuinely open-source network monitoring platforms that doesn't water down its feature set to push you toward a paid tier. I like that you can monitor hosts, services, and network devices using a fully customizable check system, and then route alerts through your own notification logic without being locked into a vendor's opinionated workflow. My team uses Icinga's Icinga Director module to manage large-scale configurations through a web UI, which makes handling hundreds of monitored objects far less painful than editing flat config files.
Icinga Key Features
- Dependency views: Visualize relationships between monitored objects to quickly trace the root cause of cascading failures across your infrastructure.
- Distributed monitoring with clustering: Deploy Icinga across multiple nodes with built-in high availability, so there's no single point of failure in your monitoring setup.
- Metrics and log collection: Collect performance data and logs alongside health checks, giving you time-series context for diagnosing issues rather than just pass/fail status.
- Schedule-aware incident routing: Define on-call schedules and event rules to control exactly who gets notified and when, reducing unnecessary alert noise.
Icinga Integrations
Integrations include VMware, Kubernetes, Windows Server, MySQL, PostgreSQL, Elasticsearch, Grafana, Slack, PagerDuty, and Jira.
Pros and Cons
Pros:
- Highly customizable for various IT infrastructure needs
- Scalable for both small and large environments
- Free to use with no setup fees
Cons:
- Setup and configuration comes with a learning curve
- Occasional performance issues reported during high-load scenario
New Product Updates from Icinga
Icinga Adds OpenTelemetry Support
Icinga introduces OpenTelemetry metrics support, HTTP response streaming, and key system updates. These improvements enhance performance, scalability, and integration with modern monitoring tools. For more information, visit Icinga’s official site.
 .
.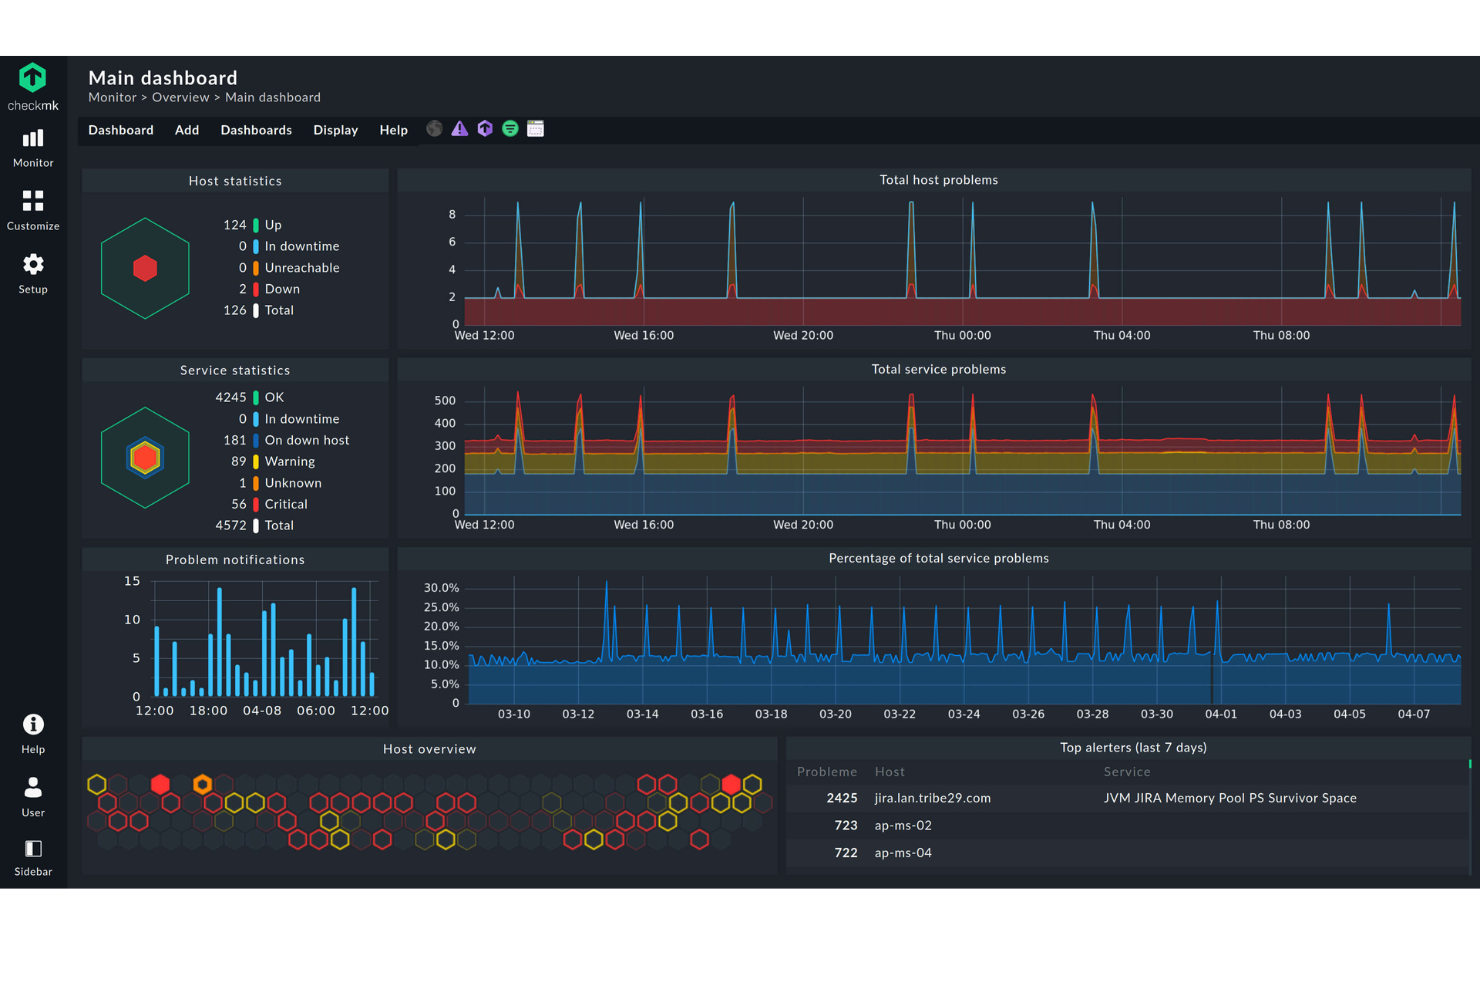
Checkmk is a network monitoring platform built for IT teams and managed service providers who need to monitor complex, distributed infrastructures and identify network issues across a wide range of devices and protocols.
Who Is Checkmk Best For?
Checkmk is a strong fit for mid-size to large IT teams and MSPs managing hybrid or multi-site infrastructures that have outgrown simpler monitoring tools.
Why I Picked Checkmk
Checkmk earns its spot on my shortlist because its distributed monitoring architecture genuinely scales in a way most tools can't match. I like that you can monitor hundreds of sites and millions of devices from a single platform without spinning up and syncing multiple monitoring instances. The auto-discovery feature is a standout—Checkmk automatically detects hosts and services, then recommends relevant metrics and thresholds, reducing setup time in large environments. The rule-based 1-to-N configuration lets my team apply a single rule across thousands of hosts, keeping configuration manageable as infrastructure grows.
Checkmk Key Features
- Real-time sampling: Checkmk collects monitoring data at measurement intervals as short as one minute, giving you up-to-date visibility into infrastructure health.
- Smart alerting: A rule-based notification system routes alerts to the right team—like storage admins for a failing disk—and escalates unresolved issues automatically.
- Log monitoring: Checkmk ingests events from syslog, SNMP traps, Windows event logs, and log files, then filters and collapses duplicate entries to reduce noise.
- Hardware and software inventory: Checkmk automatically identifies and tracks all hardware and software assets, and flags changes as they occur across your environment.
Checkmk Integrations
Integrations include AWS, Azure, Google Cloud Platform, VMware, Cisco, Dell, HPE, NetApp, Oracle, and Kubernetes.
Pros and Cons
Pros:
- Comprehensive monitoring capabilities
- Numerous automation options
- High configurability
Cons:
- Learning curve for new users
- Potential overhead for smaller networks

SuperOps is a cloud-based platform designed for managed service providers who need to monitor client networks, manage IT assets, and handle support tickets from a single dashboard.
Who Is SuperOps Best For?
SuperOps is a strong fit for small to mid-sized MSPs that need a single platform to manage network monitoring, ticketing, and client IT environments.
Why I Picked SuperOps
SuperOps earns its spot on my shortlist because it's one of the few platforms that genuinely combines network monitoring with a full PSA and RMM in a single interface. I like that network monitoring isn't bolted on as an afterthought—it's built into the RMM layer, so when a network alert fires, my team can jump into a ticket without switching tools. The platform supports real-time SNMP and ICMP monitoring across 250+ device manufacturers, and the visual topology maps give technicians full network context at a glance. Alert management uses AI to cut through noise, so my team focuses on issues that need attention rather than chasing false positives.
SuperOps Key Features
- Built-in SSH terminal: Access the terminal of any SSH-enabled network device directly within SuperOps to fix issues remotely without an on-site visit.
- Patch management: Schedule and automate OS and third-party software patches for Windows and Mac devices, with a custom patch approval matrix and automated deployment cycles.
- IT documentation: Store and access SOPs, WMI credentials, and troubleshooting steps securely alongside asset and network data in a single platform.
- Custom OID monitoring: Track granular, device-specific metrics using default monitors or custom OID monitoring to measure network health and performance over time.
SuperOps Integrations
Integrations include TeamViewer, Splashtop, ConnectWise Control, Xero, QuickBooks Online, Bitdefender, Webroot, Stripe, Microsoft Entra ID, and Pax8.
Pros and Cons
Pros:
- Offers native integrations with popular third-party software, enhancing functionality
- Easy to use with a simple setup process, reducing the learning curve for new users
- Unified platform that integrates network monitoring with RMM, streamlining IT operations
Cons:
- Limited information on customization options for specific MSP needs
- As a relatively new player, may lack some advanced features found in established competitors
New Product Updates from SuperOps

SuperOps Improves Ticket Visibility, Dynamic Forms, and Dashboard Views
SuperOps introduces improvements to ticket visibility, dynamic forms, and dashboard visualizations. These updates help technicians manage customer conversations, simplify ticket creation, and keep dashboard views consistent across teams. For more information, visit SuperOps' official site.
 .
.
Heimdal gives IT teams in businesses and enterprises a way to monitor network traffic, block threats, and secure endpoints with a focus on proactive threat detection and automated response.
Who Is Heimdal Best For?
Heimdal is a strong fit for mid-size to enterprise IT and security teams that need layered network protection across complex environments.
Why I Picked Heimdal
I picked Heimdal as one of the best because of how it approaches DNS security as a first line of defense rather than an afterthought. What I find genuinely impressive is Predictive DNS™—it uses machine learning and neural network modeling to predict and block malicious domains before they're even flagged by traditional threat intelligence feeds. In practice, my team can intercept threats at the DNS layer before any payload reaches an endpoint. I also like that the DNS Security Network module adds filtering directly to your local network infrastructure, so traffic doesn't need to reroute through external resolvers—a real advantage for hybrid and on-prem environments where latency and data sovereignty matter.
Heimdal Key Features
- Traffic logging tool: Logs all DNS traffic activity across your network so you can see exactly what devices are communicating with and flag suspicious behavior before it escalates.
- Host-Based Intrusion Prevention System (HIPS): Combines machine learning-based behavioral analysis with traffic filtering to detect and block intrusion attempts at the network level.
- Cloud Access Security Brokerage (CASB): Lets IT admins identify, classify, and block unsanctioned cloud apps accessing your environment, reducing shadow IT exposure.
- BYOD and IoT device coverage: Extends network protection to every device connected to your network—including personal devices and IoT equipment—without requiring endpoint agents.
Heimdal Integrations
Integrations include ConnectWise, Autotask, HaloPSA, Cisco Meraki, Microsoft 365, Microsoft Business, Blackpoint Cyber, Sophos, N-Able, and Patch My PC.
Pros and Cons
Pros:
- Detailed asset and license visibility
- Strong vulnerability and threat detection
- Automates patching across endpoints
Cons:
- Interface requires onboarding time
- No native integrations available

Site24x7 gives IT teams and managed service providers a unified platform to monitor network devices, servers, and cloud infrastructure, helping them detect outages, performance issues, and security threats across complex environments.
Who Is Site24x7 Best For?
Site24x7 is a good fit for mid-size to large IT teams managing mixed-vendor environments that span on-premises devices, cloud services, and remote infrastructure.
Why I Picked Site24x7
Site24x7 earns its spot on my shortlist because of how much ground it covers when it comes to device monitoring. I like that it supports over 450 device vendors using more than 15,000 device templates, which means my team can monitor routers, switches, firewalls, load balancers, and wireless controllers without needing separate tools for each vendor. Automated network discovery across IP ranges and CIDR blocks also reduces setup time—devices get detected and mapped without manual input. Support for NetFlow, sFlow, and J-Flow gives my team interface-level traffic visibility that is useful when tracking down congestion or unusual bandwidth patterns.
Site24x7 Key Features
- Network configuration management: Automate configuration backups, detect unauthorized changes, identify firmware vulnerabilities, and track compliance from a single console.
- SNMP trap processing: Receive instant alerts from network devices using SNMP traps to catch failures and abnormal behavior in real time.
- SDN and SD-WAN monitoring: Get end-to-end visibility into software-defined networks, including Cisco Meraki, Cisco ACI, and VMware VeloCloud SD-WAN environments.
- IP address management: Automatically discover and manage your entire IP space, track usage, prevent conflicts, and plan subnets with real-time insights.
Site24x7 Integrations
Integrations include ServiceNow, PagerDuty, Opsgenie, Jira, ManageEngine AlarmsOne, ConnectWise Manage, Zoho Desk, Zendesk, Slack, and Microsoft Teams.
Pros and Cons
Pros:
- Comprehensive monitoring capabilities
- Real-time alerts and notifications
- Customizable dashboards and reports
Cons:
- Complexity in initial setup for large environments
- Limited customization in alerting mechanisms
New Product Updates from Site24x7
Site24x7 Adds Synchronization Statuses for MSPs
Site24x7 now provides MSPs enhanced alerts and synchronization statuses in a centralized notification center to spot configuration sync issues sooner and accelerate incident response. For more information, visit Site24x7's official site.


PRTG is a network monitoring platform built for IT teams and managed service providers who need to monitor complex infrastructures, spot issues fast, and keep business systems running smoothly.
Who Is PRTG Best For?
PRTG is a strong fit for mid-size to enterprise IT teams managing on-premises, cloud, or hybrid infrastructure across industries like healthcare, finance, and manufacturing.
Why I Picked PRTG
PRTG earns its spot on my shortlist because of how well it shifts network monitoring from reactive firefighting to genuine issue prevention. I particularly like the AI-driven anomaly detection, which continuously analyzes historical data to build intelligent baselines and flags deviations before they escalate into outages. On top of that, PRTG's customizable alert thresholds let my team fine-tune warning levels so we catch degrading conditions—like bandwidth creeping toward capacity—well before users notice anything. The smart sensor recommendations also surface monitoring gaps automatically, so nothing critical slips through undetected.
PRTG Key Features
- Sensor library: Choose from 250+ pre-configured sensor types covering SNMP, WMI, NetFlow, packet sniffing, and more to monitor virtually any device or protocol.
- Distributed monitoring: Monitor multiple remote locations from a single dashboard using remote probes, with TLS-encrypted communication between all components.
- Customizable reporting: Build and schedule reports using custom templates to share infrastructure status with stakeholders in a readable format.
- Real-time maps: Design live network maps with drag-and-drop tools that display current device and connection status across your entire infrastructure.
PRTG Integrations
Integrations include AWS, Microsoft Azure, VMware, Cisco, Dell EMC, NetApp, HPE, Oracle, Citrix, and Zoom. An HTTP API is also available for custom integrations.
Pros and Cons
Pros:
- Scalable for small and large networks
- Customizable monitoring and alerting
- User-friendly interface
Cons:
- More advanced features may come with a learning curve
- High cost for larger deployments
New Product Updates from PRTG
PRTG Introduces New Monitoring Sensors In Beta
This week, PRTG introduces three BETA sensors that broaden your monitoring scope for Proxmox VE clusters and SIMATIC S7-300/400 PLCs, giving you deeper operational insights. For more information, visit PRTG’s official site.
 .
.
Dynatrace gives IT teams and enterprises deep visibility into network performance, application dependencies, and infrastructure health, helping them identify and resolve issues faster across hybrid and cloud-native environments.
Who Is Dynatrace Best For?
Dynatrace is a strong fit for large enterprises and DevOps teams managing complex, multi-cloud or hybrid infrastructures that demand deep, automated observability.
Why I Picked Dynatrace
Dynatrace earns its spot on my shortlist because of how well it handles network monitoring across genuinely complex environments—multi-cloud, hybrid, and on-premises all at once. I particularly like the Smartscape topology mapping, which automatically discovers and visualizes dependencies between apps, services, and the underlying network in real time. When something breaks, I'm not manually tracing connections across a dozen dashboards. Dynatrace's AI-driven root cause analysis, powered by Davis AI, pinpoints the exact source of a network issue rather than flooding you with alerts to sort through yourself.
Dynatrace Key Features
- OneAgent deployment: A single agent installs on any host and automatically collects metrics, logs, traces, and network data across your full stack without manual configuration.
- NetFlow and SNMP trap monitoring: Captures network traffic flow data and SNMP traps to give you granular visibility into device-level activity and traffic patterns.
- OpenPipeline data processing: Ingests, enriches, and contextualizes data streams in real time before storage, so network events are pre-processed and ready for immediate analysis.
- AutomationEngine remediation: Triggers automated responses to detected network issues, including auto-remediation workflows and real-time CMDB updates.
Dynatrace Integrations
Integrations include Jira, Slack, GitHub Copilot, PagerDuty, Cursor IDE, JetBrains, Windsurf, and an API is available for custom integrations.
Pros and Cons
Pros:
- Alerting and notification for network outages
- Capacity planning and forecasting for network resources
- Can analyze network latency and packet loss
Cons:
- Pricing structure is complex
- No free plan
Otras opciones de software de monitoreo de red
Aquí tienes algunas opciones adicionales para elegir. Aunque no llegaron a la lista de los mejores 12, todavía vale la pena considerarlas:
- Datadog
For small businesses
- NinjaOne
For endpoint management and patch compliance
- Netdata
For real-time infrastructure monitoring
- Wireshark
For packet analysis
- Zabbix
Range of features
- LogicMonitor
For cloud-based network monitoring
- SysAid
For network monitoring and ITSM ticketing
- WhatsUp Gold
For comprehensive network monitoring
- New Relic
For advanced and power users
- Nagios XI
For enterprises
- Prometheus
Free network monitoring tool
- Munin Monitoring
Free option
- Zenoss
For hybrid IT infrastructure monitoring
- OPSWAT Security Score
For Windows security scans
- Syncro
For unlimited endpoint monitoring
- ManageEngine Applications Manager
For application monitoring
- Dotcom Monitor
For multi-step API & web testing
- Cisco Meraki
For security
- Spiceworks
For non-technical users
- NetCrunch
For hybrid IT infrastructure monitoring


Reseñas relacionadas
- Software de monitoreo de red
- Software de monitoreo de servidores
- Soluciones SD-WAN
- Herramientas de monitoreo de infraestructura
- Analizador de paquetes
- Herramientas de monitoreo de aplicaciones
How I Evaluate Network Monitoring Software
I split my evaluation into two layers: baseline capabilities every tool must have—like SNMP discovery, real-time alerting, and flow analysis—and the differentiators that set the best options apart.
Core Functionality (Table Stakes for This List)
These core capabilities serve as the acceptance criteria for inclusion on my list of network monitoring software:
- Device & Network Discovery: I check whether a tool can auto-discover routers, switches, APs, and servers across subnets and map their Layer 2/3 relationships without hours of manual entry.
- Real-Time Performance Monitoring: Polling intervals, metric breadth, and sensor coverage matter here—I look for bandwidth, latency, CPU, memory, and interface tracking at useful intervals.
- Multi-Protocol Support: Tools that only handle SNMP and ICMP leave gaps. I evaluate whether a platform also supports NetFlow/sFlow/IPFIX, WMI, and syslog for full-stack visibility.
- Alerting & Notification Engine: I look at threshold configuration, escalation paths, and channel options—email, SMS, Slack, PagerDuty—plus whether alerts suppress downstream noise from dependencies.
- Topology Visualization & Dashboards: A live, interactive topology map that reflects real device states is what I look for, along with dashboards you can customize by role or site.
- Historical Reporting & Analytics: I evaluate data retention policies, report templates for SLA tracking, and whether trend data supports capacity planning decisions months out.
I rank each vendor on a scale from 0 (does not offer the functionality) to 5 (excels in this area) for each criterion.
Vendors need to achieve a minimum average score to be considered for inclusion on my list. From there, I consider what sets each platform apart.
Differentiating Factors (What Sets Vendors Apart)
Once I've curated my list, here's how I contrast and compare different vendors in the network monitoring software space:
Standout Features
AI-driven anomaly detection and deep packet inspection can be game changers for diagnosing complex performance issues that simple polling might miss. I also look for hybrid and cloud monitoring capabilities, especially when businesses run networks that span office, data center, and public cloud environments. Multi-tenant architecture stands out for MSPs or large enterprises needing clean client or site separation. Network configuration management becomes critical when frequent device changes demand easy versioning and quick rollbacks.
Beyond Features
Licensing structure matters a lot here—per-device vs. per-sensor pricing can drastically change your total cost as your network grows. I also evaluate integration depth with ITSM tools, since alert-to-ticket automation is where real operational time savings happen. Deployment flexibility is another factor I weigh; some teams need on-premise control for air-gapped networks, while others benefit from SaaS. Finally, I check for RBAC, SSO, and audit logging to confirm a platform fits regulated environments.
Cómo elegir software de monitoreo de red
Es fácil perderse entre largas listas de funciones y estructuras de precios complejas. Para ayudarte a mantener el enfoque en tu propio proceso de selección de software, aquí tienes una lista de factores a tener en cuenta:
| Factor | Qué considerar |
|---|---|
| Escalabilidad | ¿Puede el software crecer con tu negocio? Considera las necesidades futuras y si la herramienta puede manejar un aumento de datos y dispositivos sin problemas de rendimiento. |
| Integraciones | Verifica la compatibilidad con tus herramientas actuales. Asegúrate de que haya un flujo de datos sin problemas entre sistemas. Da prioridad al software que se conecte con tus plataformas clave como CRM o ERP. |
| Personalización | Busca flexibilidad en paneles y reportes. ¿Puedes adaptar el software a tu flujo de trabajo? Evita herramientas con estructuras rígidas que no se adapten a tus necesidades. |
| Facilidad de uso | Considera la curva de aprendizaje para tu equipo. ¿La interfaz es intuitiva? Las herramientas que requieren mucha capacitación pueden ralentizar la adopción y la productividad. |
| Implementación y puesta en marcha | Evalúa el proceso de instalación y los recursos necesarios. ¿Cuánto tiempo te tomará estar plenamente operativo? Considera la disponibilidad de materiales de formación y soporte durante la puesta en marcha. |
| Costo | Compara los modelos de precios. ¿Hay cargos ocultos o costos extra por funciones esenciales? Asegúrate de que el plan se ajuste a tu presupuesto ahora y en el futuro a medida que crezcas. |
| Medidas de seguridad | Analiza las medidas de protección de datos. ¿El software cumple con los estándares de la industria? Busca cifrado, controles de acceso y actualizaciones de seguridad regulares para proteger la información sensible. |
¿Qué es el software de monitorización de red?
El software de monitorización de red es utilizado por profesionales de TI y administradores de sistemas para rastrear y gestionar el rendimiento y la disponibilidad de los componentes de red, a menudo colaborando junto a proveedores de optimización WAN para asegurar que los sistemas funcionen de manera fluida y eficiente.
Las alertas en tiempo real, el análisis de ancho de banda y las funciones de seguimiento de dispositivos ayudan a identificar problemas, optimizar el rendimiento y mantener la salud de la red. Las herramientas de mapeo de red complementan estas capacidades de monitorización al proporcionar representaciones visuales de la topología de la red y las relaciones entre dispositivos. En general, estas herramientas ofrecen perspectivas esenciales que mejoran la fiabilidad y seguridad de la red.
Características
Al elegir un software de monitorización de red, presta atención a las siguientes funciones clave:
- Monitorización de red en tiempo real: Esta función te permite ver datos en vivo sobre el rendimiento de la red y el estado de los dispositivos. Puedes detectar caídas o lentitudes repentinas y actuar rápido, en lugar de quedarte desprevenido.
- Alertas personalizables: Crea notificaciones adaptadas según umbrales de rendimiento o incidentes específicos. Estas alertas te ayudan a responder a los problemas antes de que se conviertan en inconvenientes mayores.
- Informes completos: Obtén informes detallados que resumen la actividad de la red, las tendencias de rendimiento y el estado de los dispositivos. Usa esta información para identificar áreas problemáticas y mostrar mejoras a tu equipo (¡o jefe!).
- Descubrimiento y mapeo de dispositivos: El software escanea e identifica automáticamente los dispositivos conectados a tu red. Este mapa facilita el seguimiento de dispositivos nuevos o inesperados y refuerza la seguridad de tu red.
- Análisis de uso de ancho de banda: Monitorea qué dispositivos o aplicaciones están usando más ancho de banda. Esto te ayuda a resolver problemas de congestión y aplicar políticas de uso justo para que todos estén satisfechos.
- Retención de datos históricos: Revisa métricas previas del rendimiento de la red para detectar problemas recurrentes o tendencias a largo plazo. Con estos datos, podrás planificar mejoras y evitar caídas repetidas.
- Compatibilidad con múltiples proveedores: El soporte para hardware y software de varios fabricantes te permite monitorear todo en tu red, incluso si tus dispositivos provienen de diferentes marcas.
- Capacidades de monitorización remota: Accede de forma segura al panel de monitorización de tu red desde cualquier lugar. Así seguirás teniendo el control, estés en la oficina o trabajando a distancia.
- Herramientas automatizadas de resolución de problemas: Aprovecha los diagnósticos integrados que recomiendan o incluso realizan arreglos básicos. Esto te ahorra tiempo y te ayuda a resolver problemas comunes sin una revisión manual profunda.
Beneficios
Implementar un software de monitorización de red brinda diversos beneficios para tu equipo y tu empresa. Aquí tienes algunos a los que puedes aspirar:
- Escalabilidad: El mapeo automatizado de la red y las funciones flexibles respaldan el crecimiento de las empresas al adaptarse a las demandas crecientes. Fundamental para los objetivos estratégicos de la organización.
- Mayor fiabilidad de la red: Las alertas en tiempo real y los análisis predictivos ayudan a prevenir tiempos de inactividad al abordar incidencias antes de que escalen.
- Mejor seguridad: La detección de anomalías y el rastreo de dispositivos identifican posibles amenazas y vulnerabilidades, manteniendo protegida tu red.
- Rendimiento optimizado: El análisis de ancho de banda garantiza un uso eficiente de los recursos, lo que conduce a operaciones de red más fluidas.
- Toma de decisiones informada: Los paneles personalizables brindan información adaptada a tus necesidades, ayudando en la gestión y planificación estratégica.
- Reducción de costes operativos: La monitorización proactiva minimiza la necesidad de soluciones de emergencia y reduce el riesgo de incidencias costosas.
- Mejor experiencia de usuario: La monitorización sintética asegura que los servicios estén disponibles y funcionando correctamente, lo que se traduce en usuarios satisfechos.
Costes y precios
Seleccionar un software de monitorización de red requiere comprender los diferentes modelos de precios y planes disponibles. Los costes varían según las funciones, el tamaño del equipo, los complementos y más. La siguiente tabla resume los planes habituales, sus precios promedio y las funciones típicas incluidas en las soluciones de software de monitorización de red:
Tabla comparativa de planes para software de monitorización de red
| Tipo de plan | Precio medio | Funciones comunes |
|---|---|---|
| Plan gratuito | $0 | Capacidades básicas de monitoreo, alertas limitadas y soporte de la comunidad. |
| Plan personal | $5-$25/usuario/mes | Alertas en tiempo real, paneles personalizables e informes básicos. |
| Plan empresarial | $30-$75/usuario/mes | Análisis avanzados, funciones de seguridad mejoradas y opciones de integración. |
| Plan corporativo | $100-$250/usuario/mes | Monitoreo integral, soporte prioritario, análisis predictivos y amplias opciones de personalización. |
Preguntas frecuentes sobre software de monitoreo de red
Aquí puedes encontrar respuestas a las preguntas más comunes sobre el monitoreo de red y las herramientas relacionadas.
¿Qué monitorea realmente el software de monitoreo de red?
¿Cómo mejora la seguridad el monitoreo de red?
¿Puede monitorear tanto redes locales como en la nube?
¿Cuáles son los beneficios de las alertas automáticas en el monitoreo de red?
¿Con qué frecuencia se debe revisar el rendimiento de la red?
¿Qué sigue?
Si estás investigando software de monitoreo de red, conéctate con un asesor de SoftwareSelect para recibir recomendaciones gratuitas.
Completarás un formulario y tendrás una breve charla en la que se profundizará en tus necesidades específicas. Luego recibirás una lista corta de software para evaluar. Incluso te acompañarán a lo largo de todo el proceso de compra, incluyendo la negociación de precios.