10 Best Website Monitoring Tools Of 2026

Best Website Monitoring Tool Shortlist


In the fast-paced world of tech, keeping your website up and running is crucial. Downtime can cost you not just money, but also your reputation. As a tech expert, you know the frustration of unexpected outages or slow load times. That's where website monitoring tools come in.
These tools help you keep an eye on your site's performance, ensuring everything runs smoothly. In my experience, having the right tool can save your team time and headaches.
In this article, I'll share my top picks for website monitoring tools. You'll get an unbiased, well-researched review to help you find the best fit for your needs. Let's dive in and make sure your website stays in top shape.
Why Trust Our Software Reviews
We’ve been testing and reviewing software since 2023. As tech leaders ourselves, we know how critical and difficult it is to make the right decision when selecting software.
We invest in deep research to help our audience make better software purchasing decisions. We’ve tested more than 2,000 tools for different tech use cases and written over 1,000 comprehensive software reviews. Learn how we stay transparent & our software review methodology.
Best Website Monitoring Tools Summary
This comparison chart summarizes pricing details for my top website monitoring tool selections to help you find the best one for your budget and business needs.
| Tool | Best For | Trial Info | Price | ||
|---|---|---|---|---|---|
| 1 | Best for AI-driven analytics | Free trial available | From $7/host/month | Website | |
| 2 | Best for real-time website error tracking | Free plan + free trial + free demo available | From $26/month (billed annually) | Website | |
| 3 | Best for real-time monitoring dashboards | 14-day free trial | From $15/host/month (billed annually) | Website | |
| 4 | Best for combined application and website monitoring | 30-day free trial + free demo + free plan availabl | From $199/year | Website | |
| 5 | Best for global reach with 110+ locations | 30-day free trial + free demo available | From $10/month (billed annually) | Website | |
| 6 | Best for SSL monitoring | Free plan + free demo available | From $8/10 monitors/month (billed annually) | Website | |
| 7 | Best for hybrid infrastructure monitoring | Free 15-day trial | From $16/hybrid unit/month | Website | |
| 8 | Best for real-time user interaction data | Free plan available | From $49/user/month | Website | |
| 9 | Best for real user experience insights | 14-day free trial + free demo available | From $40/100,000 errors/month (billed annually) | Website | |
| 10 | Best for monitoring web applications | 30-day free trial + free demo available | From $5.10/credit/month (billed annually) | Website |
-

TestDevLab
Visit Website -
Site24x7
Visit WebsiteThis is an aggregated rating for this tool including ratings from Crozdesk users and ratings from other sites.4.7 -
GitHub Actions
Visit WebsiteThis is an aggregated rating for this tool including ratings from Crozdesk users and ratings from other sites.4.8


Best Website Monitoring Tools Reviews
Below are my detailed summaries of the best website monitoring tool that made it onto my shortlist. My reviews offer a detailed look at the key features, pros & cons, integrations, and ideal use cases of each tool to help you find the best one for you.

Dynatrace is a software intelligence platform that offers application performance, cloud infrastructure monitoring, and digital experience insights. By harnessing the power of AI, it delivers real-time analytics to ensure optimal software and infrastructure health, which is pivotal for organizations seeking AI-driven insights.
Why I Picked Dynatrace: In my process of choosing software intelligence tools, Dynatrace stood out prominently. Its distinctive edge lies in its AI-powered analytics, which I found to be more advanced than many other platforms.
Judging by its capabilities, it's evident that Dynatrace is the best for businesses that require AI-driven analytics to bolster their software and infrastructure performance.
Standout Features & Integrations:
Dynatrace's AI engine automatically discovers and analyzes application dependencies, optimizing performance with minimal manual intervention. The platform's Digital Experience Monitoring captures user experiences across various channels, providing a holistic view of performance.
For integrations, Dynatrace is compatible with popular cloud providers like AWS, Azure, and Google Cloud, and it easily integrates with CI/CD tools like Jenkins.
Pros and Cons
Pros:
- Versatile integrations with both cloud providers and CI/CD tools
- Comprehensive monitoring across applications, cloud, and digital channels
- Advanced AI analytics for automatic problem discovery and resolution
Cons:
- Complex configurations may require specialized expertise
- The pricing can be high for smaller organizations
- Might require a steep learning curve for new users

Sentry offers a comprehensive solution for businesses looking to enhance their website monitoring capabilities. Designed to assist developers and software teams, Sentry provides tools that allow you to see errors clearly and solve issues faster, making it an appealing choice for various industries, including web development and ecommerce. With features like error tracking, uptime monitoring, and session replay, Sentry helps you maintain optimal application performance and user experience, addressing common challenges such as unexpected downtime and performance bottlenecks.
Why I Picked Sentry
I picked Sentry for its unique focus on providing detailed insights into application performance and error tracking. One standout feature is its real-time error monitoring, which captures errors as they occur, allowing you to quickly diagnose and resolve issues. Another key feature is the uptime monitoring, which ensures your website is always accessible by notifying you of any downtime. Additionally, Sentry's session replay functionality provides a visual representation of user interactions, helping you understand and resolve user experience issues more efficiently.
Sentry Key Features
In addition to real-time website error tracking, Sentry offers:
- Tracing: Provides insights into API calls and database queries, helping you identify performance bottlenecks within your application.
- Automatic Root Cause Analysis: Utilizes AI to pinpoint the underlying causes of errors, streamlining the debugging process.
- AI-Driven Debugging: Offers automated code reviews and suggestions, reducing the time needed to resolve complex issues.
- Integration with Development Tools: Seamlessly connects with platforms like GitHub and Slack, ensuring a smooth workflow for your development team.
Sentry Integrations
Integrations include GitHub, Slack, Jira, Bitbucket, GitLab, Trello, Azure DevOps, PagerDuty, AWS Lambda, and Microsoft Teams.
Pros and Cons
Pros:
- Advanced error grouping helps prioritize issues for fast resolution
- Distributed tracing shows transaction-level performance insights
- Offers real-time error tracking across web, mobile, and backend apps
Cons:
- Limited alerts and applications insights in lower-tier plans
- Not all integrations are available natively, relying on third-party APIs for some
New Product Updates from Sentry

Sentry Adds GitLab Support and gRPC Instrumentation
Sentry adds GitLab support for Seer and gRPC instrumentation for Dart and Flutter to improve root cause analysis, code tracing, and debugging workflows. For more information, visit Sentry’s official site.
 .
.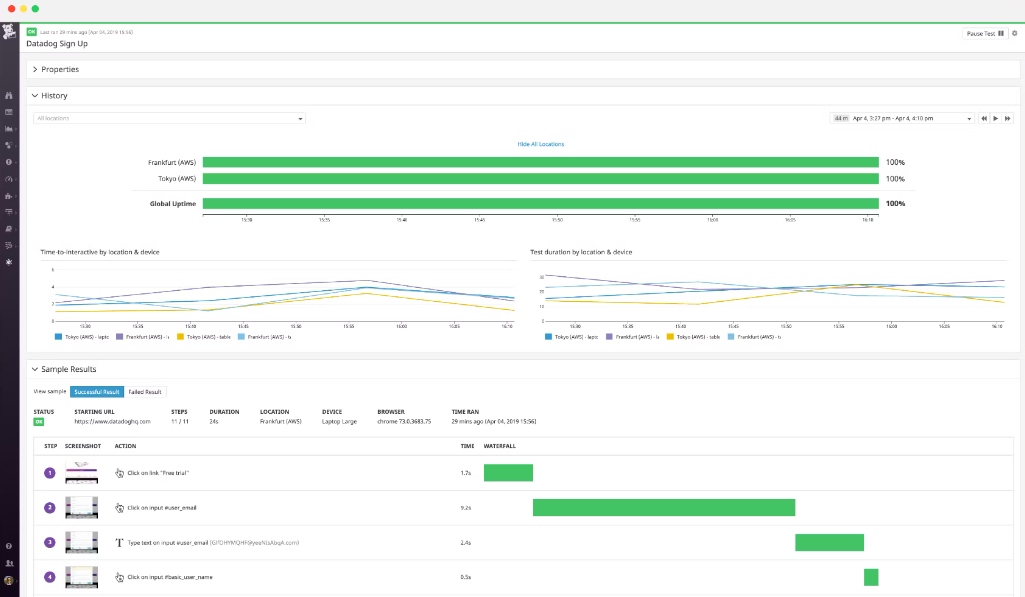
Datadog is a cloud-based monitoring and analytics platform, that assists businesses in visualizing the performance of their applications, tools, and services in real-time. Its strength lies in creating comprehensive, real-time dashboards that aggregate data from multiple sources, which aligns with the need for immediate insights and proactive responses.
Why I Picked Datadog: In the process of selecting tools for this list, Datadog emerged as a prime candidate due to its powerful dashboard capabilities. After comparing various platforms, I found that Datadog’s ability to provide immediate insights through dynamic visualizations made it distinct.
I determined that for organizations requiring real-time monitoring dashboards, Datadog stands out.
Standout Features & Integrations:
Datadog boasts an advanced anomaly detection system that pinpoints potential issues before they become significant problems. Additionally, it offers distributed tracing that aids in the identification of performance bottlenecks in microservice architectures.
When it comes to integrations, Datadog connects with a vast array of platforms, including AWS, Docker, Slack, and many more, consolidating data for enriched analysis.
Pros and Cons
Pros:
- Wide range of integrations with popular platforms
- Offers advanced anomaly detection
- Extensive real-time dashboard capabilities
Cons:
- Data retention limits for the base plan
- Pricing can become high with additional features
- Steeper learning curve for newcomers
Best for combined application and website monitoring

ManageEngine Applications Manager delivers an integrated approach to monitoring both applications and websites. By ensuring consistent performance of these two critical components, it helps organizations maintain optimal user experiences and operational efficiency.
Why I Picked ManageEngine Applications Manager: I selected ManageEngine Applications Manager for its comprehensive approach to performance monitoring. Upon judging and comparing multiple tools, it was my opinion that ManageEngine's capability to simultaneously monitor both applications and websites gives it a distinct edge.
This dual monitoring ability positions it as an ideal solution for organizations that need to ensure both their web and application assets perform harmoniously.
Standout Features & Integrations:
ManageEngine Applications Manager excels in monitoring diverse applications ranging from web apps, and databases, to big data stores. Its root cause analysis feature helps quickly pinpoint issues, reducing downtime. Additionally, it provides key integrations with platforms such as AWS, Microsoft Azure, and Oracle Cloud, further broadening its monitoring spectrum.
Pros and Cons
Pros:
- Useful root cause analysis feature
- Comprehensive support for a variety of application types
- Dual monitoring of both applications and websites
Cons:
- Requires initial configuration and setup time
- Licensing can become complex as you scale
- Might be over-comprehensive for small businesses
New Product Updates from ManageEngine Applications Manager
ManageEngine Applications Manager Adds ServiceDesk Plus MSP Cloud
ManageEngine Applications Manager adds ServiceDesk Plus MSP Cloud integration to automatically create and manage tickets from application alarms, helping teams track and resolve incidents faster. For more information, visit ManageEngine Applications Manager’s official site.
 .
.
Site24x7 offers comprehensive web application monitoring from a user's perspective, ensuring website performance from multiple geographical locations. Its standout feature is its presence across 110+ global locations, enabling businesses to monitor their website's performance and uptime from virtually anywhere in the world.
Why I Picked Site24x7: In choosing tools, the extensive global presence of Site24x7 became evident as a unique selling point. After judging and comparing various monitoring solutions, I formed the opinion that Site24x7's expansive reach offers an unparalleled advantage, especially for businesses targeting a worldwide audience. For companies that value global coverage, Site24x7 is clearly the optimal choice.
Standout Features & Integrations:
Site24x7 not only monitors websites but also applications, servers, and network infrastructure, ensuring all-around performance insights. Real User Monitoring (RUM) and Application Performance Monitoring (APM) are some of its key features, providing insights into real users' experiences and the application's backend performance.
Integration-wise, Site24x7 is compatible with popular platforms like AWS, Microsoft Azure, and Google Cloud, allowing for a comprehensive view of cloud resource performance.
Pros and Cons
Pros:
- Extensive cloud platform integrations
- Comprehensive suite of tools including RUM and APM
- Wide global monitoring presence with 110+ locations
Cons:
- Additional features can incur extra costs
- Limitations on the number of monitors in the base plan
- Interface might be complex for beginners
New Product Updates from Site24x7

Site24x7 Adds Discovery Issues for AWS Monitoring
Site24x7 added Discovery Issues for AWS monitoring, helping teams identify why resources are not being discovered across services and regions. The feature surfaces permission gaps, policy restrictions, and blocked API actions to support faster troubleshooting. For more information, visit Site24x7’s official site.
 .
.
For teams seeking a reliable website monitoring tool, UptimeRobot offers a practical solution that supports SSL monitoring alongside uptime checks. It’s well-suited for teams such as developers, DevOps, and marketers who need consistent visibility into site availability and security status. By helping detect issues such as certificate expirations, downtime, and slow response times, UptimeRobot supports a stable, dependable online presence.
Why I Picked UptimeRobot
I picked UptimeRobot for its SSL monitoring, which helps teams stay ahead of certificate issues before they affect site access. It alerts you when certificates are close to expiring, reducing the risk of unexpected security warnings or downtime. UptimeRobot also supports multi-location checks and real-time alerts through channels like email and Slack, making it easier to spot availability or performance issues across regions and respond quickly.
UptimeRobot Key Features
In addition to SSL monitoring, UptimeRobot offers:
- Cron Job Monitoring: This feature lets you track scheduled tasks and ensure they run at the right time.
- Customizable Status Pages: You can create and share status pages that reflect your brand and keep stakeholders informed during outages.
- Multi-Location Monitoring: This feature helps detect location-specific issues by checking website performance from different global points.
- Advanced Notification Settings: You can customize alerts based on outage severity and set up maintenance windows to avoid unnecessary alerts.
UptimeRobot Integrations
UptimeRobot offers various integrations to enhance your monitoring experience, including email, Slack, PagerDuty, Microsoft Teams, Telegram, Discord, Webhooks, Zapier, and API support for custom integrations.
Pros and Cons
Pros:
- Generous free plan for basic monitoring needs
- Real-time alerts via email, Slack, and other channels
- SSL monitoring alerts before certificates expire
Cons:
- Lower-tier plans have restricted monitoring intervals
- Limited performance diagnostics compared to advanced tools
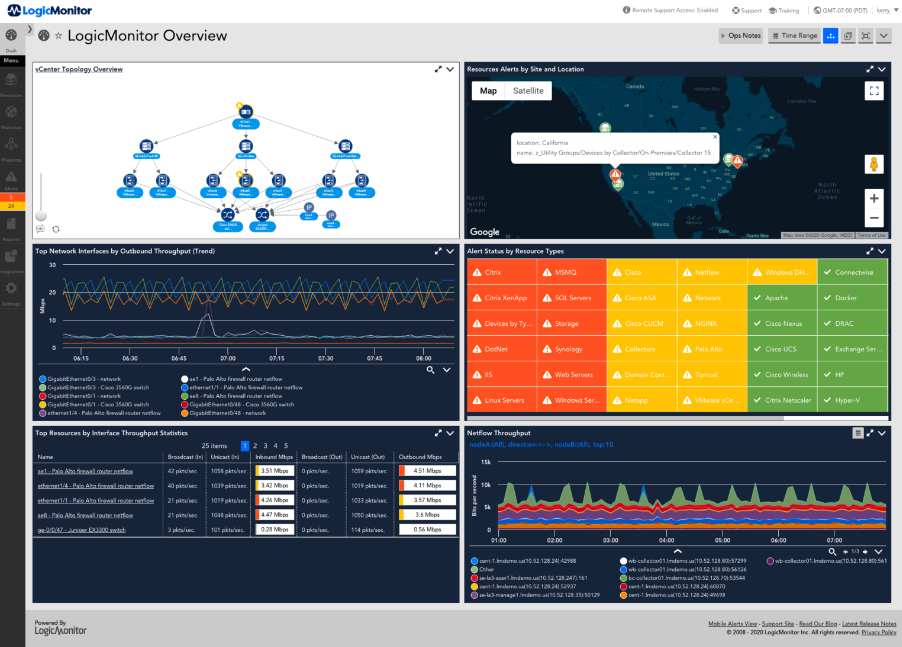
LogicMonitor presents a cloud-based platform designed to automate infrastructure monitoring. Catering to both on-premises and cloud environments, it recognizes the growing need for businesses to have a combined perspective on their entire IT landscape.
Why I Picked LogicMonitor: When determining which tool to include for infrastructure monitoring, LogicMonitor was a standout choice due to its extensive capabilities in handling both traditional and modern IT environments. In comparing numerous solutions, I judged that LogicMonitor's ability to offer insights into both on-premises and cloud infrastructure was particularly commendable.
This intrinsic capability makes it best suited for businesses transitioning to or balancing between cloud and on-premises setups.
Standout Features & Integrations:
LogicMonitor shines with features such as automated device discovery and dynamic thresholding, which facilitate proactive issue detection. Furthermore, it boasts a library of over 2000 integrations, ensuring that it remains compatible with a vast array of devices and applications.
Among its most valued integrations are those with AWS, Azure, and VMware, covering both cloud and on-premises landscapes.
Pros and Cons
Pros:
- Extensive library of integrations
- Automated device discovery streamlines setup
- Supports monitoring of diverse infrastructure types
Cons:
- Initial setup can be complex for larger environments
- Some advanced features have a learning curve
- No flat-rate pricing is available publicly
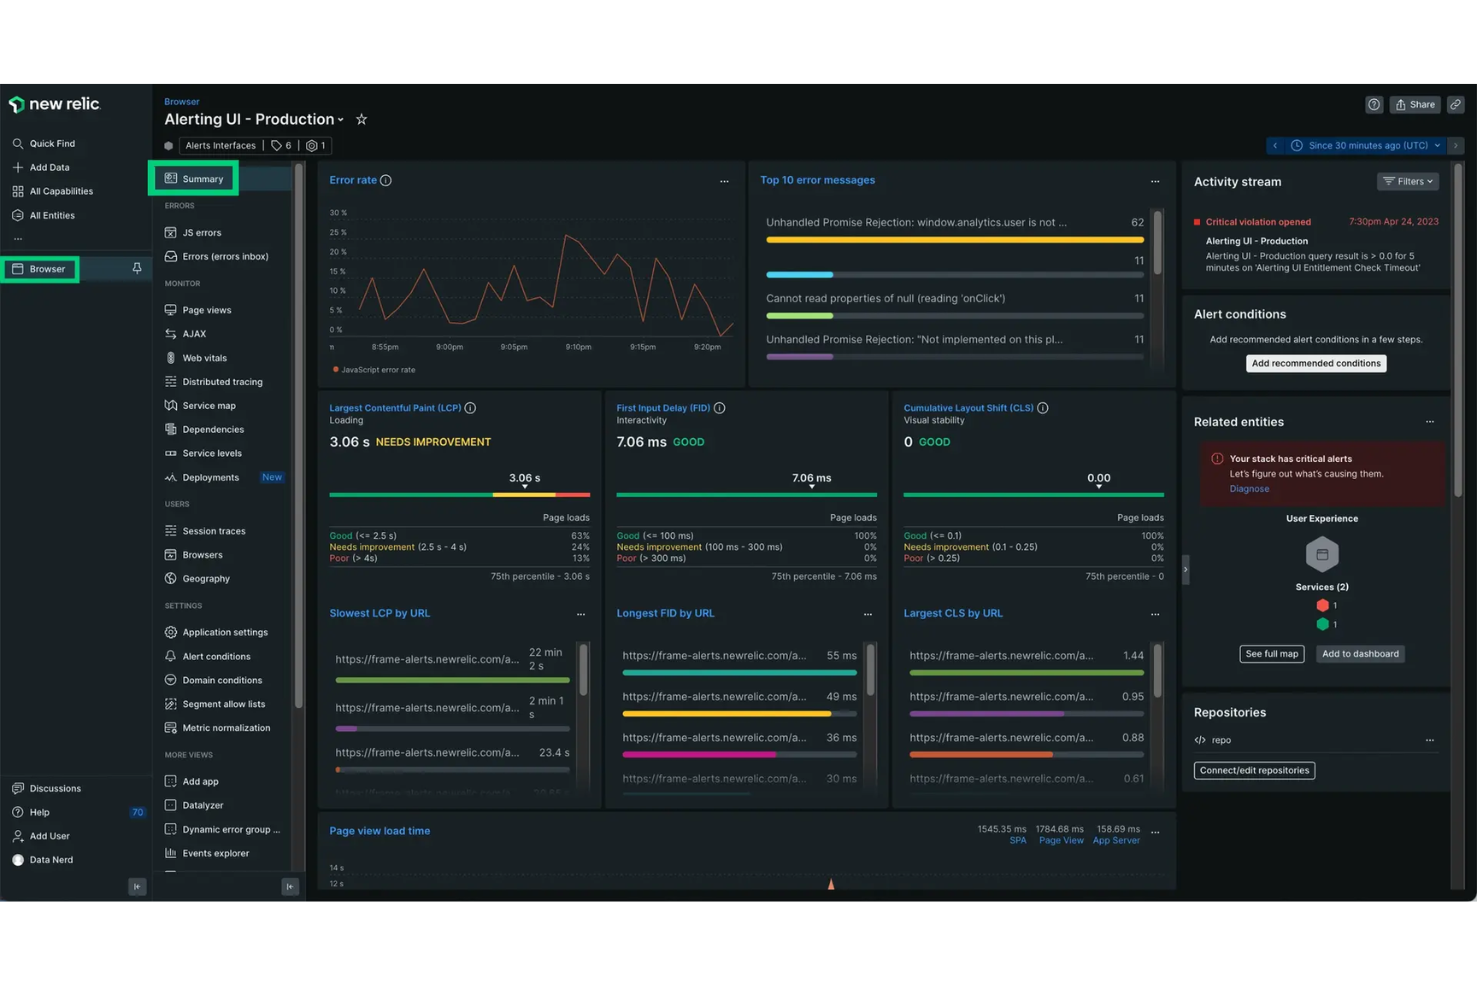
New Relic is a comprehensive observability platform designed to help you monitor, debug, and improve your entire software stack. By providing real-time insights into your applications and infrastructure, it enables you to identify and resolve issues swiftly, ensuring optimal performance and user satisfaction.
Why I Picked New Relic: I like its digital experience monitoring suite, which includes browser real-user monitoring and synthetics. Browser real-user monitoring provides insights into your users' actual experiences by tracking metrics like page load times and session traces. Synthetics allows you to simulate user interactions to proactively identify potential issues before they affect real users. Together, these tools empower you to maintain high website performance and reliability.
Standout Features & Integrations:
Other features include infrastructure monitoring, which offers visibility into your servers, containers, and cloud services, helping you maintain system health and performance. Log management centralizes your log data, making it easier to search and analyze logs for troubleshooting and auditing purposes.
Integrations include AWS, Google Cloud Platform, Microsoft Azure, Slack, Atlassian Jira, AWS EventBridge, Email Notifications, Mobile Push Notifications, Opsgenie, PagerDuty, ServiceNow, and Prometheus.
Pros and Cons
Pros:
- Provides real-time monitoring and insights
- Offers robust alerting features
- Integrates well with various platforms
Cons:
- The user interface can be overwhelming for new users
- Dashboards may require customization for specific use cases

Raygun provides software intelligence and performance monitoring tools to ensure applications run at peak performance. By focusing on insights from actual user interactions, Raygun gives developers a clear view of how users experience their software.
Why I Picked Raygun: When selecting monitoring tools for real user insights, Raygun caught my attention. I determined that its emphasis on genuine user interactions sets it apart from the crowd. Based on its unparalleled approach to capturing real-time user experiences and feedback, I've come to the opinion that Raygun is the best for gaining real user experience insights.
Standout Features & Integrations:
Raygun offers Crash Reporting, allowing developers to diagnose and fix errors before they reach users. Its Real User Monitoring feature gives insights into how users are truly experiencing your software, enabling optimizations based on actual usage patterns.
For integrations, Raygun works well with popular platforms such as GitHub, Slack, and Jira, streamlining the software development and monitoring process.
Pros and Cons
Pros:
- Strong integrations with leading development tools
- Real User Monitoring provides genuine insights
- Detailed Crash Reporting for proactive error handling
Cons:
- Some features might be redundant for simpler applications
- The interface can be complex for first-time users
- Might be overwhelming for smaller teams without dedicated IT personnel

Uptrends is a specialized tool focused on ensuring the accessibility and performance of web applications. This platform keeps a vigilant eye on web application availability, taking into account speed, uptime, and functionality, making it an ideal choice for organizations that prioritize the health of their web-based assets.
Why I Picked Uptrends: When I was determining which tools to include on this list, Uptrends caught my attention due to its comprehensive web application monitoring capabilities. Comparing various platforms, Uptrends has a distinct edge, particularly in its detailed reports and alerts about web application status. I judged that Uptrends is best for those who require a tool specifically designed for monitoring web applications.
Standout Features & Integrations:
Uptrends offer real user monitoring, giving insights into how actual visitors experience a website. The tool also has a multi-browser synthetic monitoring feature, which simulates visitor interaction across different browsers like Chrome.
Integrations-wise, Uptrends can be connected to popular communication tools like Slack, PagerDuty, and Microsoft Teams for immediate alert notifications.
Pros and Cons
Pros:
- Compatibility with multiple browsers for synthetic monitoring
- Real user monitoring offers genuine insights
- Detailed web application monitoring reports
Cons:
- Some integrations may require manual configuration
- Advanced features can incur additional costs
- The interface might seem overwhelming for beginners
Other Website Monitoring Tools
Here are some additional website monitoring tool options that didn’t make it onto my shortlist, but are still worth checking out:
- ThousandEyes
For comprehensive web performance monitoring
- Sematext
For integrating server and website metrics
- Uptime
For detailed reporting features
- Apica
For scalable performance testing
- Paessler PRTG
For 24/7 website availability monitoring
- Dotcom Monitor
For real-world speed simulations
- GTmetrix
Good for detailed website speed analysis
- Checkmk
Good for versatile IT infrastructure monitoring
- MonSpark
Good for proactive website performance insights
- Elastic Observability
Good for unified views across your tech stack
- Dotcom-Monitor
Good for multi-faceted web service insights
- SolarWinds Website Performance Monitoring Tool
Good for in-depth web performance metrics
- Pulsetic
Good for visualizing website user journeys


Other Monitoring Tool Reviews
Website Monitoring Tool Selection Criteria
When selecting the best website monitoring tool to include in this list, I considered common buyer needs and pain points like ensuring uptime and detecting performance issues. I also used the following framework to keep my evaluation structured and fair:
Core Functionality (25% of total score)
To be considered for inclusion in this list, each solution had to fulfill these common use cases:
- Monitor website uptime
- Track page load speed
- Alert for downtime
- Provide performance analytics
- Support multiple websites
Additional Standout Features (25% of total score)
To help further narrow down the competition, I also looked for unique features, such as:
- Real-time user monitoring
- Customizable alert settings
- Geographic performance insights
- Integration with third-party tools
- Advanced reporting capabilities
Usability (10% of total score)
To get a sense of the usability of each system, I considered the following:
- Intuitive interface design
- Ease of navigation
- Customizable dashboards
- User-friendly setup process
- Clear data visualization
Onboarding (10% of total score)
To evaluate the onboarding experience for each platform, I considered the following:
- Availability of training videos
- Interactive product tours
- Comprehensive documentation
- Access to webinars and tutorials
- Support from chatbots or live help
Customer Support (10% of total score)
To assess each software provider’s customer support services, I considered the following:
- 24/7 support availability
- Multiple support channels
- Responsiveness of support team
- Access to a knowledge base
- Quality of troubleshooting guides
Value For Money (10% of total score)
To evaluate the value for money of each platform, I considered the following:
- Competitive pricing plans
- Features included in basic packages
- Flexibility of subscription options
- Discounts for long-term commitments
- Free trial or demo availability
Customer Reviews (10% of total score)
To get a sense of overall customer satisfaction, I considered the following when reading customer reviews:
- User feedback on reliability
- Comments on ease of use
- Satisfaction with customer support
- Insights on feature effectiveness
- Overall value perception
How to Choose Website Monitoring Tool
It’s easy to get bogged down in long feature lists and complex pricing structures. To help you stay focused as you work through your unique software selection process, here’s a checklist of factors to keep in mind:
| Factor | What to Consider |
|---|---|
| Scalability | Can the tool handle your website's growth? Ensure it supports increasing traffic and additional monitoring needs without extra costs or complexity. |
| Integrations | Does it work with your existing systems? Check compatibility with your current tech stack to avoid integration headaches and extra workarounds. |
| Customizability | Can you tailor alerts and dashboards? Look for tools that let you adjust settings to match your team’s workflow and reporting needs. |
| Ease of use | Is the interface intuitive? A tool should be user-friendly, allowing your team to quickly access and interpret data without extensive training. |
| Implementation and onboarding | How fast can you get started? Evaluate the setup time, available support, and resources like tutorials or templates to ease the transition. |
| Cost | Does it fit your budget? Compare pricing models, watch for hidden fees, and consider long-term costs vs. benefits, including any free trial offers. |
| Security safeguards | How does it protect your data? Ensure it complies with your security standards, offering features like encryption, regular updates, and backups. |
What Is a Website Monitoring Tool?
A website monitoring tool is software that tracks and analyzes the performance and uptime of websites. IT professionals, web developers, and site administrators typically use these tools to ensure their sites are running smoothly and efficiently. Uptime monitoring, load speed analysis, and alert notifications help with identifying issues and maintaining optimal performance. Overall, these tools provide peace of mind by ensuring websites function correctly and reliably.
Features
When selecting website monitoring tool, keep an eye out for the following key features that work alongside hardware monitoring software:
- Uptime monitoring: Tracks your website’s availability and alerts you if it goes down, ensuring minimal downtime.
- Response time tracking: Measures how quickly your website responds to user requests, helping you maintain a fast user experience.
- Alert notifications: Sends alerts via email, SMS, or other channels when issues are detected, so you can act swiftly.
- Performance reporting: Provides detailed reports on website performance, enabling data-driven decisions for improvements.
- Multi-location monitoring: Checks your website’s availability from different geographic locations, ensuring global accessibility.
- Customizable dashboards: Allows you to tailor data views to match your team’s needs, making information easy to digest.
- Advanced analytics: Offers deeper insights into performance trends, helping identify and resolve potential issues.
- API access: Integrates monitoring data with other systems, enabling a cohesive tech environment.
- Historical data storage: Keeps records of past performance data, aiding in long-term analysis and planning.
- Synthetic monitoring: Simulates user interactions to detect potential issues before they affect real users.
Benefits
Implementing website monitoring tool provides several benefits for your team and your business. Here are a few you can look forward to:
- Improved uptime: By receiving instant alerts, you can address issues quickly and keep your website running smoothly.
- Faster issue resolution: With response time tracking, you can pinpoint slowdowns and fix them before they impact users.
- Enhanced user experience: Monitoring tools ensure that your site is fast and accessible, keeping visitors satisfied.
- Data-driven insights: Performance reporting and advanced analytics provide valuable information for optimizing your website.
- Global reach: Multi-location monitoring ensures your site’s availability worldwide, expanding your audience.
- Informed decision-making: Historical data storage allows you to analyze trends and plan improvements based on past performance.
- Proactive problem-solving: Synthetic monitoring helps identify potential issues before they affect real users, reducing future disruptions.
Costs and Pricing
Selecting website monitoring tool requires an understanding of the various pricing models and plans available. Costs vary based on features, team size, add-ons, and more. The table below summarizes common plans, their average prices, and typical features included in website monitoring tool solutions:
Plan Comparison Table for Website Monitoring Tool
| Plan Type | Average Price | Common Features |
|---|---|---|
| Free Plan | $0 | Basic uptime monitoring, limited alert notifications, and restricted data storage. |
| Personal Plan | $5-$25/user/month | Uptime and response time tracking, customizable alerts, and performance reporting. |
| Business Plan | $50-$100/user/month | Multi-location monitoring, advanced analytics, and API access. |
| Enterprise Plan | $200-$500/user/month | Customizable dashboards, synthetic monitoring, comprehensive support, and extensive historical data storage. |
Website Monitoring Tool FAQs
Here are some answers to common questions about website monitoring tool:
How does website downtime affect my business?
Website downtime can lead to lost revenue, damage to your brand’s reputation, and decreased customer satisfaction. Even short outages may frustrate users and cause them to seek alternatives. Regular monitoring helps you quickly address issues and minimize these impacts.
What are common error codes I should monitor?
Common error codes include 404 (not found), 401 (unauthorized), and 500 (internal server error). Monitoring these helps you identify issues like broken links, unauthorized access attempts, and server problems that need immediate attention.
How do alert notifications work?
Alert notifications inform you of issues like downtime or performance drops. You can receive alerts via email, SMS, or other methods. Setting up these alerts ensures you’re aware of problems as soon as they occur, allowing for quick resolution.
What is server monitoring and why is it important?
Server monitoring tracks the performance of your server’s resources, like CPU, RAM, and disk usage. It helps you detect and resolve potential issues before they affect website performance, ensuring your site remains accessible and responsive.
How can SSL monitoring benefit my website?
SSL monitoring checks the validity and expiration of your SSL certificates. It ensures secure user connections and prevents issues like expired certificates, which can lead to trust warnings and potential data breaches.
What is the content match feature in website monitoring?
The content match feature checks your website for specific strings or content. It’s useful for ensuring that essential information is displayed correctly and hasn’t been altered, helping maintain the integrity and reliability of your site.
What’s Next:
If you're in the process of researching website monitoring tool, connect with a SoftwareSelect advisor for free recommendations.
You fill out a form and have a quick chat where they get into the specifics of your needs. Then you'll get a shortlist of software to review. They'll even support you through the entire buying process, including price negotiations.