10 Mejores Herramientas de Monitorización de Sistemas Analizadas en 2026

10 Lista seleccionada de las mejores herramientas de supervisión de sistemas


Las herramientas de supervisión de sistemas te ayudan a seguir la salud y el rendimiento de tu infraestructura, para que puedas detectar y solucionar problemas antes de que afecten a los usuarios.
Muchos equipos recurren a estas herramientas cuando tienen dificultades con caídas inesperadas, sistemas lentos o visibilidad limitada de la actividad de la red. Sin la solución adecuada, es difícil saber qué está fallando o incluso por dónde empezar a buscar.
He colaborado con equipos de SaaS y proveedores de servicios gestionados (MSP) para evaluar e implementar plataformas de supervisión que reducen el tiempo de inactividad y aceleran los tiempos de respuesta. Esta guía comparte lo que he aprendido para ayudarte a encontrar una herramienta que se adapte a tu sistema y tu flujo de trabajo.
Table of Contents
- Mejor Resumen de Herramientas
- Por Qué Confiar en Nosotros
- Comparar Especificaciones
- Reseñas
- Otras Herramientas de Monitorización de Sistemas
- Reseñas Relacionadas
- Criterios de Selección
- Cómo Elegir
- ¿Qué Son las Herramientas de Monitorización de Sistemas?
- Características
- Beneficios
- Costos y Precios
- Preguntas Frecuentes
Por qué confiar en nuestras reseñas de software
Llevamos probando y revisando software desde 2023. Como líderes tecnológicos, sabemos lo crítico y difícil que es tomar la decisión correcta al seleccionar software.
Invertimos en una investigación profunda para ayudar a nuestra audiencia a tomar mejores decisiones de compra de software. Hemos probado más de 2,000 herramientas para diferentes casos de uso tecnológicos y escrito más de 1,000 reseñas de software exhaustivas. Descubre cómo mantenemos la transparencia y nuestra metodología de revisión de software.
Resumen de las mejores herramientas de supervisión de sistemas
Esta tabla comparativa resume los detalles de precios de mis principales selecciones de herramientas de supervisión de sistemas para ayudarte a encontrar la mejor para tu presupuesto y las necesidades de tu negocio.
| Tool | Best For | Trial Info | Price | ||
|---|---|---|---|---|---|
| 1 | Best for remote monitoring and management | 30-day free trial + free demo available | From $129/technician/month (billed annually) | Website | |
| 2 | Best with integrated IT asset management | 14-day free trial + free demo available | From $19/agent/month (billed annually) | Website | |
| 3 | Best open-source solution | Free plan available | Pricing upon request | Website | |
| 4 | Best for end-to-end complex IT monitoring | Free plan + 30-day free trial available | From $275/month (billed annually) | Website | |
| 5 | Best for real-time error tracking | Free plan + free trial + free demo available | From $26/month (billed annually) | Website | |
| 6 | Best for distributed network monitoring | Free demo available | From $245/25 devices | Website | |
| 7 | Best for simple, centralized system monitoring | 30-day free trial | From $179/month (billed annually) | Website | |
| 8 | Best for AI-driven full-stack monitoring | Free trial available | From $7/host/month | Website | |
| 9 | Best for application performance metrics | Free plan available | From $15/host/month (billed annually) | Website | |
| 10 | Best for full-stack infrastructure monitoring | 30-day free trial + free demo available | From $10/month (billed annually) | Website |


-

TestDevLab
Visit Website -
Site24x7
Visit WebsiteThis is an aggregated rating for this tool including ratings from Crozdesk users and ratings from other sites.4.7 -
GitHub Actions
Visit WebsiteThis is an aggregated rating for this tool including ratings from Crozdesk users and ratings from other sites.4.8


Reseñas de las mejores herramientas de supervisión de sistemas
A continuación encontrarás mis resúmenes detallados de las mejores herramientas de supervisión de sistemas que han pasado mi selección inicial. Mis reseñas ofrecen una visión detallada de las características principales, ventajas y desventajas, integraciones y casos de uso ideales de cada herramienta para ayudarte a encontrar la mejor para ti.

Atera is an all-in-one IT management platform built for managed service providers and IT departments who need to monitor, manage, and support endpoints and networks from a single dashboard.
Who Is Atera Best For?
Atera is a strong fit for MSPs and internal IT teams that manage multiple endpoints across distributed environments.
Why I Picked Atera
I picked Atera as one of the best for remote monitoring and management because its RMM agent provides real-time visibility across distributed endpoints. The agent continuously tracks CPU, RAM, disk usage, network bandwidth, and Windows events, and it goes online in about 1.2 seconds, reducing delay when a device needs attention. Atera's alert management lets you set custom thresholds and receive instant notifications before issues impact users, offering a proactive approach for managing devices across multiple sites. Built-in remote access options—Splashtop, AnyDesk, TeamViewer, and ScreenConnect—let my team start remote sessions without switching between tools.
Atera Key Features
- IT automation: Schedule and run automated scripts across devices for tasks like onboarding, software deployment, and routine maintenance.
- SNMP monitoring: Track routers, firewalls, printers, and other network devices using automatic OID monitoring on Linux-based systems.
- Patch management: Automate Windows, macOS, and Linux software patches across all managed endpoints from a single dashboard.
- AI Copilot: Get AI-generated issue summaries and suggested resolutions to move from alert to fix faster during active incidents.
Atera Integrations
Integrations include Splashtop, TeamViewer, AnyDesk, ScreenConnect, Webroot, Bitdefender, Acronis, QuickBooks, Xero, and Domotz.
Pros and Cons
Pros:
- Consolidates IT management into a single platform, simplifying operations.
- Built-in asset and software inventory gives visibility into hardware and software deployments.
- Threshold alerts and remote maintenance tools reduce response time for device incidents.
Cons:
- Less granular control for highly complex custom workflows or integrations.
- Project management and complex SLA tracking are relatively limited.
New Product Updates from Atera

Atera Adds Multiple API Tokens With Access Controls
Atera now supports multiple API tokens with configurable expiration dates, IP restrictions, and permission scopes, giving teams tighter control and safer delegation of API access. For more information, visit Atera's official site.
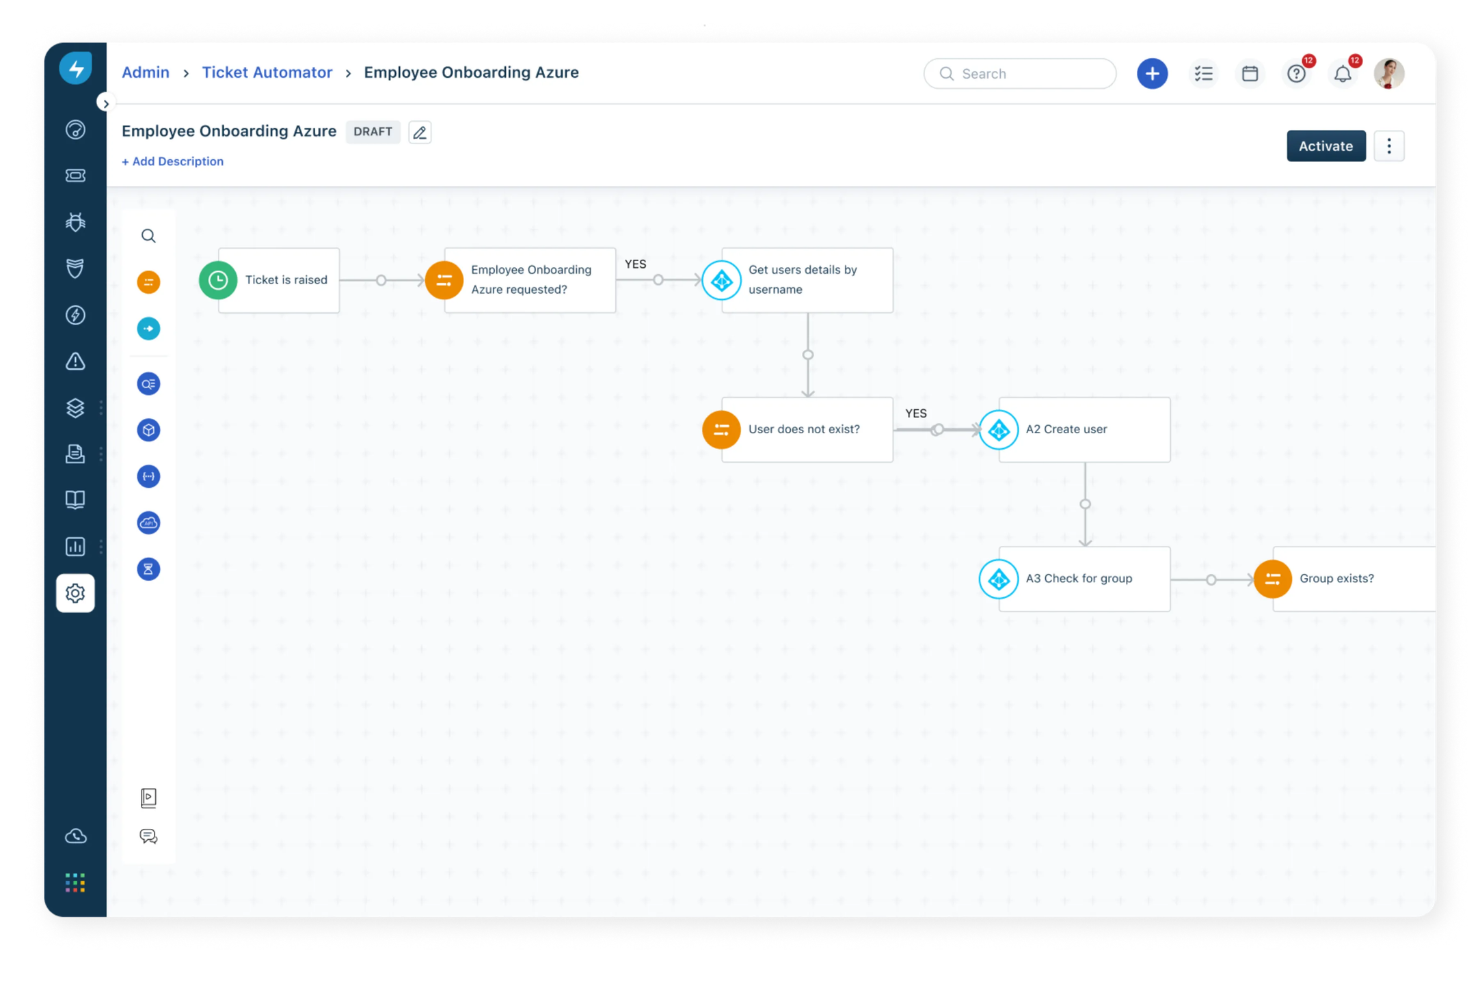
Freshservice is an IT service management platform that also supports system monitoring through its ITOM capabilities. It’s not a dedicated monitoring tool, but it works well for teams that want to bring alerts, service health, asset data, and incident workflows into one place. Instead of focusing on deep infrastructure metrics, it helps teams understand what an alert means in the context of their services and systems.
Who Is Freshservice Best For?
Freshservice suits IT teams in mid-sized to large organizations that already run a service desk and want to connect monitoring signals with incident management, asset tracking, and change workflows. It’s especially useful for teams managing internal IT services or distributed environments where understanding impact matters as much as detecting issues.
Why I Picked Freshservice
I picked Freshservice because it adds useful context to monitoring data once an alert comes in. Being able to link incidents to specific assets and see how those assets relate to other systems through the CMDB makes it easier to understand what’s actually affected and respond accordingly. It’s a good fit for teams that need to coordinate response, not just detect problems.
Freshservice Key Features
- Automated alerting: Get real-time notifications for incidents and system events.
- Customizable dashboards: Build visual dashboards to monitor key metrics and system health.
- Service request management: Track and manage IT service requests from a unified interface.
- Change management module: Plan, approve, and document changes to your IT environment.
Freshservice Integrations
Freshservice offers native integrations with Microsoft Teams, SecPod, Slack, TeamViewer, Jira, and Azure AD. Connector apps and APIs are available for custom integrations and workflow automations.
Pros and Cons
Pros:
- Connects alerts with incidents, assets, and service context
- Useful for teams that want monitoring tied into ITSM workflows
- Strong CMDB and asset tracking compared to most monitoring tools
Cons:
- Not a full-featured monitoring platform for logs, traces, or deep infrastructure metrics
- Relies on integrations for most monitoring data collection
New Product Updates from Freshservice
 Experience)
Freshservice Introduces a Reimagined IT Asset Management (ITAM) Experience
Freshservice introduces a reimagined IT Asset Management (ITAM) experience with continuous infrastructure discovery, dependency mapping, IPAM, and Software License Management. This update helps teams improve asset visibility and manage connected IT environments more effectively. For more information, visit Freshservice’s official site.

Icinga is an open-source monitoring solution designed for complex IT environments. It offers a comprehensive monitoring stack that covers infrastructure, cloud, and application monitoring, making it a versatile choice for businesses across different industries.
Why I Picked Icinga: I chose Icinga because of its configuration automation features tailored for system monitoring. With versioned config tracking and rollback, your team can safely test changes, know who altered what, and revert if needed—perfect for managing complex setups. Additionally, the Icinga director automates host and service object creation by importing inventory or CMDB data, ensuring your checks always stay up to date.
It also provides support for cloud environments—whether private, public, or hybrid. Dedicated modules connect to vSphere, AWS, Azure, GCP, and OpenStack, so your agents work the same no matter where they're deployed.
Standout Features & Integrations:
Other features include built‑in log and metrics handling using modules like icingabeat, elasticsearch, logstash, and graphite writers to pull context from logs and performance data into monitoring dashboards. It even provides customizable dashboards with filter editors and widgets that let you focus on specific contexts and trends.
Some of Icinga's integrations include Grafana, AWS, Azure, Puppet, Ansible, Chef, Terraform, Jira, PagerDuty, ServiceNow, BigPanda, and Stackstorm.
Pros and Cons
Pros:
- Free to use with no setup fees
- Scalable for both small and large environments
- Highly customizable for various IT infrastructure needs
Cons:
- Occasional performance issues reported during high-load scenarios
- Setup and configuration comes with a learning curve
New Product Updates from Icinga
Icinga Adds OpenTelemetry Support
Icinga introduces OpenTelemetry metrics support, HTTP response streaming, and key system updates. These improvements enhance performance, scalability, and integration with modern monitoring tools. For more information, visit Icinga’s official site.
 .
.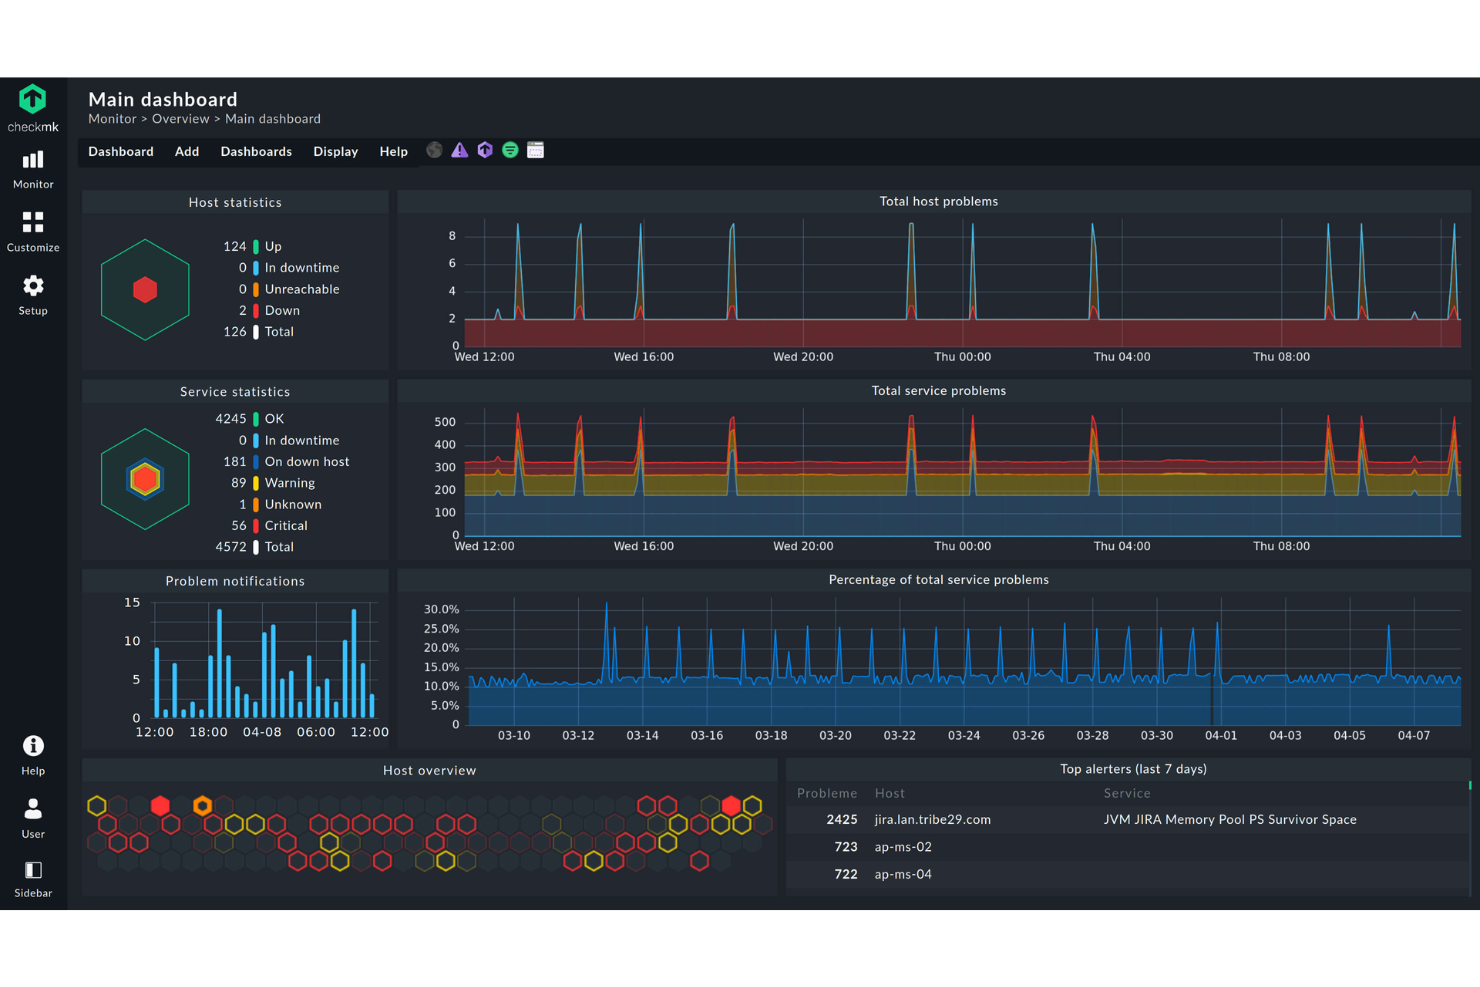
Checkmk is a monitoring platform built for IT teams and managed service providers who need to track servers, networks, applications, and cloud resources across complex environments, helping them detect issues promptly and maintain system health.
Who Is Checkmk Best For?
Checkmk is a strong fit for mid-size to large IT teams and MSPs managing hybrid or multi-cloud environments with a high volume of monitored hosts.
Why I Picked Checkmk
Checkmk earns its spot on my shortlist because it genuinely covers end-to-end monitoring across the full IT stack—servers, networks, containers, cloud services, and business processes—without requiring separate tools for each layer. I particularly like its auto-discovery feature, which automatically detects hosts and services and recommends relevant metrics and thresholds, so my team isn't spending hours on manual configuration in large environments. The business process monitoring capability is also something I find hard to replicate elsewhere—it lets you map application dependencies into a single aggregated view and even simulate worst-case failure scenarios in real time. On top of that, the distributed architecture scales to hundreds of sites and millions of devices, which matters when you're managing infrastructure that spans multiple data centers or regions.
Checkmk Key Features
- Log monitoring: Collects and filters events from syslog, SNMP traps, Windows event logs, and log files, collapsing duplicate entries to reduce alert noise.
- Predictive analytics: Analyzes historical data to forecast resource consumption and dynamically adjusts thresholds based on past events.
- Hardware and software inventory: Automatically identifies and tracks all hardware and software assets, monitoring changes and integrating data into your CMDB view.
- Customizable dashboards: Provides out-of-the-box and fully customizable dashboards for AWS, Azure, Linux, Windows, and Kubernetes environments, with interactive HTML5 graphs.
Checkmk Integrations
Integrations include AWS, Azure, Google Cloud Platform, VMware vSphere, Docker, Kubernetes, Microsoft SQL Server, Oracle Database, SAP HANA, and Cisco.
Pros and Cons
Pros:
- Flexible monitoring options that support custom setups
- Real-time dashboard updates for better infrastructure visibility
- Supports tailored monitoring configurations for complex environments
Cons:
- Interface may feel confusing at first
- Limited guidance and documentation for beginners

Sentry lets developers and IT teams monitor, diagnose, and resolve application errors and performance issues across web, mobile, and backend systems, helping you catch problems before they impact users.
Who Is Sentry Best For?
Sentry is a strong fit for software development and DevOps teams who need deep visibility into application health across multiple environments and codebases.
Why I Picked Sentry
I picked Sentry as one of the best because of how it handles real-time error tracking with actual context, not just raw log data. When an error fires in production, Sentry captures the full stack trace, local variables, breadcrumbs, and user actions leading up to the crash—so my team isn't left guessing what happened. I also like the release health monitoring, which tracks crash-free session rates and version adoption in real time, so you can spot the moment a new deploy starts degrading. Seer, Sentry's AI debugging agent, analyzes stack traces, logs, and commit history to automatically pinpoint root causes and suggest fixes—cutting down the time between "something broke" and "here's why."
Sentry Key Features
- Distributed tracing: Follow a single request across multiple services with waterfall trace views that pinpoint exactly where latency or errors are introduced.
- Custom metrics and span monitoring: Define and track performance indicators specific to your app, like slow database queries or unresponsive API calls, down to the code level.
- User impact prioritization: Automatically surface issues affecting the largest number of users so your team can triage what to fix first.
- Distributed log correlation: Link logs directly to the specific traces and issues causing performance drops, replacing manual log searches.
Sentry Integrations
Integrations include GitHub, Jira, Slack, GitLab, Microsoft Teams, PagerDuty, Bitbucket, Discord, Asana, and Datadog.
Pros and Cons
Pros:
- Integrates with many popular development and communication tools
- Contextual data assists in replicating and resolving issues
- Detailed stack traces provide precise error locations
Cons:
- Some users have mentioned a desire for more flexible alerting options
- Larger teams might find the need to upgrade for more events
- Might be overwhelming for beginners due to its extensive features
New Product Updates from Sentry

Sentry Adds Log Export in CSV and JSONL
Sentry now supports exporting up to 10,000 log lines from Explore → Logs in CSV or JSON Lines, with downloads available in-browser or as background downloads and email. For more information, visit Sentry's official site.
 .
.
ManageEngine OpManager gives IT teams and network administrators a unified platform to monitor network devices, servers, and critical infrastructure, helping organizations rapidly detect and resolve performance issues across complex environments.
Who Is ManageEngine OpManager Best For?
ManageEngine OpManager is a strong fit for mid-size to large enterprises that need centralized visibility across multiple sites, branch offices, or geographically distributed network infrastructure.
Why I Picked ManageEngine OpManager
I picked ManageEngine OpManager as one of the best because of how well its probe-central architecture handles distributed network monitoring at scale. When you're managing infrastructure across multiple branch offices or data centers, OpManager deploys probes at each remote site that handle local discovery, mapping, and fault monitoring—then feed everything back to a single central dashboard. I like that the central server gives you full visibility into device health, CPU, memory, and disk utilization per probe without needing to log into each site separately. Additionally, any configuration changes or policy updates pushed from the central server automatically propagate to all connected probes, which cuts down on configuration drift that causes headaches in multi-site environments.
ManageEngine OpManager Key Features
- Network mapping: Automatically generates L1/L2 topology maps to visualize device relationships and pinpoint the source of outages or performance degradation.
- Adaptive thresholds: Uses ML to learn utilization patterns and set dynamic alert thresholds, reducing false positives from static threshold configurations.
- IT workflow automation: Lets you build automated responses to fault conditions, such as running diagnostic scripts or restarting services when specific alerts trigger.
- Storage capacity forecasting: Analyzes historical usage trends to predict when storage resources will be exhausted before they actually run out.
ManageEngine OpManager Integrations
Integrations include ServiceDesk Plus, NetFlow Analyzer, Network Configuration Manager, OpUtils, AlarmsOne, Applications Manager, Firewall Analyzer, Analytics Plus, AssetExplorer, and Zoho Creator.
Pros and Cons
Pros:
- Real-time, auto-updating network maps
- Supports multiple vendor environments
- Automated, scheduled network discovery
Cons:
- Initial setup can be complex
- Pricing may be high for small teams
New Product Updates from ManageEngine OpManager
ManageEngine OpManager Vendor Templates and NCM XML Import
ManageEngine OpManager introduces enhanced vendor template integration and device template import for the NCM module using XML files. This update helps teams improve device classification and speed up configuration workflows. For more information, visit ManageEngine OpManager’s official site.
 .
.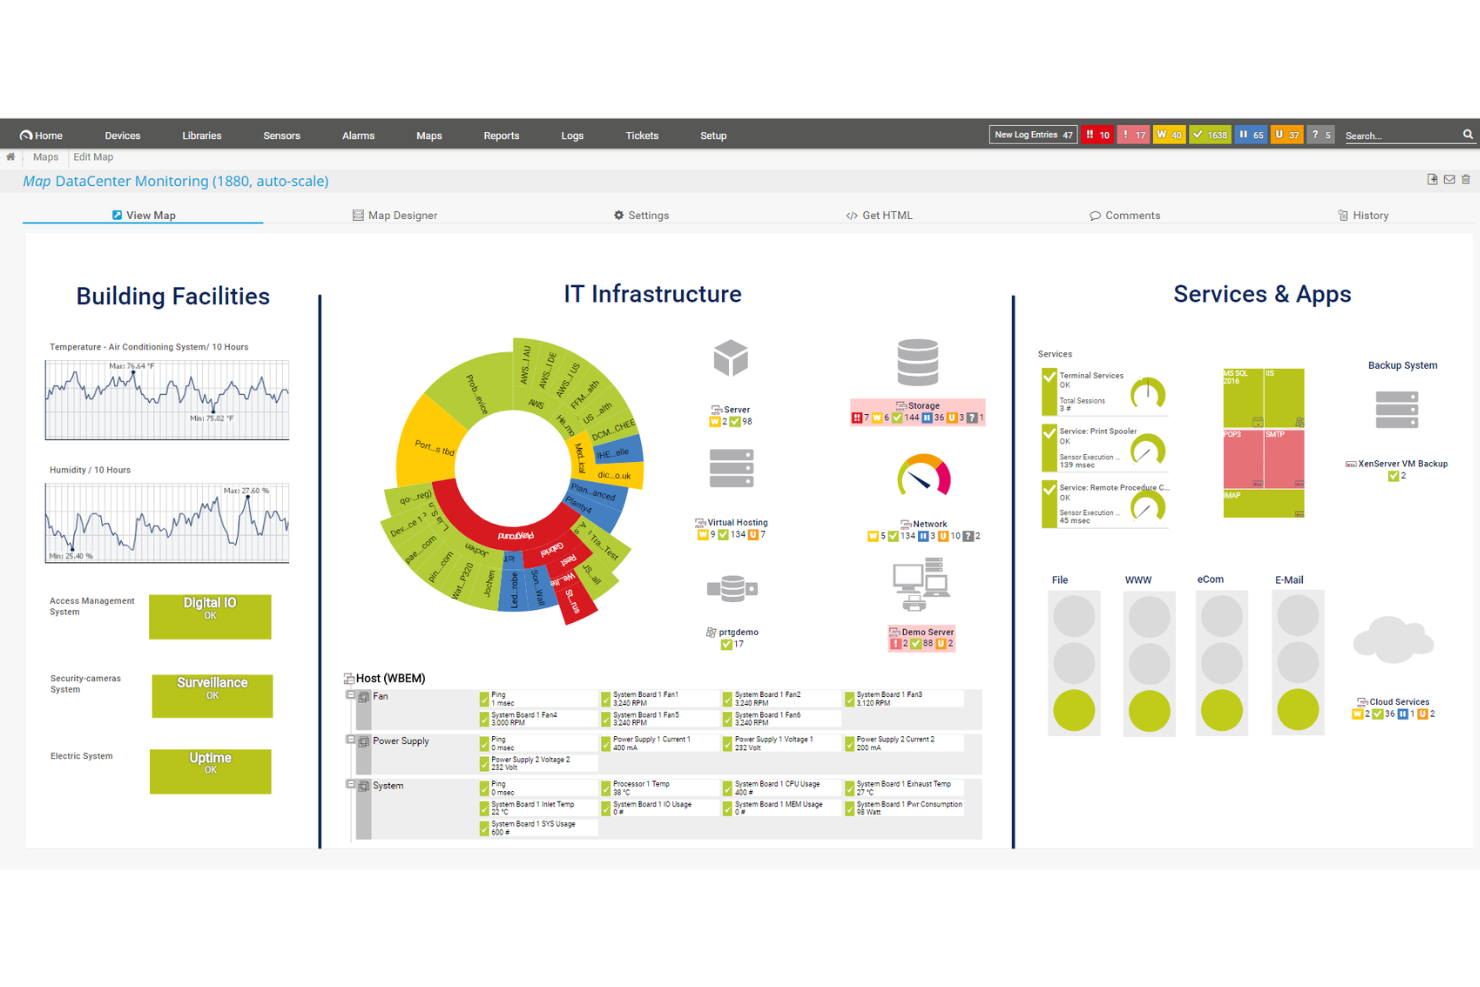
PRTG gives IT teams and system administrators a unified platform to monitor networks, servers, and applications, helping businesses of all sizes detect issues and maintain reliable infrastructure.
Who Is PRTG Best For?
PRTG is a good fit for IT teams in small to mid-sized businesses that need a straightforward way to monitor their entire infrastructure from one place.
Why I Picked PRTG
PRTG earns its spot on my shortlist because of how well it pulls everything into one place without requiring a complex setup. I like that its auto-discovery feature scans your network and automatically configures sensors for detected devices, so my team isn't spending hours manually adding servers, switches, and endpoints. The library of over 250 pre-configured sensors covers everything from SNMP traffic and CPU load to VMware environments and MQTT-based IoT devices. On top of that, the distributed monitoring feature lets me manage remote locations and branch offices through a single dashboard using remote probes, which collect data locally and send it back to a central PRTG installation.
PRTG Key Features
- Custom alerting thresholds: Set specific thresholds for any sensor so PRTG triggers notifications via email, push, SMS, or HTTP request when a metric crosses your defined limit.
- Customizable reporting: Build and schedule reports using customizable templates that pull live sensor data to share infrastructure status with stakeholders.
- AI-driven anomaly detection: PRTG uses AI-based baselines that adapt to your environment to flag unusual behavior without requiring manual threshold configuration.
- Maps and dashboards: Design real-time network maps using a drag-and-drop map designer that displays live device status across your infrastructure.
PRTG Integrations
Integrations include Amazon Web Services (AWS), Microsoft Azure, VMware, Cisco, HPE, Dell, NetApp, IBM, Oracle, and SAP.
Pros and Cons
Pros:
- Scalable to accommodate growing network demands
- Customizable dashboards and real-time alerts
- Supports multiple monitoring technologies
Cons:
- Licensing based on sensors can become expensive for larger networks
- Initial setup can be time-consuming
New Product Updates from PRTG
PRTG Introduces New Monitoring Sensors In Beta
This week, PRTG introduces three BETA sensors that broaden your monitoring scope for Proxmox VE clusters and SIMATIC S7-300/400 PLCs, giving you deeper operational insights. For more information, visit PRTG’s official site.
 .
.
Dynatrace gives IT teams and enterprises a unified platform to monitor infrastructure, applications, and user experience, helping them detect, analyze, and resolve performance issues across complex, modern environments.
Who Is Dynatrace Best For?
Dynatrace is a strong fit for large enterprises and cloud-native organizations running complex, distributed environments that need deep, automated observability across their full technology stack.
Why I Picked Dynatrace
Dynatrace earns its spot on my shortlist because of how its AI engine, Davis, goes beyond alerting to deliver precise root cause analysis automatically. When an incident fires, Davis doesn't just surface a list of anomalies—it traces the causal chain across your full stack and pinpoints the exact source, cutting mean time to recovery significantly. I also like the OneAgent deployment model, where a single agent install on a host continuously collects metrics, traces, logs, and topology data across the entire application delivery chain without manual instrumentation. Smartscape builds a real-time dependency map of your environment, so when something breaks, you already have the context to understand what's affected and why.
Dynatrace Key Features
- PurePath distributed tracing: Captures end-to-end timing and code-level context for every distributed trace across your full stack, without sampling.
- Log analytics: Ingests, indexes, and correlates log data in real time alongside metrics and traces within a single unified view.
- Digital experience monitoring: Tracks real user sessions and synthetic transactions to measure front-end performance across browsers and mobile apps.
- OpenPipeline data ingestion: Processes, enriches, and contextualizes streaming observability data from any source before it reaches storage or analytics.
Dynatrace Integrations
Integrations include AWS, Azure, Google Cloud, Jira, Slack, GitHub Copilot, PagerDuty, JetBrains, Cursor IDE, and Windsurf.
Pros and Cons
Pros:
- Extensive integrations with major cloud platforms
- Offers a holistic view of digital environments, from cloud to user experience
- Davis AI provides real-time autonomous problem detection and diagnosis
Cons:
- Some users might find the initial setup and configuration challenging
- Might be over-comprehensive for smaller businesses or simpler setups
- Absence of transparent pricing might deter potential users

Datadog is a cloud-based monitoring and analytics platform that provides deep insights into the performance of applications. It consolidates metrics, traces, and logs into a unified platform, making it especially potent for application performance monitoring, aligning with its strength in gauging metrics.
Why I Picked Datadog: When determining the best tools for monitoring, Datadog emerged prominently in my analysis. I judged its ability to offer granular, real-time insights into applications as a primary differentiator. Based on the depth and breadth of its capabilities, I found it best suited for application performance metrics.
Standout Features & Integrations:
Datadog is renowned for its APM (Application Performance Monitoring) which offers detailed performance insights and root cause analysis. Its distributed tracing and real-time analytics equip teams to understand bottlenecks in the application workflow. Complementing its core functionality, Datadog integrates with a plethora of services, including AWS, Azure, and Google Cloud, and offers a rich set of API integrations.
Pros and Cons
Pros:
- Customizable dashboards tailored to unique monitoring needs
- Broad range of integrations with cloud providers and other services
- Robust APM with insightful data visualization
Cons:
- Some users report occasional delays in metric updates
- Steeper learning curve for full utilization of its features
- Might be pricey for smaller teams or projects
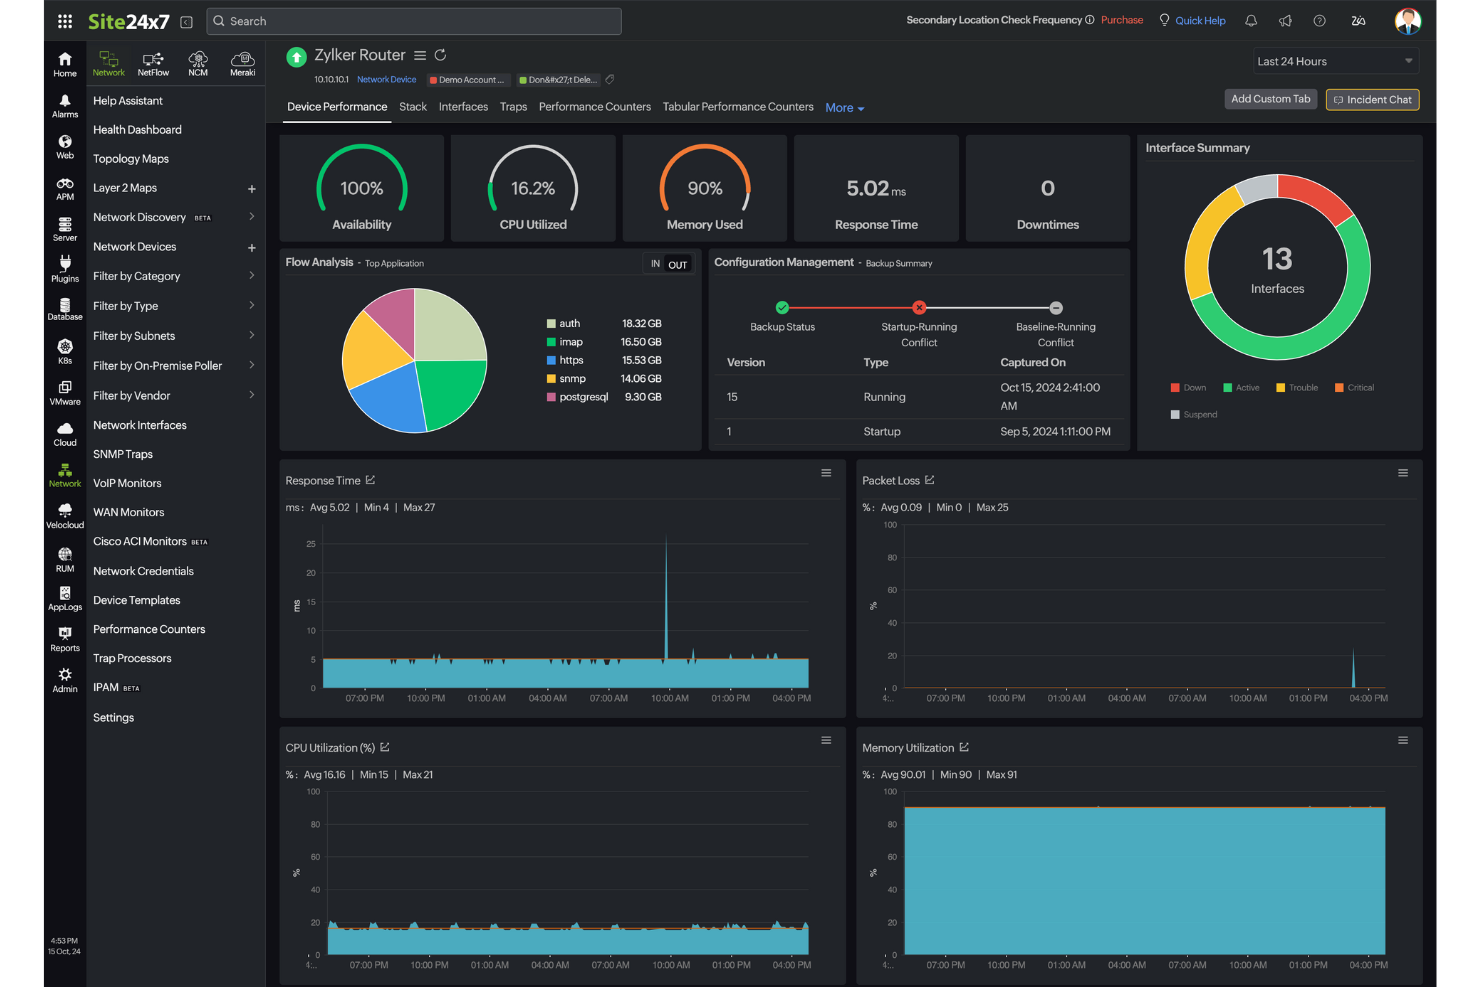
Site24x7 gives IT teams and managed service providers a unified platform to monitor servers, networks, applications, and cloud resources, helping you detect and resolve performance issues across your entire technology stack.
Who Is Site24x7 Best For?
Site24x7 is a strong fit for IT teams and MSPs managing mixed environments that span on-premises infrastructure, cloud platforms, and web applications.
Why I Picked Site24x7
Site24x7 earns its spot on my shortlist because it covers the full infrastructure stack from a single console—servers, networks, containers, cloud platforms, and applications all in one place. I particularly like the AIOps-driven anomaly detection, which uses ML to flag deviations from dynamic baselines rather than relying on static thresholds you have to manually configure. This lets my team catch a memory leak or unusual traffic spike before it cascades into an outage. The correlated metrics, traces, and logs view is also helpful—when something breaks, I'm not jumping between three different tools to piece together what happened.
Site24x7 Key Features
- Network performance monitoring: Analyzes device performance from over 450 vendors using more than 15,000 device templates at both the device and interface levels.
- Real user monitoring: Tracks how end users experience your websites across geographies, devices, browsers, and ISPs, including session replays and JavaScript error tracking.
- Network configuration management: Automates configuration backups, detects unauthorized changes, identifies firmware vulnerabilities, and tracks compliance from one place.
- Log management: Collects and indexes logs from servers, applications, networks, and cloud services into a centralized console with query-based search and dashboard visualization.
Site24x7 Integrations
Integrations include ServiceNow, PagerDuty, Opsgenie, Jira, Slack, Microsoft Teams, Zendesk, Freshservice, Splunk On-Call (VictorOps), and Discord.
Pros and Cons
Pros:
- Flexible monitoring integrates easily with multiple infrastructure components
- Quick setup process covers websites and cloud resource monitoring
- AI-powered full-stack monitoring supports multicloud infrastructure management
Cons:
- Pricing structure becomes expensive due to multiple monitor types
- Alert bugs cause issues when adding new monitoring configurations
New Product Updates from Site24x7
Site24x7 Adds Synchronization Statuses for MSPs
Site24x7 now provides MSPs enhanced alerts and synchronization statuses in a centralized notification center to spot configuration sync issues sooner and accelerate incident response. For more information, visit Site24x7's official site.

Otras herramientas de supervisión de sistemas
Aquí hay algunas opciones adicionales de herramientas de supervisión de sistemas que no entraron en mi lista principal, pero que aún vale la pena revisar:
- Zabbix
For scalable monitoring solutions
- Nagios
For comprehensive IT infrastructure monitoring
- New Relic
For infrastructure health insights
- Prometheus
For reliable alerting and querying
- Grafana Labs
For visualizing metrics
- Zenoss
For cloud-native IT operations
- Lakeside
For digital experience analytics
- LibreNMS
For open-source network monitoring
- AppDynamics
Good for in-depth application performance monitoring
- Cacti
Good for visualizing network performance metrics
- Observium
Good for detailed network health insights
- OpenNMS
Good for scalable enterprise-grade network management
- Sysdig
Good for container and microservices monitoring
- Munin
Good for tracking system resources over time


How I Evaluate System Monitoring Tools
I split my evaluation into two layers: baseline requirements like real-time metrics and cross-platform alerting, and differentiators like AI anomaly detection that make a tool worth recommending.
Core Functionality (Table Stakes For This List)
When I'm selecting tools for my list, I rank each one on a scale from 0 (does not offer the functionality) to 5 (excels in this area) for each core functionality listed below. Then, I calculate the tool's total score into a percentage. Each tool needs to achieve a minimum total score of 75% to be considered for inclusion.
- Real-Time Metrics Collection: I check whether a tool tracks CPU, memory, disk, and network usage with sub-minute granularity—the kind of refresh rate you need during a live incident.
- Alerting & Notifications: Each tool should support configurable threshold alerts across channels like email, Slack, or PagerDuty, with escalation rules to route issues to the right on-call engineer.
- Cross-Platform System Coverage: I evaluate whether the tool monitors physical servers, VMs, containers, and cloud workloads across Linux, Windows, and Unix environments in a single pane.
- Dashboards & Visualization: A good dashboard lets you drill down from a fleet-wide overview to an individual host's memory trend over 30 days, so I look for customizable widgets and historical views.
- Log & Event Tracking: I look for centralized log collection with search and event correlation—features that help you connect a spike in disk I/O to a specific cron job or deployment event.
- Agent & Agentless Data Collection: The tool should offer flexible collection methods, whether that's lightweight agents on production hosts or agentless polling via SNMP, WMI, or SSH for network gear.
Once I have a list of tools that meet this criteria, I consider what sets each platform apart.
Differentiating Factors (What Sets Vendors Apart)
Here's how I compare and contrast different vendors:
Standout Features
AI-powered anomaly detection is a big differentiator. Tools that baseline normal behavior and flag deviations help teams catch issues like a slow memory leak days before it crashes a production host. I also evaluate auto-discovery and topology mapping, which matters when your infrastructure changes frequently through scaling events or deployments. Predictive capacity planning rounds things out by forecasting resource exhaustion, giving IT directors the data they need to justify infrastructure spend before an outage forces the decision.
Beyond Features
Pricing model transparency matters a lot here. Some tools charge per host, others by data volume, and unexpected ingestion spikes can blow a budget overnight. I evaluate whether the pricing scales predictably as your environment grows. Integration depth is another priority—I check for native connections to incident tools like PagerDuty and ITSM platforms like ServiceNow, plus OpenTelemetry support for teams building custom observability pipelines. Deployment flexibility also weighs in, especially for teams running hybrid environments or operating under strict data residency requirements.
Cómo elegir una herramienta de supervisión de sistemas
Es fácil quedarse atascado entre listas interminables de funciones y estructuras de precios complejas. Para ayudarte a mantener el foco durante tu proceso único de selección de software, aquí tienes una lista de factores a tener en cuenta:
| Factor | Qué tener en cuenta |
|---|---|
| Escalabilidad | ¿La herramienta puede crecer con tu negocio? Busca soluciones que manejen un mayor volumen de datos y usuarios sin degradar el rendimiento. Considera las necesidades futuras potenciales. |
| Integraciones | ¿Funciona con tu pila tecnológica actual? Verifica la compatibilidad con el software existente para asegurar un flujo de datos sin problemas y evitar sistemas aislados. |
| Personalización | ¿Puedes adaptarla a tu flujo de trabajo? Evalúa si la herramienta permite modificaciones para ajustarse a tus procesos, evitando soluciones rígidas que te obliguen a adaptarte. |
| Facilidad de uso | ¿La interfaz es intuitiva para tu equipo? Una herramienta compleja puede afectar la eficiencia. Considera opciones con diseño fácil de usar para minimizar los tiempos de capacitación. |
| Implementación y puesta en marcha | ¿Cuánto tiempo tomará ponerla a funcionar? Evalúa el tiempo y los recursos necesarios para el despliegue, incluyendo formación y soporte durante la transición. |
| Costo | ¿La estructura de precios es transparente y está dentro de tu presupuesto? Ten en cuenta los costos iniciales y los cargos continuos. Cuidado con costos ocultos que puedan incrementar el gasto total. |
| Salvaguardas de seguridad | ¿Protege tus datos? Asegúrate de que cumpla estándares de seguridad y ofrezca características como cifrado y controles de acceso para salvaguardar información sensible. |
¿Qué son las herramientas de supervisión de sistemas?
Las herramientas de monitoreo de sistemas son soluciones de software que rastrean y gestionan el rendimiento y la salud de los sistemas informáticos. Normalmente, los administradores de TI, ingenieros de redes y analistas de sistemas utilizan estas herramientas para garantizar que los sistemas funcionen sin problemas y de manera eficiente. Las capacidades de monitoreo en tiempo real, alertas e informes ayudan a identificar problemas, optimizar recursos y mantener la continuidad operativa. Estas herramientas proporcionan información esencial que mantiene los sistemas confiables y seguros, especialmente al utilizar software de monitoreo de hardware dedicado.
Características
Al seleccionar herramientas de monitoreo de sistemas, presta atención a las siguientes características clave:
- Monitoreo en tiempo real: Rastrea continuamente el rendimiento del sistema para identificar y abordar rápidamente los problemas a medida que surgen.
- Alertas: Envía notificaciones a los usuarios cuando se superan ciertos umbrales, permitiendo respuestas rápidas a posibles problemas.
- Informes: Genera informes de rendimiento detallados que ayudan a analizar tendencias y tomar decisiones informadas.
- Capacidades de integración: Se conecta con software y sistemas existentes para asegurar un flujo de datos sin inconvenientes y un monitoreo integral.
- Tableros personalizables: Permiten a los usuarios adaptar la interfaz para mostrar los datos más relevantes según sus necesidades específicas.
- Análisis predictivo: Utiliza datos históricos para pronosticar posibles problemas futuros, ayudando a prevenir caídas antes de que ocurran.
- Salvaguardas de seguridad: Ofrece funciones como cifrado y controles de acceso para proteger los datos sensibles del sistema.
- Escalabilidad: Se adapta al crecimiento de la cantidad de datos y usuarios sin comprometer el rendimiento.
- Interfaz fácil de usar: Garantiza la facilidad de uso, reduciendo la curva de aprendizaje y minimizando la necesidad de capacitación extensa.
- Respuesta automática a incidentes: Proporciona herramientas para resolver automáticamente problemas comunes, reduciendo la necesidad de intervención manual.
Beneficios
La implementación de herramientas de monitoreo de sistemas, incluyendo alternativas modernas a Nagios, ofrece varios beneficios para tu equipo y tu empresa. Aquí tienes algunos de los que puedes disfrutar:
- Mayor continuidad operativa: El monitoreo en tiempo real y las alertas te ayudan a abordar problemas rápidamente, reduciendo el tiempo de inactividad y manteniendo los sistemas funcionando de manera fluida.
- Mejor seguridad: Las salvaguardas de seguridad como el cifrado y los controles de acceso protegen los datos sensibles, minimizando el riesgo de brechas.
- Toma de decisiones informada: Los informes detallados y el análisis predictivo ofrecen información valiosa que orienta la asignación de recursos y la planificación futura.
- Mayor eficiencia: La respuesta automática a incidentes reduce la carga de trabajo manual, permitiendo que tu equipo se enfoque en tareas más estratégicas.
- Mejor gestión de recursos: El seguimiento del uso de los recursos ayuda a optimizar el rendimiento del sistema y evitar gastos innecesarios.
- Soporte para escalabilidad: La capacidad de manejar demandas crecientes asegura que tus sistemas pueden crecer junto a tu empresa sin pérdida de rendimiento.
- Satisfacción del usuario: Una interfaz fácil de usar facilita la adopción y el uso eficaz de la herramienta por parte de tu equipo, minimizando la frustración.
Costos y precios
Seleccionar herramientas de monitoreo de sistemas requiere comprender los diferentes modelos y planes de precios disponibles. Los costos varían según las funciones, el tamaño del equipo, complementos y más. La siguiente tabla resume los planes más comunes, sus precios promedio y las características típicas incluidas en las soluciones de herramientas de monitoreo de sistemas:
Tabla comparativa de planes para herramientas de monitoreo de sistemas
| Tipo de plan | Precio promedio | Características comunes |
|---|---|---|
| Plan gratuito | $0 | Monitoreo básico, alertas limitadas y soporte comunitario. |
| Plan personal | $5-$15/user/month | Monitoreo en tiempo real, informes básicos y notificaciones por correo electrónico. |
| Plan empresarial | $20-$50/user/month | Informes avanzados, integraciones y tableros personalizables. |
| Plan corporativo | $60-$100/user/month | Suite de análisis completa, análisis predictivo y soporte al cliente dedicado. |
Preguntas frecuentes sobre herramientas de monitoreo de sistemas
Aquí tienes respuestas a preguntas comunes sobre herramientas de monitoreo de sistemas:
¿Pueden las herramientas de monitoreo de sistemas integrarse con sistemas de tickets?
Sí, muchas herramientas se conectan con plataformas de tickets como Jira o ServiceNow. Esto significa que las alertas pueden crear tickets automáticamente, para que tu equipo no se pierda de nada. Ayuda a mantener organizados tus flujos de trabajo y garantiza que la resolución de incidencias siga su curso. La configuración suele implicar el uso de webhooks o complementos nativos.
¿Qué tipos de alertas se pueden configurar en las herramientas de monitoreo de sistemas?
Puedes configurar alertas por umbrales, anomalías o eventos específicos como caídas de servicios. Algunas herramientas admiten alertas personalizadas para mensajes de registro o comprobaciones fallidas. Tú decides cómo se activan las alertas: por valor, intervalo de tiempo o tendencias. La entrega puede ser por correo electrónico, SMS, Slack u otros canales.
¿Pueden las herramientas de monitoreo de sistemas rastrear tanto servidores como aplicaciones?
Sí, muchas herramientas rastrean métricas de hardware y también monitorizan el rendimiento a nivel de aplicaciones. Esto incluye tiempo de actividad, tiempo de respuesta y comportamiento del usuario en las aplicaciones. Puedes obtener visibilidad sobre cómo la salud del servidor afecta el desempeño de las aplicaciones. Algunas herramientas ofrecen módulos separados para la monitorización de infraestructura y de aplicaciones.
¿Cómo apoyan las herramientas de monitoreo de sistemas los entornos multi-nube?
La mayoría de las herramientas te permiten conectar AWS, Azure y Google Cloud mediante APIs o agentes. Recopilan datos en estas plataformas y los presentan en un solo panel. Esto da a tu equipo una visión única del rendimiento, incluso si los sistemas funcionan en distintas nubes. Reduce la necesidad de manejar herramientas de proveedores múltiples.
¿Qué sigue?
Si estás en proceso de investigar herramientas de monitoreo de sistemas, conéctate con un asesor de SoftwareSelect para recibir recomendaciones gratuitas.
Rellenas un formulario y tienes una breve charla donde profundizan en tus necesidades específicas. Luego, recibirás una lista corta de software para revisar. Incluso te acompañarán durante todo el proceso de compra, incluyendo negociaciones de precios.