Guía de las 10 mejores herramientas de monitoreo de 2026

10 Mejores herramientas de monitoreo - Selección


El software de monitoreo de infraestructura te ayuda a seguir el estado y el rendimiento de tus sistemas, ya sea que gestiones servidores, redes, aplicaciones o máquinas virtuales.
Muchos equipos buscan estas herramientas cuando tienen puntos ciegos en su infraestructura, tienen dificultades para detectar problemas a tiempo o pierden tiempo gestionando diferentes paneles de control. Elegir la herramienta incorrecta o depender de una obsoleta puede llevar a alertas perdidas, interrupciones o visibilidad limitada.
He ayudado a equipos a seleccionar e implementar plataformas de monitoreo que se adaptan a sus necesidades y realmente facilitan la resolución de problemas. Esta guía se basa en esa experiencia práctica para que puedas encontrar un software que te dé claridad sin complicaciones.
Por qué confiar en nuestras reseñas de software
Llevamos probando y revisando software desde 2023. Como líderes tecnológicos, sabemos lo crítico y difícil que es tomar la decisión correcta al seleccionar software.
Invertimos en una investigación profunda para ayudar a nuestra audiencia a tomar mejores decisiones de compra de software. Hemos probado más de 2,000 herramientas para diferentes casos de uso tecnológicos y escrito más de 1,000 reseñas de software exhaustivas. Descubre cómo mantenemos la transparencia y nuestra metodología de revisión de software.
Resumen de las mejores herramientas de monitoreo
Esta tabla comparativa resume los detalles de precios de mis principales selecciones de herramientas de monitoreo para ayudarte a encontrar la mejor para tu presupuesto y necesidades de negocio.
| Tool | Best For | Trial Info | Price | ||
|---|---|---|---|---|---|
| 1 | Best for real-time network visibility | 14-day free trial + free demo available | Pricing upon request | Website | |
| 2 | Best for proactive issue detection | 30-day free trial + free demo available | From $129/technician/month (billed annually) | Website | |
| 3 | Best open-source solution | Free plan available | Pricing upon request | Website | |
| 4 | Best for monitoring across all platforms | 30-day free trial | From $179/month (billed annually) | Website | |
| 5 | Best for real-time performance tracking | 30-day free trial + free demo + free plan availabl | From $199/year | Website | |
| 6 | Best for AI-assisted anomaly detection | Free trial available | From $7/host/month | Website | |
| 7 | Best for real-time application error tracking | Free plan + free trial + free demo available | From $26/month (billed annually) | Website | |
| 8 | Best for cloud-scale monitoring | Free plan available | From $15/host/month (billed annually) | Website | |
| 9 | Best for complete network management | Free demo available | From $245/25 devices | Website | |
| 10 | Best for proactive monitoring | 30-day free trial + free demo available | From $10/month (billed annually) | Website |

-

TestDevLab
Visit Website -
Site24x7
Visit WebsiteThis is an aggregated rating for this tool including ratings from Crozdesk users and ratings from other sites.4.7 -
GitHub Actions
Visit WebsiteThis is an aggregated rating for this tool including ratings from Crozdesk users and ratings from other sites.4.8


Reseñas de las mejores herramientas de monitoreo
A continuación tienes mis resúmenes detallados de las mejores herramientas de monitoreo que incluí en mi selección. Mis reseñas ofrecen un vistazo detallado a las características clave, pros y contras, integraciones y casos de uso ideales de cada herramienta para ayudarte a encontrar la más adecuada para ti.

Auvik is a network management platform that enhances your network's visibility and performance. It offers monitoring tools to help you keep your network in check and running smoothly.
Why I Picked Auvik: One of the reasons I chose Auvik as a top monitoring tool is its ability to provide real-time device monitoring. This feature lets you keep a constant eye on your network's health, ensuring that you can catch and address issues as they arise. Another compelling feature is automated network mapping, which visually represents your network's layout and connections. This helps you understand how different devices interact, making it easier to manage and troubleshoot. Another feature that stands out is performance metrics tracking. With this, you can gather valuable data about your network's performance, allowing you to make informed decisions to optimize its functionality. The platform also offers customizable alerts that notify you of potential issues, so you can address them before they escalate.
Standout Features & Integrations:
Features include configuration backups that ensure you never lose critical settings, remote device management that allows you to control devices from anywhere, and global alert settings that provide consistent monitoring across your network. These features work together to provide a comprehensive solution for managing and monitoring your network.
Integrations include Cisco, Datto, Microsoft Intune, Slack, ServiceNow, ConnectWise, Dell, Fortinet, Palo Alto Networks, Cisco Meraki, Okta, and Jamf.
Pros and Cons
Pros:
- Configuration backups and comparison automation
- Automated network mapping and discovery
- Real-time visibility into network performance
Cons:
- Limited offline management capability
- Pricing details not publicly available
New Product Updates from Auvik
Auvik Adds Aurora Troubleshooting Assistance
Auvik introduces Aurora Troubleshooting Assistance with AI-powered troubleshooting guidance, possible root causes, conversation downloads, and feedback tools. The open beta helps IT teams diagnose network issues faster with contextual recommendations tailored to specific devices and alerts. For more information, visit Auvik's official site.
 .
.
Atera is an all-in-one IT management platform designed for Managed Service Providers (MSPs) and IT professionals. It helps you monitor, manage, and automate IT operations across devices and networks, with a strong focus on reducing manual workload through AI and automation. Atera offers real-time visibility into system performance, network health, and device status, making it easier to proactively manage IT environments.
Why I Picked Atera: I chose Atera because it stands out for its remote monitoring and management (RMM) capabilities, which let you keep tabs on performance, uptime, and network health in real time. This makes it easier to catch and resolve issues before they escalate. I also value Atera’s AI-driven automation tools, which help speed up ticket resolution and free up time for more strategic IT work. Its customizable dashboards further enhance usability by giving you full control over how you view your environment.
Standout Features & Integrations:
Atera’s features include patch management to ensure systems stay secure and current, along with network discovery tools that provide a clear picture of all connected devices. Advanced reporting helps you analyze performance trends, while its built-in ticketing system centralizes issue tracking. Integrations include Salesforce, HubSpot, Microsoft Teams, Zendesk, Jira Software Cloud, Acronis Cyber Protect Cloud, Asana, ServiceNow, and WhatsApp Notifications, among others.
Pros and Cons
Pros:
- Effective IT management and issue resolution
- Combines remote monitoring, ticketing, and automation
- Affordable pricing which charges per technician rather than per device
Cons:
- Lacking some advanced customization options
- May require a slight learning curve
New Product Updates from Atera

Atera Adds Multiple API Tokens With Access Controls
Atera now supports multiple API tokens with configurable expiration dates, IP restrictions, and permission scopes, giving teams tighter control and safer delegation of API access. For more information, visit Atera's official site.

Icinga is an open-source monitoring solution that helps you keep an eye on your entire IT infrastructure. It's designed to handle complex environments, offering a wide range of features to ensure your systems are running smoothly.
Why I Picked Icinga: It allows you to monitor everything from servers and networks to applications and databases. You can automatically import data from sources like Active Directory or cloud platforms like AWS and Azure, keeping your monitoring setup in sync with your infrastructure. I also like that it provides monitoring automation, allowing you to manage repetitive processes more easily. And, with its metrics and logs, you can gather and analyze data to gain valuable insights into your systems.
Standout Features & Integrations:
Other key features include distributed and agent-based monitoring to support coverage across multiple locations and customizable alerts and notifications to help you resolve issues quickly. Its analytics tools also let you create custom dashboards and reports, helping you identify bottlenecks and track historical uptime.
Some of Icinga's integrations include Grafana, AWS, Azure, Puppet, Ansible, Chef, Terraform, Jira, PagerDuty, ServiceNow, BigPanda, and Stackstorm.
Pros and Cons
Pros:
- Free to use with no setup fees
- Scalable for both small and large environments
- Highly customizable for various IT infrastructure needs
Cons:
- Occasional performance issues reported during high-load scenarios
- Setup and configuration comes with a learning curve
New Product Updates from Icinga
Icinga Adds OpenTelemetry Support
Icinga introduces OpenTelemetry metrics support, HTTP response streaming, and key system updates. These improvements enhance performance, scalability, and integration with modern monitoring tools. For more information, visit Icinga’s official site.
 .
.
PRTG Network Monitor is a comprehensive tool that helps you keep an eye on your entire IT infrastructure. It monitors systems, devices, traffic, and applications, providing real-time insights into your network's health. With PRTG, you can identify and address issues before they become critical.
Why I Picked PRTG: I chose PRTG for its ability to unify the monitoring of various technologies through integrated protocols like SNMP, WMI, SSH, and more. This means you can oversee a wide range of platforms, devices and systems within your network, ensuring all components are functioning properly. Additionally, PRTG offers customizable reporting, allowing you to generate detailed reports tailored to your needs. Another valuable aspect of PRTG is its real-time alerting system. You receive immediate notifications about potential issues, enabling you to respond promptly and minimize downtime.
Standout Features & Integrations:
Other key features include detailed statistics for applications running in your network, helping you manage resources effectively. Additionally, its distributed monitoring feature allows you to monitor multiple networks in different locations, all from a single interface. It also has real-time maps and dashboards that visualize your network's status, making it easier to identify and address issues. Integrations include AWS, Cisco, Dell Technologies, HPE, VMware, ServiceNow, Check Point, Sonicwall, NetApp, Fujitsu, Lansweeper, and Martello.
Pros and Cons
Pros:
- Supports multiple monitoring technologies
- Customizable dashboards and real-time alerts
- Provides a comprehensive overview of network infrastructure
Cons:
- Licensing based on sensors can become expensive for larger networks
- Initial setup can be time-consuming
New Product Updates from PRTG
PRTG Introduces New Monitoring Sensors In Beta
This week, PRTG introduces three BETA sensors that broaden your monitoring scope for Proxmox VE clusters and SIMATIC S7-300/400 PLCs, giving you deeper operational insights. For more information, visit PRTG’s official site.
 .
.Best for real-time performance tracking

ManageEngine Applications Manager is a tool that helps you monitor the performance of your applications and IT infrastructure. It keeps an eye on various components like servers, databases, and cloud services to ensure they're running smoothly. By doing so, it helps your team identify and fix issues before they affect your users.
Why I Picked ManageEngine Applications Manager: One reason I chose ManageEngine Applications Manager is its ability to monitor a wide range of technologies. It supports over 150 technologies, including application servers, databases, and cloud platforms. This means you can oversee your entire IT environment from a single console, making it easier to spot and address potential problems. Another useful feature is its real-time performance tracking. The tool provides insights into metrics like CPU and memory usage, response times, and transaction details. With this information, your team can quickly identify performance bottlenecks and take corrective actions to maintain optimal application performance.
Standout Features & Integrations:
Features include synthetic transaction monitoring, which allows you to simulate user interactions with your applications to identify potential issues before they impact real users. Additionally, real user monitoring provides insights into the actual experiences of your users, helping you understand how your applications perform under real-world conditions.
Integrations include ManageEngine ServiceDesk Plus, ServiceNow, Site24x7, AlarmsOne, Slack, Prometheus, AWS, Google Cloud, Microsoft Azure, Oracle, and MySQL.
Pros and Cons
Pros:
- Monitors a wide range of applications and infrastructure components
- Real-time alerting system helps teams respond promptly to issues
- Simplifies management of applications and their relationships
Cons:
- Setting up the tool to meet specific needs can be challenging
- The tool can be resource-intensive
New Product Updates from ManageEngine Applications Manager
Oracle Cloud Application Monitoring Now Available in ManageEngine Applications Manager
ManageEngine Applications Manager introduces Oracle Cloud Application Monitoring, Oracle Cloud Function Monitoring, and Oracle Cloud NAT Gateway Monitoring. These new capabilities help teams monitor Oracle Cloud applications, serverless workloads, and network resources from a single platform. For more information, visit ManageEngine Applications Manager's official site.
 .
.
Dynatrace is a performance monitoring tool designed to oversee the entirety of a digital ecosystem. Its sophisticated AI capabilities enable it to not only monitor but also proactively identify anomalies within a system.
This particular focus on AI-driven insights makes it especially suited for those in search of a solution for anomaly detection.
Why I Picked Dynatrace: In my search for monitoring solutions, Dynatrace captured my attention because of its pronounced emphasis on AI. The decision to select it was influenced by how its unique AI capabilities facilitate rapid anomaly detection, often preempting issues before they escalate.
My judgment, after comparing various tools, led me to believe that Dynatrace is unparalleled in its offering of AI-assisted anomaly detection.
Standout Features & Integrations:
Dynatrace offers real-time anomaly detection and root cause determination, attributes that are vital for quick issue resolution. It is full-stack monitoring, from applications to infrastructure, ensures comprehensive coverage.
When it comes to integrations, Dynatrace ties in with cloud platforms, CI/CD tools, and major IT operations platforms, making it adaptable to varied IT environments.
Pros and Cons
Pros:
- Rich integration environment with popular cloud and IT operation platforms.
- Comprehensive full-stack monitoring.
- Advanced AI capabilities for real-time anomaly detection.
Cons:
- The lack of transparent pricing can be a deterrent for some potential users.
- The vast array of features might require dedicated training sessions.
- Can be complex for users unfamiliar with AI-driven tools.
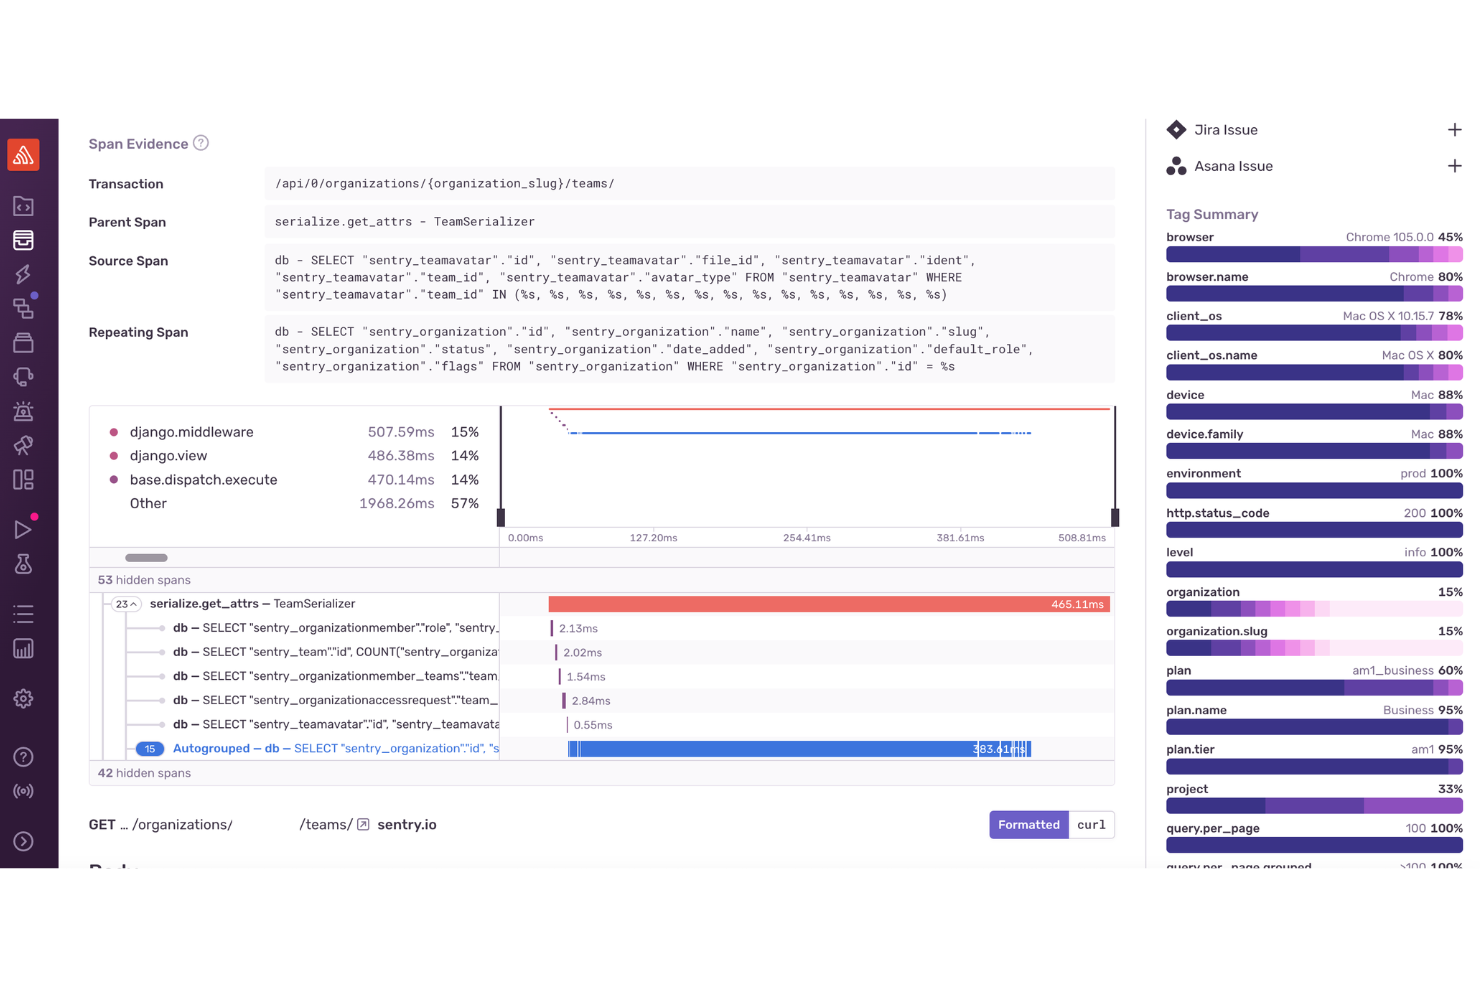
For developers and businesses seeking a monitoring tool that provides immediate insights into application performance and errors, Sentry stands out as a comprehensive solution. It is particularly appealing to those in web and mobile development, e-commerce, and enterprise sectors, addressing the critical need for real-time error tracking and performance optimization during high-traffic periods.
Why I Picked Sentry
I picked Sentry for its robust error monitoring and performance tracking capabilities. The tool excels at real-time error tracking, immediately alerting your team to issues and enabling swift resolution. Sentry's distributed tracing feature provides a detailed view of transaction performance, helping you identify slow operations and optimize them. Additionally, the session replay functionality offers visual context for debugging, making it easier to understand user interactions and address issues effectively.
Sentry Key Features
In addition to real-time application error tracking, Sentry offers:
- Mobile App Crash Reporting: Provides insights into mobile app crashes with detailed stack traces.
- Gaming Analytics: Provides performance monitoring tailored for gaming applications, highlighting latency and frame-rate issues.
- AI Code Review: Leverages AI to suggest potential fixes for detected issues, streamlining the debugging process.
- Security and Compliance: Ensures user data protection through industry-standard security measures, making it suitable for applications handling sensitive information.
Sentry Integrations
Sentry offers a wide range of native integrations to enhance workflow efficiency, including GitHub, Bitbucket, GitLab, Slack, Microsoft Teams, Jira, Asana, Trello, Datadog, and PagerDuty.
Pros and Cons
Pros:
- Offers real-time error tracking across web, mobile, and backend apps
- Advanced error grouping helps prioritize issues for fast resolution
- Distributed tracing shows transaction-level performance insights
Cons:
- Limited alerts and applications insights in lower-tier plans
- Not all integrations are available natively, relying on third-party APIs for some
New Product Updates from Sentry

Sentry Adds Log Export in CSV and JSONL
Sentry now supports exporting up to 10,000 log lines from Explore → Logs in CSV or JSON Lines, with downloads available in-browser or as background downloads and email. For more information, visit Sentry's official site.
 .
.
Datadog is a comprehensive monitoring and analytics platform that offers a unified view of IT infrastructure. Its emphasis on cloud-scale monitoring enables organizations to gain insights into their operations across various cloud environments. This close alignment with cloud-scale operations is what makes Datadog an optimal choice for such a purpose.
Why I Picked Datadog: In my process of selecting a tool for this list, Datadog consistently emerged as a top contender. I judged its capabilities based on its specialized approach to cloud-centric monitoring, which is not commonly seen in other tools.
This specific focus led me to determine that Datadog is indeed the best for those requiring cloud-scale monitoring solutions.
Standout Features & Integrations:
Datadog is known for its real-time performance dashboards, which can be tailored to display metrics, traces, and logs. Additionally, its anomaly detection can proactively identify issues before they impact users.
In terms of integrations, Datadog supports over 400 integrations, including but not limited to AWS, Google Cloud Platform, Azure, Slack, and Docker.
Pros and Cons
Pros:
- Proactive anomaly detection helps in early issue identification.
- Supports a wide array of integrations for maximum compatibility.
- Tailored dashboards provide a comprehensive view of operations.
Cons:
- Some users may face a learning curve in the beginning.
- Pricing can become substantial for larger teams.
- Might be over-complex for small-scale operations.

ManageEngine OpManager is a robust tool that specializes in providing an integrated approach to network management. It offers functionalities that span from monitoring network performance to automating network configurations, aligning it perfectly as a solution for comprehensive network management.
Why I Picked ManageEngine OpManager: When it came to choosing a tool for all-encompassing network management, ManageEngine OpManager emerged at the forefront of my evaluations. Its distinct suite of features caters specifically to those who seek a holistic perspective on their network's operations and health.
Based on these assessments, I formed the opinion that ManageEngine OpManager is best positioned for complete network management tasks.
Standout Features & Integrations:
OpManager is distinguished by its physical and virtual server monitoring capabilities. Its network configuration management allows administrators to backup, restore, and automate tasks, providing peace of mind against configuration errors.
On the integration front, ManageEngine OpManager supports integration with popular ITOM solutions and third-party IT management apps, enriching its functionality.
Pros and Cons
Pros:
- Extensive integration capabilities with other IT management solutions.
- Features a comprehensive suite for network configuration management.
- Offers both physical and virtual server monitoring.
Cons:
- Licensing model may not be favorable for all types of businesses.
- Its wide array of features might be overwhelming for small-scale operations.
- Might have a steep learning curve for beginners.
New Product Updates from ManageEngine OpManager
ManageEngine OpManager Vendor Templates and NCM XML Import
ManageEngine OpManager introduces enhanced vendor template integration and device template import for the NCM module using XML files. This update helps teams improve device classification and speed up configuration workflows. For more information, visit ManageEngine OpManager’s official site.
 .
.
Site24x7 is a cloud-based monitoring solution designed for DevOps and IT operations teams. It offers comprehensive monitoring capabilities for websites, servers, applications, and network devices, providing real-time insights into performance and availability.
Why I Picked Site24x7: I like Site24x7 for its robust application performance monitoring (APM). It supports various programming languages, including Java, .NET, Ruby, PHP, and Node.js. Another notable aspect is Site24x7's real user monitoring (RUM). This feature enables you to analyze the actual experience of users interacting with your website or web applications. By segmenting performance data by browser, platform, geography, and more, you can gain valuable insights into how different factors affect user experience and make informed decisions to improve it. Overall, these features help you proactively monitor various components of your IT infrastructure.
Standout Features & Integrations:
Other features include synthetic web transaction monitoring, which lets you record and simulate multi-step user interactions in a real browser, helping you optimize critical user journeys like login forms and shopping carts. Additionally, Site24x7's log management consolidates and indexes logs from various sources, aiding in efficient troubleshooting and issue resolution.
Integrations include ServiceNow, PagerDuty, Opsgenie, Jira, ManageEngine AlarmsOne, ManageEngine ServiceDesk Plus, Slack, Microsoft Teams, Zoho Cliq, Amazon EventBridge, Zapier, and Webhooks.
Pros and Cons
Pros:
- Comprehensive monitoring capabilities across various IT infrastructure components
- Reliable real-time alerts that enable prompt issue resolution
- Flexible customization options for dashboards and reports
Cons:
- Configuration complexity can be challenging for new users
- Limited integration options with certain third-party tools
New Product Updates from Site24x7
Site24x7 Adds Synchronization Statuses for MSPs
Site24x7 now provides MSPs enhanced alerts and synchronization statuses in a centralized notification center to spot configuration sync issues sooner and accelerate incident response. For more information, visit Site24x7's official site.

Otras herramientas de monitoreo
A continuación encuentras una lista de otras herramientas de monitoreo que seleccioné, pero que no llegaron al top 10. Sin duda vale la pena revisarlas.
- New Relic
For application performance insights
- Nagios XI
For comprehensive infrastructure monitoring
- Prometheus
For real-time alerting and multi-dimensional data collection
- SolarWinds Observability SaaS
Good for real-time database health monitoring
- Micro Focus SiteScope
For agentless application monitoring
- Sensu
For flexible monitoring workflows
- Observium
For network and server hardware health checks
- Checkmk
For unified monitoring solutions
- Dotcom Monitor
For building multi-step scripts
- Splunk Enterprise
Good for large-scale infrastructure data analytics
- AppDynamics
Good for deep application performance insights
- LogicMonitor
Good for cloud-based infrastructure monitoring
- Netdata
Good for real-time system performance troubleshooting
- Centreon
Good for IT operation analytics in complex networks
- Atera
For integrated remote IT management


How I Evaluate Monitoring Tools
I split my evaluation into two layers: the baseline features a tool needs to handle 3am alerts and trace failures across distributed services, and the differentiators that separate good from great.
Core Functionality (Table Stakes For This List)
When I'm selecting tools for my list, I rank each one on a scale from 0 (does not offer the functionality) to 5 (excels in this area) for each core functionality listed below. Then, I calculate the tool's total score into a percentage. Each tool needs to achieve a minimum total score of 75% to be considered for inclusion.
- Real-Time Monitoring: I check how quickly each tool surfaces live metrics—whether it's CPU spikes on a host or latency shifts across a Kubernetes cluster during a deployment.
- Alerting & Notifications: Each tool's alert system should support configurable thresholds, anomaly-based triggers, and routing to channels like Slack, PagerDuty, or email.
- Multi-Source Data Collection: I evaluate whether the tool ingests metrics, logs, and traces from servers, containers, cloud services, and applications rather than covering just one telemetry type.
- Dashboards & Visualization: The ability to build custom dashboards matters—think a single pane showing API error rates alongside database query times during an incident.
- Historical Data & Reporting: Trend analysis over weeks or months is essential for capacity planning, so I look at retention windows and the depth of reporting options.
- Integrations & Extensibility: A tool should connect to the broader stack—CI/CD pipelines, ITSM platforms, cloud providers—via native integrations, APIs, or open standards like OpenTelemetry.
Once I have a list of tools that meet this criteria, I consider what sets each platform apart.
Differentiating Factors (What Sets Vendors Apart)
Here's how I compare and contrast different vendors:
Standout Features
Distributed tracing is a major differentiator—when a checkout flow spans five microservices, I want to see exactly where latency builds up. Auto-discovery and topology mapping also matters for teams managing dynamic environments where containers spin up constantly. I look at synthetic monitoring too, which lets you simulate user transactions and API calls to catch failures before real users are impacted.
Beyond Features
Pricing predictability is something I evaluate closely—monitoring costs can spiral when data ingestion spikes during incidents, so I check whether a vendor's model stays manageable as your environment grows. Security and compliance certifications like SOC 2 and ISO 27001 also factor in, especially for teams in regulated industries. I consider time-to-value too: pre-built dashboards, auto-instrumentation, and lightweight agents make a real difference when you need visibility on day one.
Cómo elegir herramientas de monitoreo
Es fácil verse abrumado por largas listas de funciones y estructuras de precios complejas. Para ayudarte a mantener el enfoque durante tu proceso único de selección de software, aquí tienes una lista de factores a tener en cuenta:
| Factor | Qué considerar |
|---|---|
| Escalabilidad | ¿Puede la herramienta crecer con tu negocio? Considera las necesidades futuras y si la herramienta puede manejar un aumento de datos y usuarios sin problemas de rendimiento. Busca opciones de escalado flexibles. |
| Integraciones | ¿Se conecta con tus sistemas existentes? Asegúrate de la compatibilidad con tu pila tecnológica actual, como CRM, ERP o servicios en la nube, para evitar soluciones alternativas costosas. |
| Personalización | ¿Puedes adaptar la herramienta a tus flujos de trabajo? Verifica si puedes modificar paneles, alertas e informes para ajustarlos a los procesos y necesidades específicas de tu equipo. |
| Facilidad de uso | ¿La herramienta es intuitiva para tu equipo? Evalúa la curva de aprendizaje y si tu equipo puede adoptar la herramienta rápidamente sin capacitaciones extensas. Busca interfaces fáciles de usar. |
| Implementación y adopción | ¿Qué tan sencillo es el proceso de configuración? Considera el tiempo y los recursos necesarios para poner en marcha la herramienta. Busca proveedores que ofrezcan soporte integral y recursos para la adopción. |
| Costo | ¿El precio se ajusta a tu presupuesto? Compara el costo de la herramienta en relación con sus características y beneficios. Ten cuidado con tarifas ocultas o cargos adicionales por más usuarios o funciones. |
| Salvaguardas de seguridad | ¿Protege tus datos? Evalúa las medidas de seguridad implementadas, como el cifrado y el cumplimiento de estándares de la industria, para asegurar que tus datos permanezcan seguros. |
| Disponibilidad de soporte | ¿La ayuda está disponible cuando la necesitas? Revisa las opciones de soporte disponibles, como asistencia 24/7, chat en vivo o gestores de cuenta dedicados, para asegurarte de que recibirás ayuda cuando la necesites. |
¿Qué son las herramientas de monitoreo?
Las herramientas de monitoreo son programas que rastrean el rendimiento y el estado de sistemas, redes y aplicaciones. Son utilizadas por equipos de TI, ingenieros de DevOps y administradores de sistemas para detectar problemas a tiempo, reducir el tiempo de inactividad y mantener los sistemas funcionando correctamente. El seguimiento de métricas, las alertas y los paneles ayudan a identificar tendencias, resolver problemas y mantener informado al equipo. El software de monitoreo de hardware ofrece al equipo la visibilidad necesaria para administrar los sistemas sin sorpresas.
Características
Al seleccionar herramientas de monitoreo, toma en cuenta las siguientes características clave:
- Alertas en tiempo real: Notifican a los usuarios inmediatamente cuando surgen problemas, permitiendo una respuesta rápida y su pronta resolución.
- Paneles personalizables: Adapta la interfaz para mostrar las métricas y datos que más le interesan a tu equipo.
- Capacidades de integración: Se conecta sin problemas con sistemas y programas existentes para proporcionar una visión unificada de las operaciones.
- Análisis automatizado de la causa raíz: Identifica la causa principal de los problemas sin intervención manual, ahorrando tiempo y esfuerzo.
- Análisis predictivo: Anticipa posibles problemas antes de que ocurran, ayudando a mantener la estabilidad del sistema.
- Escalabilidad: Se adapta al crecimiento de los datos y usuarios, asegurando que la herramienta siga siendo eficaz a medida que el negocio crece.
- Salvaguardas de seguridad: Protege datos sensibles mediante cifrado y cumplimiento de estándares de la industria.
- Informes completos: Genera informes detallados para analizar tendencias de rendimiento y respaldar la toma de decisiones.
- Soporte multi-nube: Supervisa aplicaciones en diferentes entornos de nube, ofreciendo una visión global de las operaciones.
- Interfaz fácil de usar: Garantiza facilidad de uso, permitiendo que los miembros del equipo naveguen y utilicen la herramienta de manera eficiente.
Beneficios
Implementar herramientas de monitoreo junto con herramientas de mapeo de red ofrece varios beneficios tanto para tu equipo como para tu empresa. Aquí te contamos algunos que puedes esperar:
- Mejor rendimiento del sistema: Las alertas en tiempo real y el análisis automatizado de la causa raíz te ayudan a resolver los problemas rápidamente, manteniendo los sistemas en funcionamiento.
- Mejora en la toma de decisiones: Los informes completos y el análisis predictivo ofrecen información que respalda decisiones empresariales bien fundamentadas.
- Mayor eficiencia: Los paneles personalizables y la integración ahorran tiempo al entregar datos relevantes en un formato accesible.
- Escalabilidad: A medida que la empresa crece, la escalabilidad asegura que la herramienta se adapte al aumento de la demanda sin problemas de rendimiento.
- Seguridad de datos: Las salvaguardas de seguridad protegen tu información sensible y garantizan el cumplimiento con los estándares de la industria.
- Ahorro de costos: La detección temprana y solución de problemas reduce el tiempo de inactividad y los costes asociados, beneficiando a tu rentabilidad.
- Visibilidad multidispositivo: El soporte multi-nube proporciona una visión unificada de las operaciones en distintos entornos, mejorando la transparencia general.
Costos y precios
Seleccionar herramientas de monitoreo requiere comprender los distintos modelos y planes de precios disponibles. Los costos varían según las funciones, el tamaño del equipo, complementos y más. La siguiente tabla resume los planes más comunes, sus precios promedio y las características típicas incluidas en las soluciones de herramientas de monitoreo:
Tabla comparativa de planes para herramientas de monitoreo
| Tipo de plan | Precio promedio | Características comunes |
|---|---|---|
| Plan gratuito | $0/user/month | Monitoreo básico, alertas limitadas y soporte de la comunidad. |
| Plan personal | $5-$25/user/month | Alertas en tiempo real, paneles personalizables y análisis básicos. |
| Plan empresarial | $30-$75/user/month | Informes avanzados, capacidad de integración y acceso multiusuario. |
| Plan corporativo | $100-$300/user/month | Análisis predictivo, soporte 24/7 y opciones de personalización total. |
Preguntas frecuentes sobre herramientas de monitoreo
Aquí tienes algunas respuestas a preguntas comunes sobre herramientas de monitoreo:
¿Cómo funciona una herramienta de monitoreo?
Una herramienta de monitoreo rastrea diversos indicadores como la carga de la CPU, el ancho de banda de red y el espacio en disco. Ayuda a detectar problemas y alerta a los administradores antes de que se vean afectados los usuarios. Estas herramientas aseguran el correcto funcionamiento de los sistemas proporcionando información sobre el rendimiento y posibles incidencias.
¿Qué habilidades se necesitan para utilizar herramientas de monitoreo?
Necesitarás habilidades estadísticas y analíticas para recopilar y analizar datos. Estas competencias te ayudarán a comprender el impacto de la monitorización y tomar decisiones informadas. También será útil estar familiarizado con la interpretación de datos y tener conocimientos básicos de sistemas informáticos.
¿Cómo elegir herramientas de monitoreo de aplicaciones?
Considera el tipo y la complejidad de tu aplicación. Evalúa la facilidad de despliegue y gestión de la herramienta, y asegúrate de que cumpla tus estándares de seguridad. Busca características que se alineen con tus necesidades específicas y ofrezcan el mayor valor a tu equipo.
¿Cómo funcionan las herramientas de monitoreo de red?
Las herramientas de monitoreo de red rastrean aspectos como el tráfico, la utilización del ancho de banda y el tiempo de actividad. Detectan dispositivos en la red y proporcionan actualizaciones de estado. Esto ayuda a gestionar el rendimiento de la red e identificar problemas potenciales antes de que afecten a los usuarios.
¿Cuáles son los desafíos más comunes al usar herramientas de monitoreo?
Los usuarios suelen enfrentarse a desafíos como la sobrecarga de datos, que puede dificultar la identificación de problemas clave. La integración con sistemas existentes también puede ser complicada. Es importante configurar las alertas correctamente para evitar notificaciones innecesarias que pueden llevar a la fatiga de alertas.
¿Cómo pueden las herramientas de monitoreo mejorar el rendimiento del sistema?
Las herramientas de monitoreo proporcionan información en tiempo real sobre el rendimiento del sistema, ayudando a identificar y resolver problemas rápidamente. Al analizar tendencias y alertar sobre posibles incidencias, estas herramientas ayudan a mantener la salud óptima del sistema y reducir el tiempo de inactividad.
¿Qué sigue?
Si estás investigando herramientas de monitoreo, conéctate con un asesor de SoftwareSelect para obtener recomendaciones gratuitas.
Sólo tienes que rellenar un formulario y mantener una breve conversación donde se profundizará en los detalles de tus necesidades. Después recibirás una lista corta de software para revisar. Incluso te apoyarán durante todo el proceso de compra, incluidas las negociaciones de precios.