10 Mejores Herramientas de Monitorización de Aplicaciones de 2026

10 Mejores Herramientas de Monitorización de Aplicaciones - Lista Rápida


Quizás te sientas abrumado por la infinidad de opciones de herramientas de monitorización, cada una afirmando ser la mejor. Ahí es donde entro yo. He probado y revisado estas herramientas de forma independiente para ayudarte a tomar decisiones informadas.
Las herramientas de monitorización de aplicaciones pueden aliviar el estrés de interrupciones inesperadas y problemas de rendimiento, permitiéndote centrarte en lo que realmente importa: hacer crecer tu negocio.
En este artículo, compartiré mis mejores selecciones, ofreciéndote opiniones imparciales y consejos prácticos. Descubrirás qué herramientas se adaptan a las necesidades únicas de tu equipo y cómo pueden mejorar la eficiencia de tu flujo de trabajo.
Table of Contents
- Lista Seleccionada
- Por Qué Confiar en Nosotros
- Comparar Especificaciones
- Reseñas
- Otras Herramientas de Monitorización de Aplicaciones
- Reseñas Relacionadas
- Criterios de Selección
- Cómo Elegir
- ¿Qué Son las Herramientas de Monitorización de Aplicaciones?
- Características
- Beneficios
- Costos y Precios
- Preguntas Frecuentes
Por qué confiar en nuestras reseñas de software
Llevamos probando y revisando software desde 2023. Como líderes tecnológicos, sabemos lo crítico y difícil que es tomar la decisión correcta al seleccionar software.
Invertimos en una investigación profunda para ayudar a nuestra audiencia a tomar mejores decisiones de compra de software. Hemos probado más de 2,000 herramientas para diferentes casos de uso tecnológicos y escrito más de 1,000 reseñas de software exhaustivas. Descubre cómo mantenemos la transparencia y nuestra metodología de revisión de software.
Resumen de las Mejores Herramientas de Monitorización de Aplicaciones
| Tool | Best For | Trial Info | Price | ||
|---|---|---|---|---|---|
| 1 | Best for companies in finance | Free trial available | From $7/host/month | Website | |
| 2 | Best for real-time error monitoring | Free plan + free trial + free demo available | From $26/month (billed annually) | Website | |
| 3 | Best unified monitoring platform | 14-day free trial | From $15/host/month (billed annually) | Website | |
| 4 | Best for code-level insights | 30-day free trial + free demo + free plan availabl | From $199/year | Website | |
| 5 | Best for educational institutions | 30-day free trial + free demo available | From $10/month (billed annually) | Website | |
| 6 | Best error tracking features | Free plan available | From $49/user/month | Website | |
| 7 | Best for online games | Free plan + demo available | From $130/month | Website | |
| 8 | Best incident management features | Free demo available | From $21.20/MVS/month | Website | |
| 9 | Best APM for AWS | Free plan available | Pricing upon request | Website | |
| 10 | Best open-source option | Free plan available | From $19/month | Website |
-

TestDevLab
Visit Website -
Site24x7
Visit WebsiteThis is an aggregated rating for this tool including ratings from Crozdesk users and ratings from other sites.4.7 -
GitHub Actions
Visit WebsiteThis is an aggregated rating for this tool including ratings from Crozdesk users and ratings from other sites.4.8


Reseñas de las Mejores Herramientas de Monitorización de Aplicaciones
Aquí tienes mis soluciones favoritas de monitorización de aplicaciones, con resúmenes breves pero completos que incluyen fortalezas, debilidades e información sobre precios:
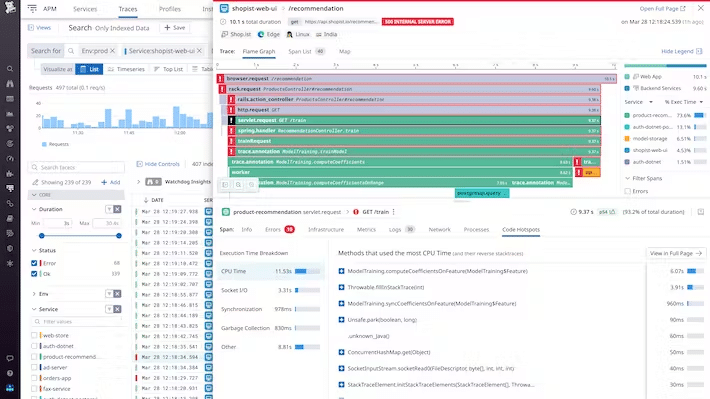
Dynatrace is a unified observability platform whose solutions include modules for application observability and security, digital experience, infrastructure observability, automation, and business insights.
Why I picked Dynatrace: I picked Dynatrace because of Grail, a central observability and analytics tool. It collects causal data on a massive scale and delivers AI-powered insights with full context to help you make business decisions, which I felt would be especially useful for fintech companies. I also liked the ability to set custom parameters that flag unusual behavior.
Dynatrace standout features and integrations:
Features that make Dynatrace ideal for financial apps, in my opinion, include its support for BizDevOps with built-in BI tools that allow you to involve business teams in the development process.
I also liked that it allows you to set up targeted notifications so you can make sure the most qualified personnel are alerted whenever there’s an issue. For example, an indication of possible fraud could go to someone on the finance team, rather than the development team.
Integrations are pre-built for Jenkins, GitLab, JFrog, Microsoft Teams, Mulesoft, LaunchDarkly, ServiceNow, Jira, Prometheus, and Grafana.
Pros and Cons
Pros:
- Targeted notifications
- Supports BizDevOps with BI tools
- Large-scale causal data processing
Cons:
- Steep learning curve
- Support is hit-or-miss
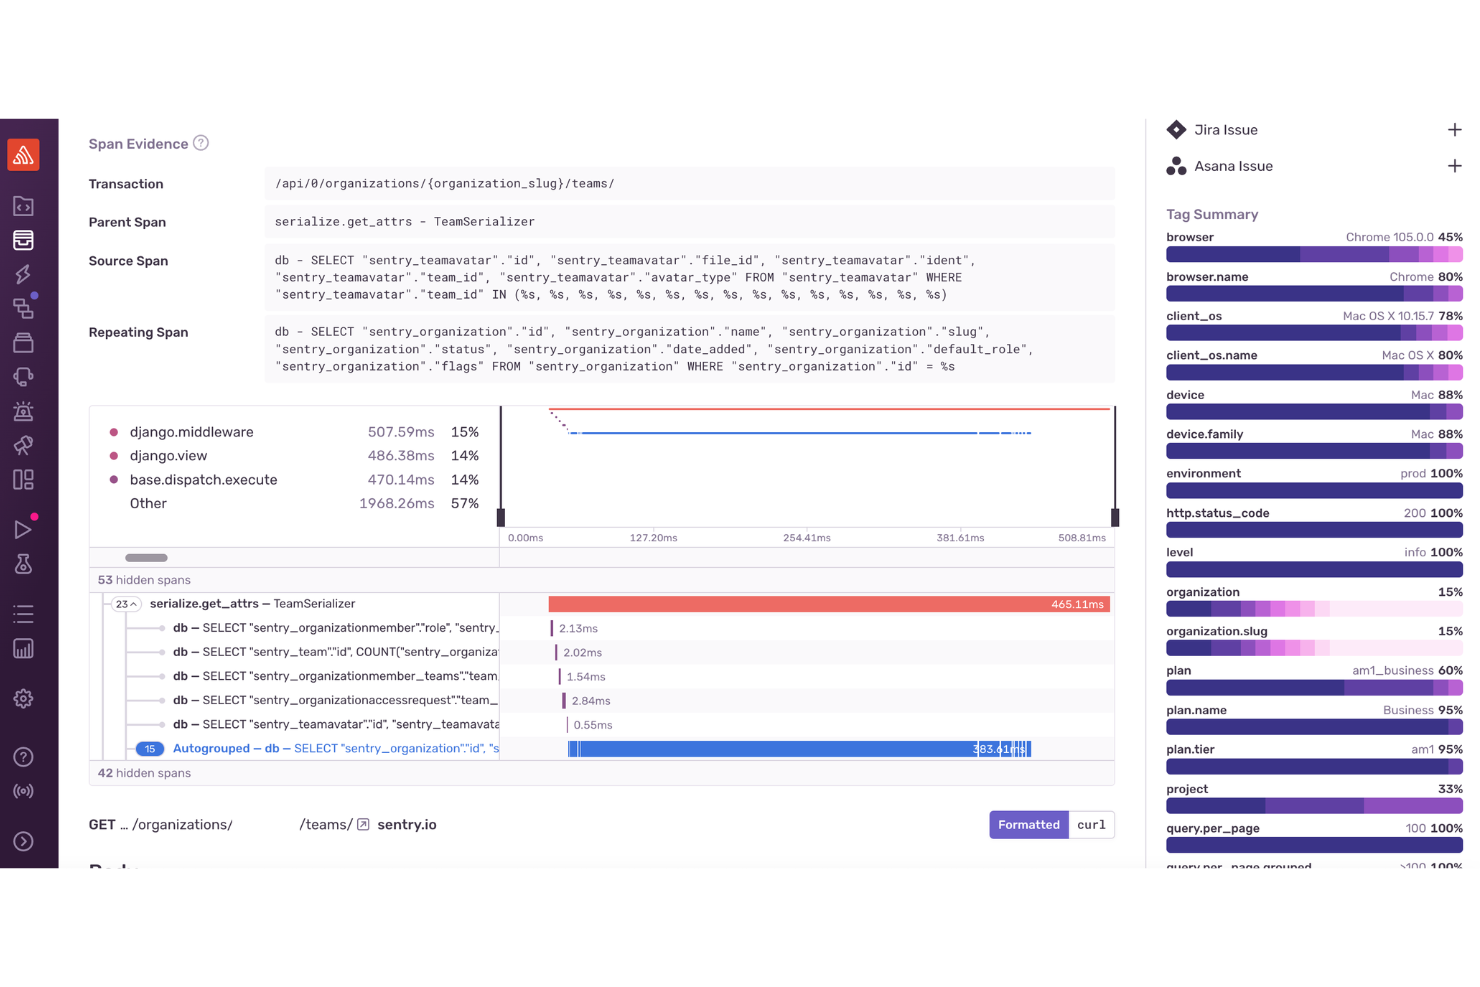
Sentry helps your development team catch and understand errors and performance issues in your applications by giving real-time visibility into what’s going wrong in your code and why. It’s tailored to software teams who want deeper insight into exceptions, performance bottlenecks, and release health across web, mobile, and backend systems, giving you context that goes beyond simple logging.
Why I Picked Sentry
I picked Sentry because it combines detailed real-time error monitoring with code-level performance insights in one platform, helping your team diagnose problems with precision. Sentry’s error tracking captures unhandled exceptions and groups similar issues to help you focus on what matters most, while linking them to commits lets you trace faults back to specific changes. Its distributed tracing and performance monitoring give you transaction-level visibility, so you can pinpoint slow endpoints or bottlenecks without digging through logs.
Sentry Key Features
In addition to its standout features, Sentry offers several other functionalities that enhance its application monitoring capabilities:
- Session Replay: This feature allows you to replay user sessions to understand the context behind errors and improve user experience.
- Release Tracking: Ties errors and performance changes to specific releases so you can monitor how new versions impact stability over time.
- Uptime Monitoring: Ensures your application is always accessible by monitoring its availability and alerting you to any downtime.
- Profiling: Offers detailed insights into performance issues by examining runtime behavior, helping you optimize application speed.
Sentry Integrations
Integrations include GitHub, Slack, Jira, Bitbucket, GitLab, Trello, PagerDuty, Azure DevOps, Twilio, and Zendesk.
Pros and Cons
Pros:
- Distributed tracing shows transaction-level performance insights
- Advanced error grouping helps prioritize issues for fast resolution
- Offers real-time error tracking across web, mobile, and backend apps
Cons:
- Limited alerts and applications insights in lower-tier plans
- Not all integrations are available natively, relying on third-party APIs for some
New Product Updates from Sentry

Sentry Adds Heatmaps to Application Metrics
Sentry introduced heatmaps for Application Metrics to visualize metric value distributions over time, helping teams spot patterns like latency bursts and use heatmaps in Custom Dashboards. For more information, visit Sentry's official site.
 .
.
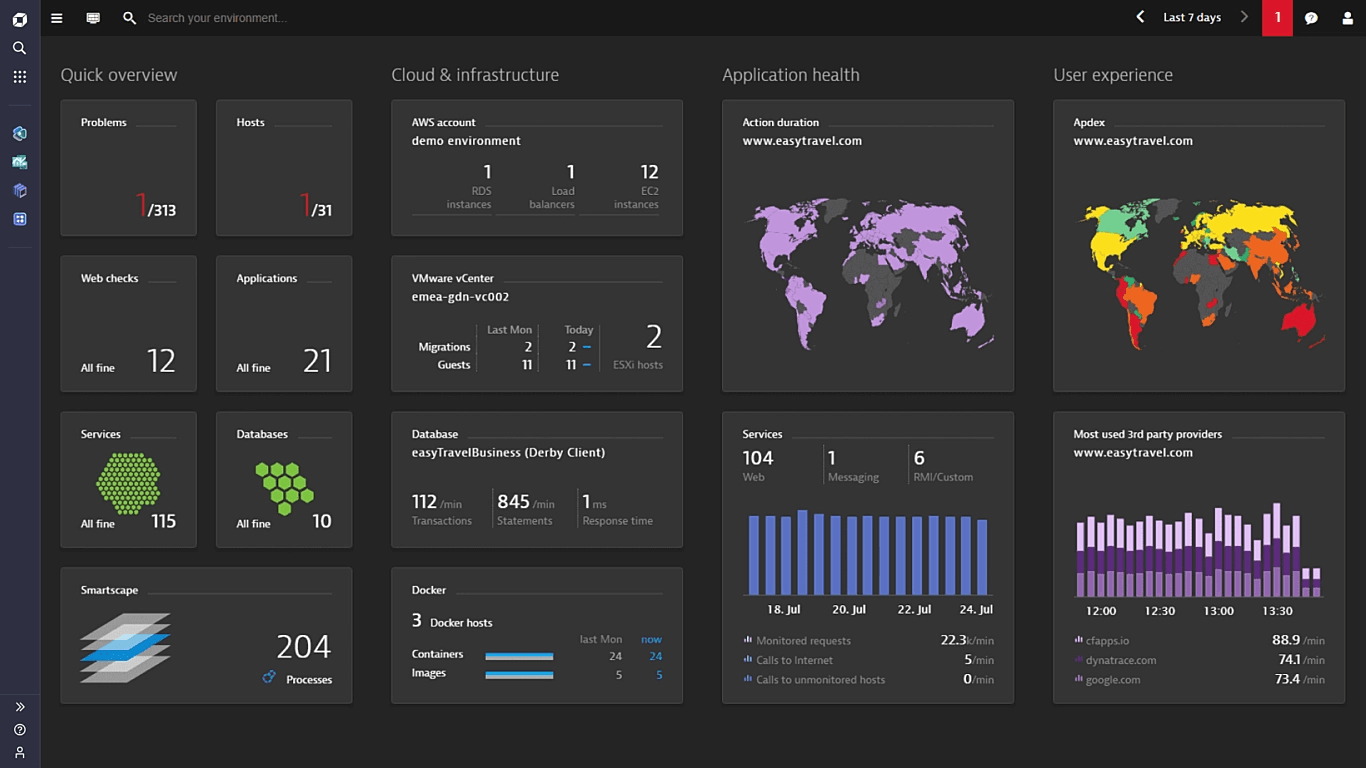
Datadog is a monitoring and security platform for applications and infrastructure, with features such as logs and software delivery.
Why I picked Datadog: I picked Datadog because it’s an all-in-one monitoring solution that creates a single pane of glass to visualize not only your app, but also your associated networks, databases, infrastructure, and containers. I also liked how the collaboration features helped me bridge the gap between developers and business teams.
Datadog standout features and integrations:
Features that make Datadog ideal as a unified monitoring platform for applications and network environments, in my opinion, include the logging functions that provide audit trails, observability pipelines, and scanners for sensitive data.
It also allows you to manage the digital experience with in-depth functions that cover session recording and replay, error tracking, and real user and synthetic monitoring.
Integrations are pre-built for Argo CD, CircleCI, Travis CI, Azure DevOps, GitHub, Jira, GitLab, Auth0, Kubernetes, and Docker.
Pros and Cons
Pros:
- Comprehensive digital experience management features
- In-depth log management features
- All-in-one monitoring platform
Cons:
- Relatively steep learning curve
- Sparse documentation
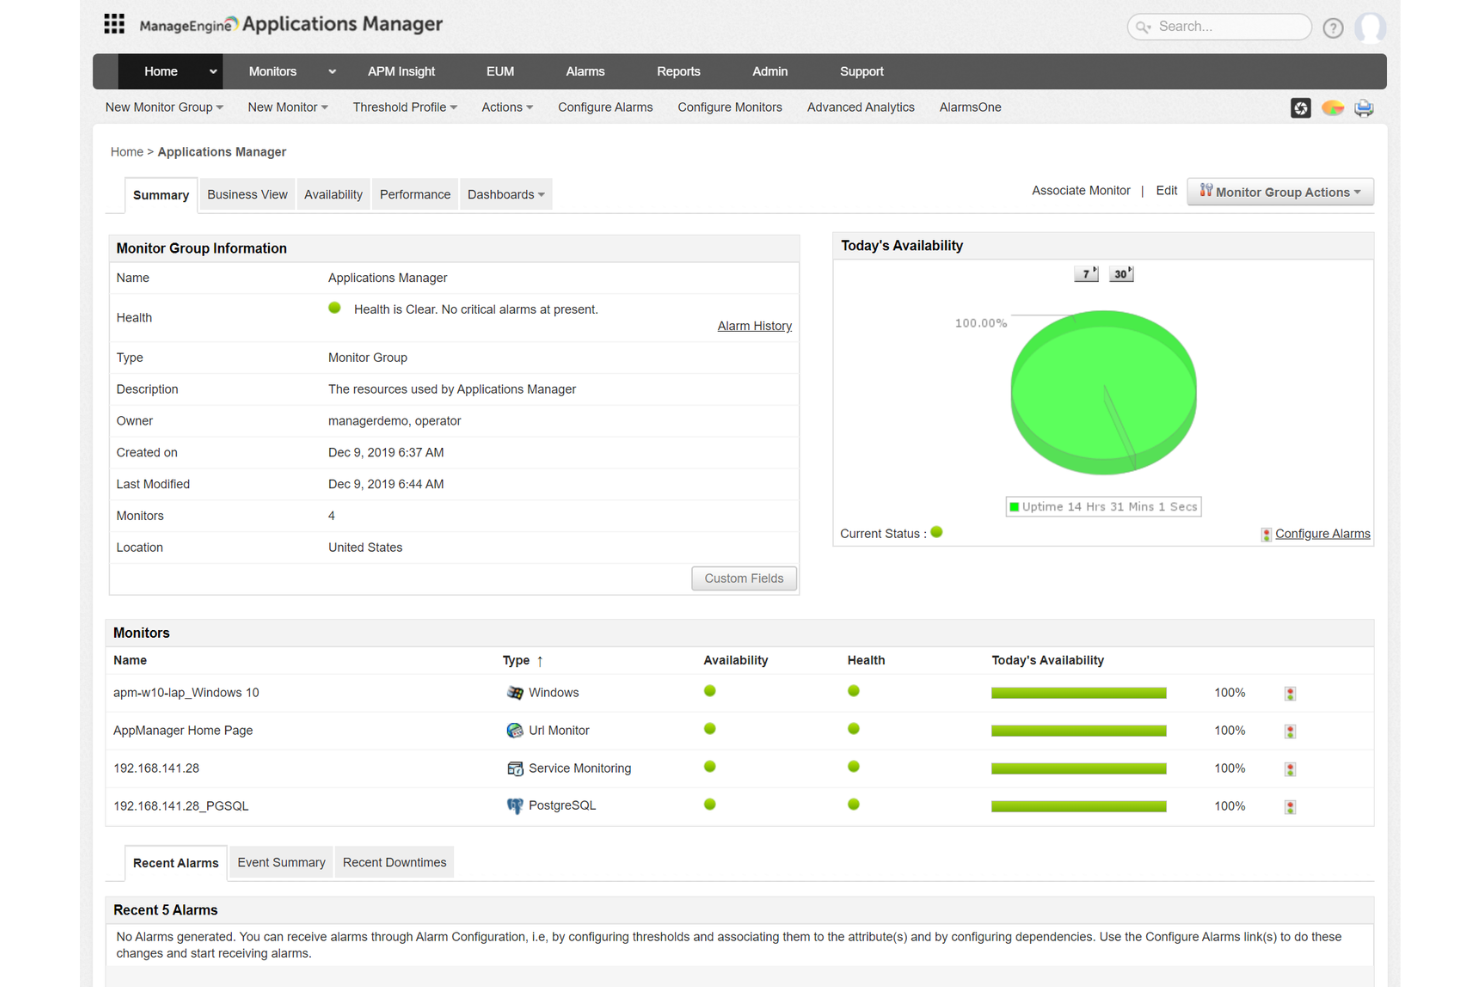
ManageEngine Applications Manager is a robust application performance monitoring tool designed for IT teams and administrators.
Why I picked ManageEngine Applications Manager: I like its ability to provide code-level insights into your applications. This feature helps you identify problematic elements in your application code, allowing you to address issues before they affect your users. Additionally, it offers thread profiling, which can reveal bottlenecks in your code stack, enabling you to optimize performance effectively.
ManageEngine Applications Manager standout features and integrations:
Features include real user monitoring, which provides real-time insights into user experience by tracking page load times and session details. This helps you identify and resolve user experience issues proactively. Additionally, its hybrid cloud monitoring collects and analyzes data from both on-premises and cloud-based infrastructure, giving you a comprehensive view of your IT environment.
The application dependency mapping feature visualizes the relationships between your application components, helping you understand how services, APIs, and databases interact, which is essential for effective troubleshooting.
Build 181400 adds Oracle Cloud Application Monitoring, letting you track Oracle Cloud applications’ performance and availability directly in Applications Manager.
Integrations include ManageEngine ServiceDesk Plus, ServiceNow, Site24x7, AlarmsOne, Slack, Prometheus, AWS, Google Cloud, Microsoft Azure, Oracle, and MySQL.
Pros and Cons
Pros:
- Simplifies management of applications and their relationships
- Real-time alerting system helps teams respond promptly to issues
- Monitors a wide range of applications and infrastructure components
Cons:
- The tool can be resource-intensive
- Setting up the tool to meet specific needs can be challenging
New Product Updates from ManageEngine Applications Manager
Oracle Cloud Application Monitoring Now Available in ManageEngine Applications Manager
ManageEngine Applications Manager introduces Oracle Cloud Application Monitoring, Oracle Cloud Function Monitoring, and Oracle Cloud NAT Gateway Monitoring. These new capabilities help teams monitor Oracle Cloud applications, serverless workloads, and network resources from a single platform. For more information, visit ManageEngine Applications Manager's official site.
 .
.
Site24x7 provides monitoring tools for use on applications, websites, networks, servers, public and private clouds, and synthetic web transactions.
Why I picked Site24x7: Among the list of Site24x7’s customers are some recognizable names in education, like Stanford and Oxford, and the product makes a good case for why. For starters, it complies with many of the standards imposed on educational institutions, including SOC 2 and ISO 27001, so you’re comfortable handling student and staff data.
Site24x7 standout features and integrations:
Features that make Site24x7 ideal for educational institutions include the fact that it’s elastic and can automatically scale resource provision up or down based on usage, something that fluctuates throughout the day on a campus.
I also liked that it provides integrations for several popular avenues used for service requests and communication, including Discord, Microsoft Teams, Slack, ServiceNow, Freshdesk, and Telegram. I liked how easily this lets you collect feedback directly from students and faculty.
Integrations are pre-built for Jenkins, Bitbucket, GitHub, Freshdesk, Jira, Slack, Teams, Amazon EventBridge, ServiceNow, and Discord.
Pros and Cons
Pros:
- Unified monitoring for different platform types, including websites and clouds
- Supports popular communication apps
- Compliant with education industry standards
Cons:
- Crowded UI
- Doesn’t automatically group notifications, so they can be overwhelming
New Product Updates from Site24x7

Site24x7 Adds Discovery Issues for AWS Monitoring
Site24x7 added Discovery Issues for AWS monitoring, helping teams identify why resources are not being discovered across services and regions. The feature surfaces permission gaps, policy restrictions, and blocked API actions to support faster troubleshooting. For more information, visit Site24x7’s official site.
 .
.
New Relic is an observability platform that provides engineers and data scientists with data from a variety of sources, including web and mobile apps, infrastructure, and networks.
Why I picked New Relic: New Relic made it onto my list because of Errors Inbox, a full-stack error management feature. In my tests, I used it to group similar errors depending on importance, so I wasn’t getting the same notifications for both severe and negligible issues. I was also able to set it up so particular notifications go directly to the relevant team in Slack.
New Relic standout features and integrations:
Features that make New Relic the ideal APM for error tracking include the ability to set up a workload in a pre-production environment and have it flag issues before they get to production, then send notifications to Slack immediately.
I also found that it keeps error data even after they’ve been resolved, so you can go through things like contextual information, attachments, and comments after the fact if you need to know how something got addressed and who was involved.
Integrations are pre-built for VMware vSphere, Relic, Kafka, HAProxy, JFrog, Apache Cassandra, Amazon ECS, Netlify, Oracle Database, and NGINX.
Pros and Cons
Pros:
- Stores error data
- Targeted notifications for errors
- Error grouping
Cons:
- Can get expensive
- The number of features can be overwhelming for new users
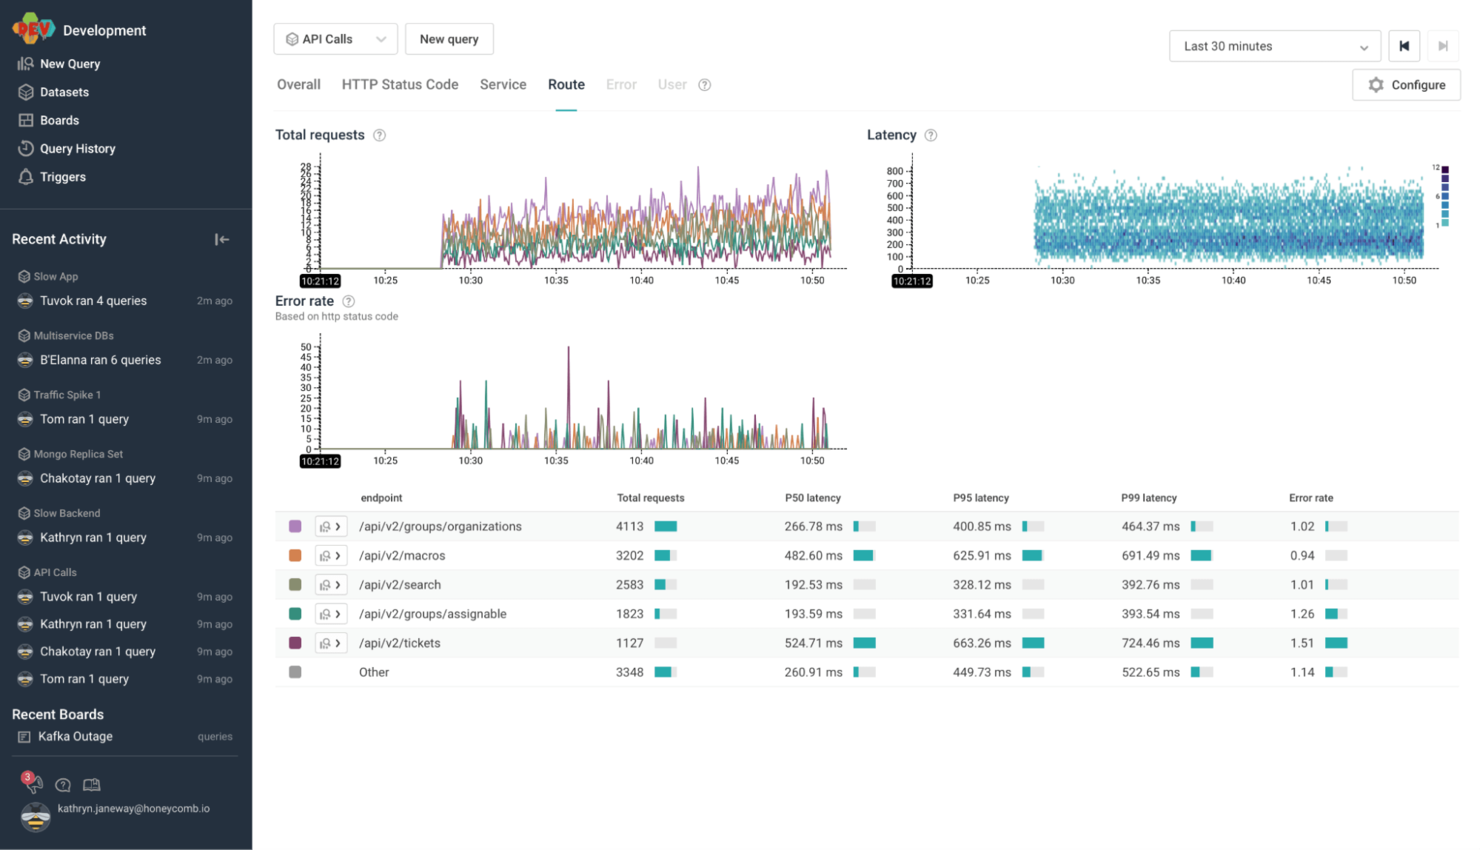
Honeycomb is an event management platform for distributed services that seeks to provide insight from one hub.
Why I picked Honeycomb: If the application you’re looking to monitor is actually a game, then I think Honeycomb might be the right solution for your team. I tested its distributed tracing functions as implemented alongside a feature called BubbleUp; BubbleUp analyzes requests from different teams for common trends to give you a more holistic picture of how users interact with the product. In a game development scenario, the data could be about players and collected from teams such as development, audio, and design.
Honeycomb standout features and integrations:
Features that make Honeycomb ideal for game development companies, in my opinion, include Service Map, which creates a visual representation of all linked services in your application; this is a valuable tool for monitoring games designed as microservices, considering you can also use it to conduct visual debugging.
OpenTelemetry allows you to instrument your code for Honeycomb so you can generate your own telemetry data. You only need to set it up once, and you can use the data on any back-end service you want, so you don’t worry about being locked into a vendor.
Integrations are pre-built for GitHub, LaunchDarkly, CircleCI, Terraform, Consul, AWS Lambda, Slack, PagerDuty, Chef, and GitLab.
Pros and Cons
Pros:
- Strong distributed tracing features
- Good for managing microservices
- Custom telemetry
Cons:
- Takes a while to set up and get used to
- Expensive

Instana Observability, often referred to simply as Instana, is an APM from IBM that provides automated full-stack visibility and quick notifications.
Why I picked IBM Instana: In my evaluation, I found that Instana has robust features for incident reporting, including AI-powered alerts. As soon as it discovers a service, it automatically starts tracking KPIs related to it, i.e., errors, load, and latency and sends out a notification whenever they go above or below an acceptable level.
IBM Instana standout features and integrations:
Features that I found make IBM Instana ideal for incident management include automatically recognizing and logging changes based on whether something goes live or offline, then tying it to other activity to determine if it needs to send an alert. It also provides you with contextual information when it does send an alert so you can decrease the amount of time you spend addressing issues in your application.
Integrations are pre-built for OpsGenie, Microsoft 365, Slack, Traefik, PagerDuty, Jaeger, TIBCO EMS, VMware Tanzu, Coralogix, and Splunk.
Pros and Cons
Pros:
- Strong automation features
- Accurate incident and change detection
- Simplifies remediation with detailed notifications
Cons:
- Takes a while to fully configure
- High processor usage

CloudWatch is an APM that makes up part of the AWS family from Amazon, with a focus on collecting logs and metrics across clouds.
Why I picked Amazon CloudWatch: Even though CloudWatch is a versatile tool that you can deploy even on-premise, I’ve found it works best if you keep it on AWS. You can use it to monitor apps you’ve deployed under different AWS accounts and services, including ECS, S3, and Lambda, and get data from all of them in one place.
Amazon CloudWatch standout features and integrations:
Features that make CloudWatch my preferred APM for AWS include the fact that it’s FedRamp and PCI compliant, with the option to use Amazon Key Management Service (KMS) to encrypt logs and increase security compliance.
As far as gathering the logs, you have several options if you’re on AWS, including VPC Flow Logs and Route 53 for vended logs or collecting them from AWS services that publish them, including ECS and API Gateway.
Integrations are native for other AWS products and services, including DynamoDB, CloudTrail, ECS, EKS, FarGate, API Gateway, VPC Flow Logs, Route 53, Lambda, and EventBridge.
Pros and Cons
Pros:
- Strong support for logging
- Is part of the AWS free tier
- Natively integrates with useful AWS services
Cons:
- Relies heavily on other tools
- Weaker outside AWS

Grafana is an open-source observability platform from Grafana Labs that can handle full-stack monitoring on both cloud and self-hosted environments.
Why I picked Grafana: I chose Grafana because it’s open-source and provides several useful monitoring features for users that want to go the self-managed route. One standout feature is Agent, which you can use to collect telemetry data, including traces, logs, and metrics, then send them to your preferred endpoint as long as it’s compatible with OpenTelemetry, Loki, or Prometheus.
Grafana standout features and integrations:
Features that made me recommend Grafana include its transparency and accessibility. Being open-source gives you the option to build your own features, and generally makes for more secure and cost-effective products. I also liked that you can try a fully-interactive online demo without having to contact the sales team. If your project needs additional monitoring, you can easily integrate additional Grafana tools for both back-end and front-end monitoring, which provide the ability to collect real-user data for logs, metrics, traces, and events.
Integrations are pre-built for GitHub, GitLab, Jenkins, Consul, Traefik, Snowflake, CloudWatch, Kafka, Redis, and Oracle Database.
Pros and Cons
Pros:
- Free interactive web demo
- Robust data visualization features
- Open-source
Cons:
- Requires deeper technical expertise to get the most out of it
- Logs don’t persist natively
Otras Herramientas de Monitorización de Aplicaciones
¿Sigues buscando? Aquí tienes otras herramientas sólidas que encontré mientras investigaba esta lista y que pueden darte opciones adicionales.
- Google Cloud Operations
APM for Google Cloud
- SolarWinds Server and Application Monitor
Dependency mapping
- LogRocket
For e-commerce companies
- eG Innovations
For Node.js applications
- Icinga
For open-source monitoring
- Dotcom Monitor
For simulating & scripting user behavior
- Coralogix
Tracing data
- Sumo Logic
For on-premise deployments
- LogicMonitor
Automation features
- Zabbix
Network monitoring features
- Checkmk
For ITOps
- IBM Turbonomic
For Kubernetes environments
- Veeam ONE
Disaster recovery features
- Azure Monitor Application Insights
APM for Azure
- Microsoft System Center
For data center management


How I Evaluate Application Monitoring Tools
I evaluate tools on two layers: the baseline APM capabilities needed to trace a latency spike through microservices, and the differentiators that make one tool a better fit than another.
Core Functionality (Table Stakes For This List)
When I'm selecting tools for my list, I rank each one on a scale from 0 (does not offer the functionality) to 5 (excels in this area) for each core functionality listed below. Then, I calculate the tool's total score into a percentage. Each tool needs to achieve a minimum total score of 75% to be considered for inclusion.
- Real-Time Performance Monitoring: I check whether the tool surfaces response times, throughput, and resource usage in real time—like catching a sudden latency spike on a checkout API mid-deployment.
- Distributed Tracing: Tracing a single request across dozens of microservices is where tools prove their value, so I evaluate how each one maps dependencies and isolates slow spans.
- Error & Exception Tracking: I look for automatic error grouping with full stack traces and contextual data, such as tying a surge in 500 errors back to a specific release or environment.
- Alerting & Anomaly Detection: Good alerting goes beyond static thresholds. I evaluate whether tools support dynamic baselines and route notifications to channels like Slack or PagerDuty.
- Metrics, Logs & APM Dashboards: Correlating a memory leak in metrics with a matching log pattern and a slow trace should happen in one view. I look at how well each tool unifies these signals.
- Multi-Stack & Cloud Integration: Whether your stack runs on Kubernetes, serverless functions, or VMs across AWS, Azure, or GCP, I check the breadth of supported languages, frameworks, and platforms.
Once I have a list of tools that meet this criteria, I consider what sets each platform apart.
Differentiating Factors (What Sets Vendors Apart)
Here's how I compare and contrast different vendors:
Standout Features
AIOps capabilities matter here—when an on-call engineer gets paged at 2 a.m., automated root cause analysis can cut triage from hours to minutes. I also evaluate real user monitoring, which reveals how actual users experience your app rather than what your servers report. Release tracking is another differentiator I look for. Tools that correlate error spikes or latency shifts with a specific deployment make it far easier to decide whether to roll back or push a fix forward.
Beyond Features
Pricing predictability is a big one—telemetry costs can balloon fast, so I evaluate whether a vendor charges by host, data volume, or user, and how transparent those costs stay at scale. Integration support also matters. I check for native OpenTelemetry compatibility and connectors to incident tools like PagerDuty or ServiceNow, since APM data only helps if it reaches your on-call workflows. Security and compliance certifications like SOC 2 Type II and HIPAA are worth confirming early, especially if your team handles sensitive data.
Cómo elegir una herramienta de monitorización de aplicaciones
Es fácil perderse en listas interminables de funciones y estructuras de precios complejas. Para ayudarte a mantener el enfoque durante tu proceso de selección de software, aquí tienes una lista de factores a considerar:
| Factor | Qué tener en cuenta |
|---|---|
| Escalabilidad | ¿La herramienta puede crecer junto con tu negocio? Asegúrate de que maneje un aumento de tráfico y datos sin comprometer el rendimiento. |
| Integraciones | ¿Se integra con tu pila de software actual? Busca compatibilidad con las herramientas que ya utilizas para evitar interrupciones. |
| Personalización | ¿La herramienta se puede adaptar a tus necesidades específicas? Evalúa su flexibilidad para ajustarse a tu flujo de trabajo y requerimientos. |
| Facilidad de uso | ¿La interfaz es amigable? Considera cuán rápido tu equipo puede aprender a usarla eficazmente sin una capacitación extensa. |
| Implementación y aprendizaje | ¿Cuánto tiempo llevará la configuración? Revisa si hay recursos disponibles como tutoriales o soporte para facilitar la transición. |
| Costo | ¿Se ajusta a tu presupuesto? Compara los planes de precios y analiza los costos a largo plazo, incluidos posibles cargos ocultos o adicionales. |
| Medidas de seguridad | ¿Existen medidas de protección de datos? Verifica la conformidad con estándares del sector y evalúa el cifrado y los controles de acceso. |
¿Qué son las herramientas de monitorización de aplicaciones?
Las herramientas de monitorización de aplicaciones son soluciones de software diseñadas para rastrear, analizar y gestionar el rendimiento de las aplicaciones. Los profesionales de TI, desarrolladores y equipos de operaciones suelen utilizar estas herramientas para garantizar un rendimiento óptimo de las aplicaciones y la satisfacción del usuario.
Las capacidades de monitorización, alerta e informes ayudan a identificar problemas, mantener la disponibilidad y optimizar los recursos. Estas herramientas, en definitiva, proporcionan tranquilidad al asegurar que las aplicaciones funcionen de manera fluida y eficiente.
Funciones
Al elegir herramientas de monitoreo de aplicaciones, presta atención a las siguientes características clave:
- Monitoreo en tiempo real: Supervisa continuamente el rendimiento de la aplicación para identificar y abordar problemas a medida que surgen.
- Sistema de alertas: Envía notificaciones a los usuarios cuando los indicadores de rendimiento están fuera de los umbrales aceptables, permitiendo una respuesta rápida.
- Registro de errores: Identifica y registra errores dentro de las aplicaciones, ayudando a los desarrolladores a solucionar y resolver problemas de manera eficiente.
- Paneles personalizables: Permite a los usuarios adaptar la interfaz para mostrar los datos más relevantes según sus necesidades específicas.
- Integraciones: Se conecta sin problemas con otras herramientas y software de monitoreo de hardware, asegurando un flujo de trabajo y un intercambio de datos cohesionados.
- Escalabilidad: Se adapta al crecimiento de las necesidades empresariales, gestionando un aumento de datos y tráfico sin afectar el rendimiento.
- Monitoreo de experiencia del usuario: Evalúa las interacciones de los usuarios finales para garantizar el óptimo funcionamiento y satisfacción con la aplicación.
- Visualización de datos: Transforma datos complejos en gráficos y tablas fácilmente comprensibles para un mejor análisis.
- Medidas de seguridad: Protege los datos sensibles mediante cifrado y controles de acceso, asegurando el cumplimiento de los estándares de la industria.
- Capacidades de generación de informes: Crea informes detallados sobre el rendimiento de la aplicación, ofreciendo información útil para la toma de decisiones informada.
Beneficios
Implementar herramientas de monitoreo de aplicaciones aporta varios beneficios para tu equipo y tu empresa. Aquí tienes algunos que puedes esperar:
- Mayor disponibilidad: Al identificar rápidamente los problemas mediante el monitoreo en tiempo real, estas herramientas ayudan a que las aplicaciones funcionen sin interrupciones.
- Resolución eficiente de problemas: El registro de errores y los sistemas de alerta permiten resolver los problemas más rápido, reduciendo el tiempo de inactividad y la frustración del usuario.
- Mejor experiencia del usuario: Monitorear las interacciones de los usuarios garantiza que las aplicaciones cumplan con las expectativas de rendimiento y aumenten la satisfacción.
- Información basada en datos: Los informes y la visualización de datos proporcionan recomendaciones útiles que ayudan a los equipos a tomar decisiones informadas.
- Escalabilidad: Las herramientas que se adaptan al crecimiento de los datos y el tráfico aseguran un rendimiento consistente a medida que la empresa crece.
- Ahorro de costos: Al evitar grandes caídas del sistema y optimizar el uso de recursos, estas herramientas ayudan a reducir los costos operativos.
- Garantía de seguridad: Funciones como las medidas de seguridad protegen los datos sensibles, mantienen el cumplimiento legal y generan confianza en los usuarios.
Costos y Precios
Seleccionar herramientas de monitoreo de aplicaciones requiere comprender los diferentes modelos y planes de precios disponibles. Los costos varían según las funciones, el tamaño del equipo, los complementos y más. La siguiente tabla resume los planes más comunes, sus precios promedio y las características habituales que incluyen las soluciones de monitoreo de aplicaciones:
Tabla comparativa de planes para herramientas de monitoreo de aplicaciones
| Tipo de plan | Precio promedio | Características comunes |
|---|---|---|
| Plan gratuito | $0 | Monitoreo básico, retención de datos limitada y soporte comunitario. |
| Plan personal | $5-$25/user/month | Alertas en tiempo real, informes básicos y soporte por correo electrónico. |
| Plan empresarial | $30-$75/user/month | Análisis avanzado, integraciones con otras herramientas y soporte telefónico. |
| Plan corporativo | $100-$250/user/month | Paneles personalizables, gestión de cuentas dedicada y soporte prioritario. |
Preguntas frecuentes sobre herramientas de monitoreo de aplicaciones
Aquí tienes respuestas a preguntas comunes sobre herramientas de monitoreo de aplicaciones:
¿Pueden las herramientas de monitoreo de aplicaciones integrarse con software existente?
Sí, la mayoría de las herramientas de monitoreo de aplicaciones pueden integrarse con sistemas de software existentes. Suelen ofrecer APIs y conectores preconfigurados para plataformas populares como AWS, Azure y Slack. Esto garantiza un flujo de datos sin interrupciones y colaboración en todo tu stack tecnológico, mejorando la eficiencia general.
¿Cómo manejan las herramientas de monitoreo de aplicaciones la privacidad de los datos?
Las herramientas de monitoreo de aplicaciones priorizan la privacidad de los datos utilizando cifrado y controles de acceso. Al seleccionar una herramienta, revisa sus políticas de privacidad y cumplimiento con normativas como GDPR o HIPAA. Elige siempre una herramienta que se alinee con los requisitos de protección de datos de tu organización.
¿Requieren estos herramientas agentes, y cómo difiere la instalación?
La mayoría de las herramientas utilizan agentes para obtener una visión más profunda de las aplicaciones y la infraestructura. Los métodos de instalación varían desde scripts sencillos hasta implementación basada en contenedores o gestores de paquetes. Algunas herramientas ofrecen opciones sin agentes, aunque con funcionalidad o visibilidad limitada.
¿Es necesario tener conocimientos técnicos para utilizar herramientas de monitoreo de aplicaciones?
No, no necesitas grandes conocimientos técnicos para utilizar herramientas de monitoreo de aplicaciones. Muchas soluciones tienen interfaces fáciles de usar y proporcionan tutoriales y soporte para ayudarte a empezar. Sin embargo, tener una comprensión básica de la arquitectura de tu aplicación puede mejorar tu capacidad para interpretar los datos de manera efectiva.
¿Qué modelos de implementación soportan las herramientas de monitoreo de aplicaciones?
Las opciones de implementación varían según la herramienta: algunas son solo SaaS, mientras que otras admiten entornos on-premise o híbridos. El modelo de implementación suele influir en la forma en que los datos se almacenan y acceden. Es importante confirmar la compatibilidad con tu infraestructura existente.
¿Qué sigue?
Si estás investigando herramientas de monitoreo de aplicaciones, conéctate con un asesor de SoftwareSelect para recibir recomendaciones gratuitas.
Llenas un formulario y tienes una breve charla donde profundizan en los detalles de tus necesidades. Luego recibirás una lista reducida de software para revisar. Incluso te apoyarán durante todo el proceso de compra, incluidas las negociaciones de precios.