10 Best Dynatrace Alternatives Reviewed in 2026

Best Dynatrace Alternatives Shortlist


As a seasoned professional navigating APIs, microservices, and a host of full-stack technologies, I recognize the vital role of effective performance monitoring. Over the years, I've experienced first-hand the merits of using comprehensive AIOps platforms, such as those alternatives to Dynatrace, that offer swift troubleshooting and root cause analysis capabilities.
These Dynatrace substitutes are not just user-friendly, but also impress with their robust monitoring features. The seamless integration with popular platforms such as Slack aids in enhancing team communication during crucial situations. With extensive profiling and modular solutions at your disposal, you're equipped with a potent monitoring platform that can uplift your tech stack and overall productivity.
What Is Dynatrace?
Dynatrace is an application performance monitoring (APM) platform that helps you track, analyze, and optimize how your apps and infrastructure are running. It's used by DevOps teams, SREs, and IT leaders who need to catch issues early and improve user experience. Real-time monitoring, AI-powered alerts, and end-to-end tracing help with finding slowdowns, pinpointing root causes, and keeping systems running smoothly. Overall, Dynatrace helps your team stay ahead of performance problems before they affect users.
Why Trust Our Software Reviews
We’ve been testing and reviewing SaaS development software since 2023. As tech experts ourselves, we know how critical and difficult it is to make the right decision when selecting software. We invest in deep research to help our audience make better software purchasing decisions.
We’ve tested more than 2,000 tools for different SaaS development use cases and written over 1,000 comprehensive software reviews. Learn how we stay transparent & check out our software review methodology.
Best Dynatrace Alternatives Summary
This comparison chart summarizes pricing details for my top Dynatrace alternative selections to help you find the best one for your budget and business needs.
| Tool | Best For | Trial Info | Price | ||
|---|---|---|---|---|---|
| 1 | Best for real-time error resolution | Free plan + free trial + free demo available | From $26/month (billed annually) | Website | |
| 2 | Best for extensive technology support | 30-day free trial + free demo + free plan availabl | From $199/year | Website | |
| 3 | Best for diverse application environments | 30-day free trial + free demo available | From $10/month (billed annually) | Website | |
| 4 | Best for enterprise-level open-source monitoring | Free download available | From $325/month (billed annually) | Website | |
| 5 | Best for comprehensive IT infrastructure monitoring | Free plan and free demo available | From $2,595 (perpetual license for 100 nodes) | Website | |
| 6 | Best for real-time business performance visibility | Free trial available | Pricing upon request | Website | |
| 7 | Best for comprehensive application performance monitoring | Free plan available | From $49/user/month | Website | |
| 8 | Best for log management and security analytics | 30-day free trial | Pricing upon request | Website | |
| 9 | Best for large-scale data analysis and insights | 14-day free trial + free demo available | Pricing upon request | Website | |
| 10 | Best for robust monitoring in Kubernetes environments | Free to use | No licensing cost | Website |
-

TestDevLab
Visit Website -
Site24x7
Visit WebsiteThis is an aggregated rating for this tool including ratings from Crozdesk users and ratings from other sites.4.7 -
GitHub Actions
Visit WebsiteThis is an aggregated rating for this tool including ratings from Crozdesk users and ratings from other sites.4.8


Best Dynatrace Alternatives Reviews
Below are my detailed summaries of the best Dynatrace alternatives that made it onto my shortlist. My reviews offer a detailed look at the key features, pros & cons, integrations, and ideal use cases of each tool to help you find the best one for you.
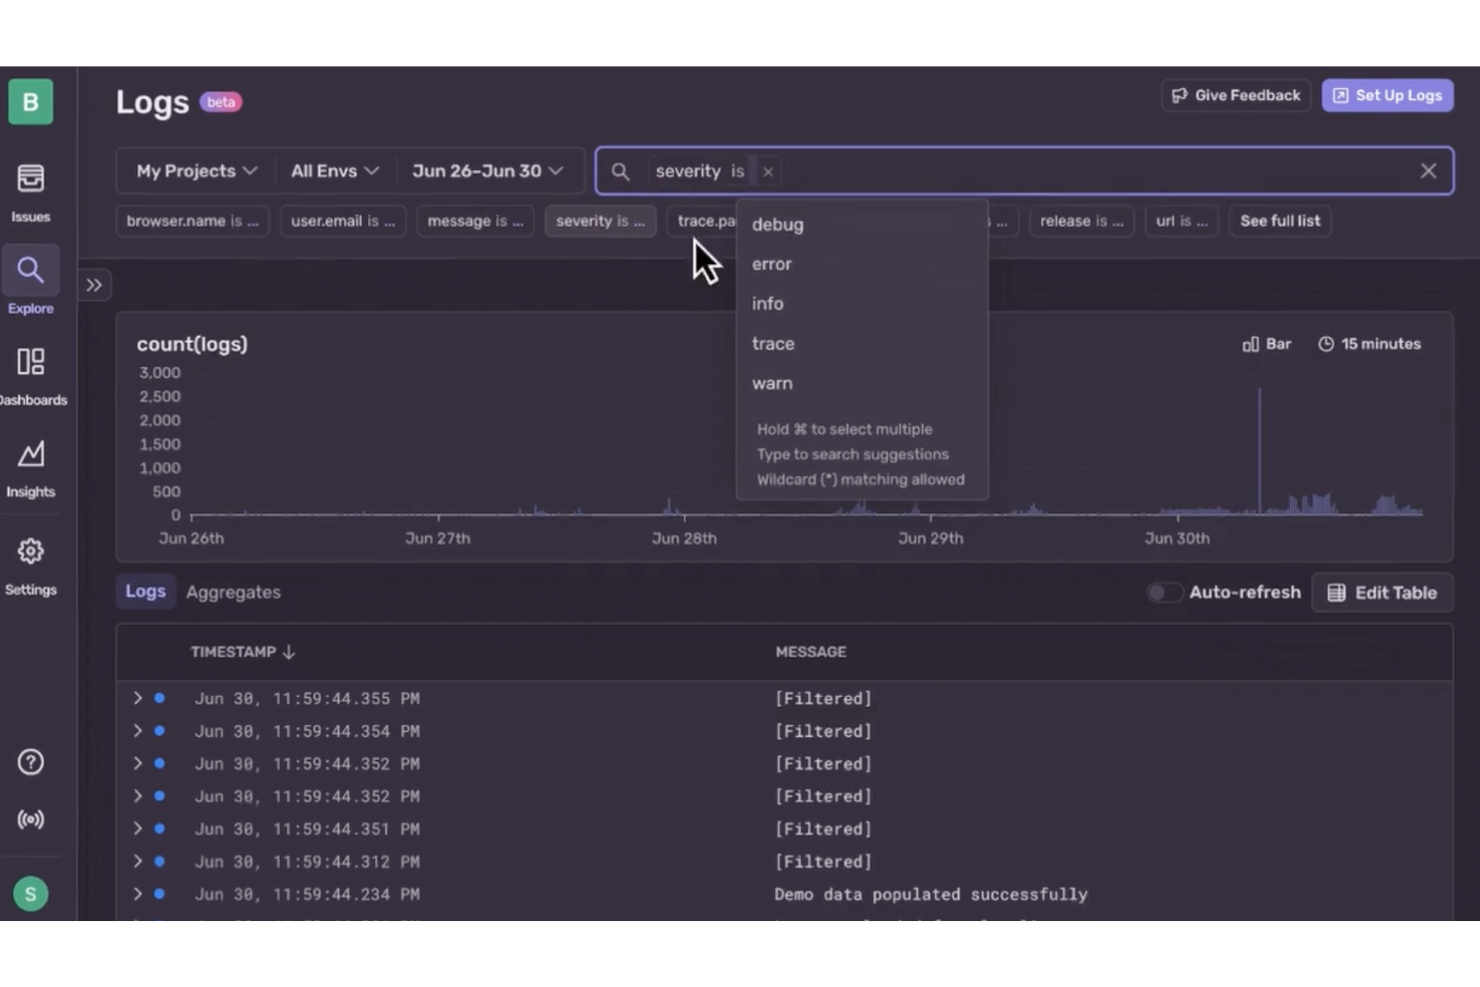
If you're seeking a reliable alternative to Dynatrace, Sentry might just be the solution your development team needs. Designed primarily for developers, Sentry offers an intuitive platform for application performance monitoring and error tracking. It appeals especially to software engineers, web and mobile developers, and IT operations teams who are keen on identifying and resolving application issues in real time. By integrating seamlessly into existing workflows, Sentry helps teams maintain high-quality service and improve user experience, addressing the challenge of efficiently managing and resolving application errors.
Why I Picked Sentry
I picked Sentry as a compelling Dynatrace alternative for its focus on real-time error resolution and detailed error context. Its error-monitoring feature lets your team capture and group unhandled exceptions, providing immediate insights into issues affecting your applications. Additionally, Sentry's session replay functionality provides a deep dive into user interactions, helping you trace errors back to specific code lines. These capabilities enable your team to quickly identify and address performance bottlenecks, making Sentry an ideal choice for developers focused on maintaining seamless application performance.
Sentry Key Features
In addition to real-time error resolution, Sentry offers:
- Distributed Tracing: Gain visibility into interactions between frontend and backend systems to diagnose performance issues.
- Release Health Monitoring: Monitor the impact of software releases on application performance, ensuring that updates do not introduce errors.
- Recurring Job Monitoring: Keep an eye on scheduled jobs to ensure they run as expected and identify potential issues quickly.
Sentry Integrations
Integrations include GitHub, Bitbucket, GitLab, Azure DevOps, Heroku, Split, GitHub Actions, Vercel, Netlify, and Expo.
Pros and Cons
Pros:
- Effective frontend observability with session replay features
- Comprehensive monitoring, including performance and crash reporting
- Strong error tracking with per-user exception tracking
Cons:
- Less coverage for infrastructure-level monitoring
- Complex implementation especially for diverse platform stacks
New Product Updates from Sentry

Sentry Adds GitLab Support and gRPC Instrumentation
Sentry adds GitLab support for Seer and gRPC instrumentation for Dart and Flutter to improve root cause analysis, code tracing, and debugging workflows. For more information, visit Sentry’s official site.
 .
.Best for extensive technology support
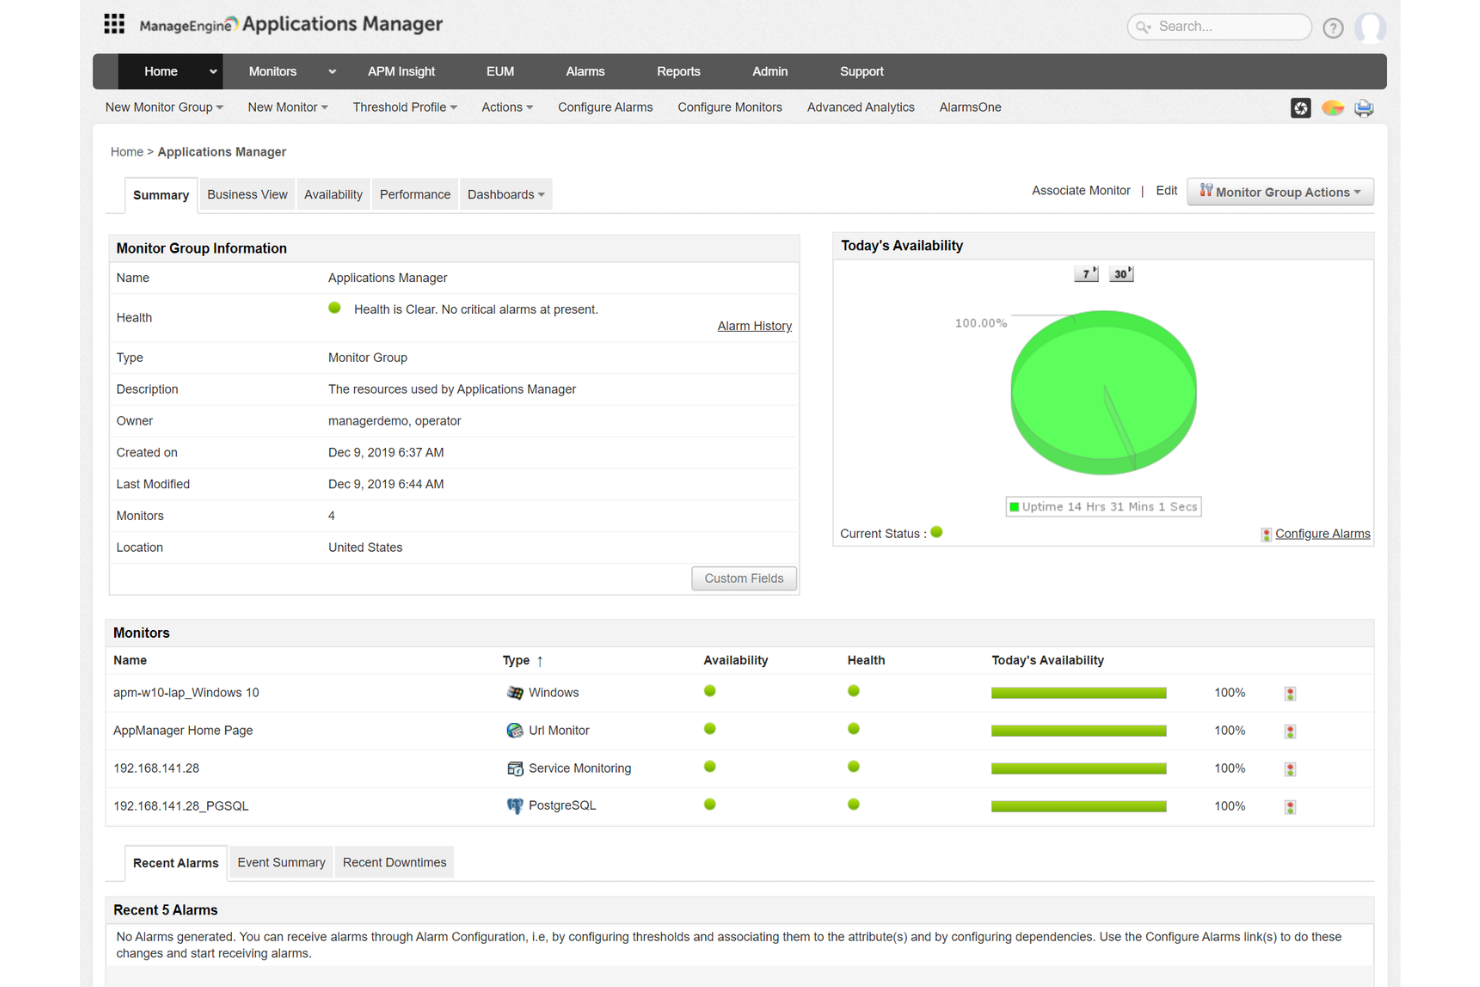
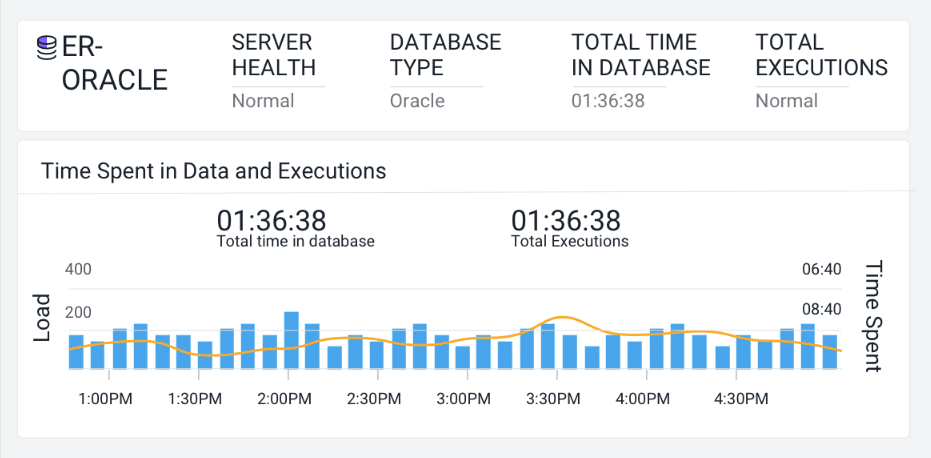
ManageEngine Applications Manager is an application performance monitoring (APM) solution that helps you oversee the health and performance of your business-critical applications and infrastructure components.
Why I Picked ManageEngine Applications Manager:
One reason I like ManageEngine Applications Manager as a Dynatrace alternative is its extensive support for over 150 technologies. This means you can monitor a wide array of applications and infrastructure components, ensuring comprehensive oversight of your IT environment. The tool's ability to provide detailed insights into various systems allows your team to maintain optimal performance across the board.
Standout Features & Integrations:
Other features include synthetic transaction monitoring, which lets you simulate user interactions to identify potential issues before they affect actual users. Additionally, real user monitoring captures the experiences of real users, providing insights into how your applications perform under various conditions. Some integrations include ADManager Plus, M365 Manager Plus, OpManager, Site24x7, Log360, EventLog Analyzer, Endpoint Central, ServiceDesk Plus, CloudDNS, CloudSpend, and Zoho Creator.
Pricing:
Pricing for ManageEngine Applications Manager is available upon request.
Pros and Cons
Pros:
- The platform offers customizable dashboards
- Real-time monitoring and alerting to promptly address issues
- Comprehensive monitoring capabilities across various applications and servers
Cons:
- Can be resource-intensive on larger scales
- Initial setup can be complex, requiring careful configuration
New Product Updates from ManageEngine Applications Manager
ManageEngine Applications Manager Adds ServiceDesk Plus MSP Cloud
ManageEngine Applications Manager adds ServiceDesk Plus MSP Cloud integration to automatically create and manage tickets from application alarms, helping teams track and resolve incidents faster. For more information, visit ManageEngine Applications Manager’s official site.
 .
.
Site24x7 is a cloud-based, AI-powered IT monitoring solution that provides comprehensive visibility into your organization's IT environment. It offers monitoring capabilities across websites, servers, networks, applications, and cloud platforms, ensuring optimal performance and availability.
Why I Picked Site24x7:
One reason I like Site24x7 as an alternative to Dynatrace is its application performance monitoring (APM) capabilities. Site24x7 supports various programming languages, including Java, .NET, Ruby, PHP, and Node.js, allowing you to monitor application performance across diverse environments. This feature helps identify application servers and components generating errors, enabling your team to address issues proactively and maintain seamless user experiences.
Standout Features & Integrations:
Other features include network monitoring that provides deep visibility into critical network devices like routers, switches, and firewalls, helping ensure reliability and performance. Additionally, Site24x7 offers log management from the cloud, allowing you to collect, consolidate, index, and search application logs across servers and data centers. Some integrations include Amazon EventBridge, Zoho Analytics, Jira, Microsoft Teams, Slack, AWS, and Microsoft Azure.
Pricing:
Pricing for Site24x7 begins at $35/month (billed annually), with a 30-day free trial available.
Pros and Cons
Pros:
- Comprehensive monitoring capabilities across various IT infrastructure components
- Reliable real-time alerts that enable prompt issue resolution
- Flexible customization options for dashboards and reports
Cons:
- Configuration complexity can be challenging for new users
- Limited integration options with certain third-party tools
New Product Updates from Site24x7

Site24x7 Adds Discovery Issues for AWS Monitoring
Site24x7 added Discovery Issues for AWS monitoring, helping teams identify why resources are not being discovered across services and regions. The feature surfaces permission gaps, policy restrictions, and blocked API actions to support faster troubleshooting. For more information, visit Site24x7’s official site.
 .
.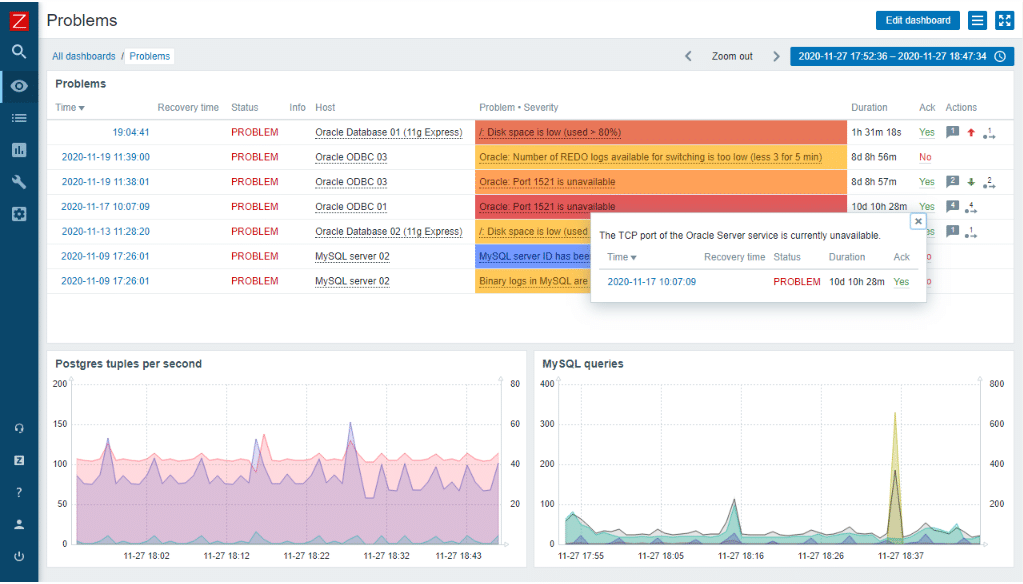
Zabbix is an enterprise-grade, open-source monitoring solution tailored for tracking, recording, alerting, and visualizing data from a diverse array of IT components. The reason it excels at enterprise-level open-source monitoring is due to its scalability, feature-rich platform, and ability to integrate with various systems and applications.
Pros and Cons
Pros:
- Strong community and professional support
- Comprehensive set of features
- Excellent scalability
Cons:
- Advanced support requires additional cost
- Configuration may require a substantial amount of time
- The learning curve can be steep
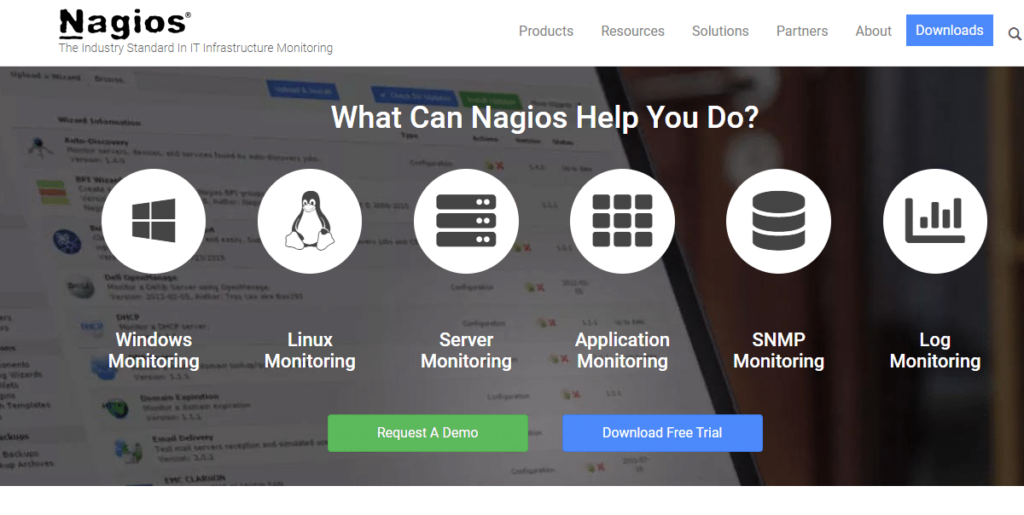
Nagios is a powerful monitoring system that enables organizations to identify and resolve IT infrastructure problems before they affect critical business processes. Given its comprehensive coverage of IT infrastructure monitoring, Nagios is particularly adept at ensuring systems, networks, and applications are operating optimally.
Pros and Cons
Pros:
- Wide range of integrations
- Advanced alerting system
- Comprehensive IT infrastructure monitoring
Cons:
- No official support for the open-source version
- Advanced features require paid plan
- Might be complex for beginners
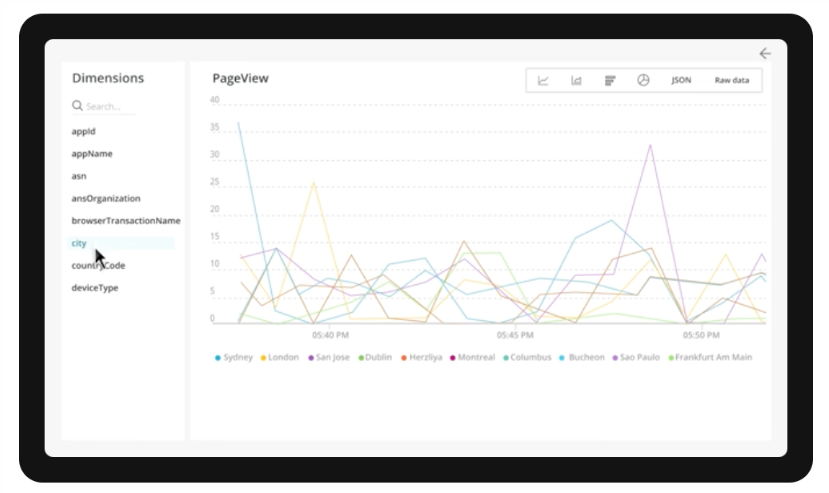
AppDynamics offers a suite of monitoring tools designed to provide deep insights into your business performance. This platform excels at giving a real-time view of your business metrics, making it ideal for those needing immediate visibility into their performance.
Pros and Cons
Pros:
- Comprehensive application and infrastructure monitoring
- Robust integrations with popular platforms
- Provides real-time business performance visibility
Cons:
- Interface may seem cluttered due to the amount of data presented
- May be complex for beginners
- Can be expensive for smaller teams
New Relic is a platform that provides an extensive range of solutions for monitoring and optimizing application performance. The software offers an impressive blend of tools, enabling users to track every aspect of their application lifecycle, justifying its position as best for comprehensive application performance monitoring.
Pros and Cons
Pros:
- Features customizable dashboards for unique user experience
- Provides robust set of integrations
- Offers comprehensive application performance monitoring
Cons:
- Smaller teams might not utilize all features
- Pricing can be complex
- Higher learning curve due to broad feature set
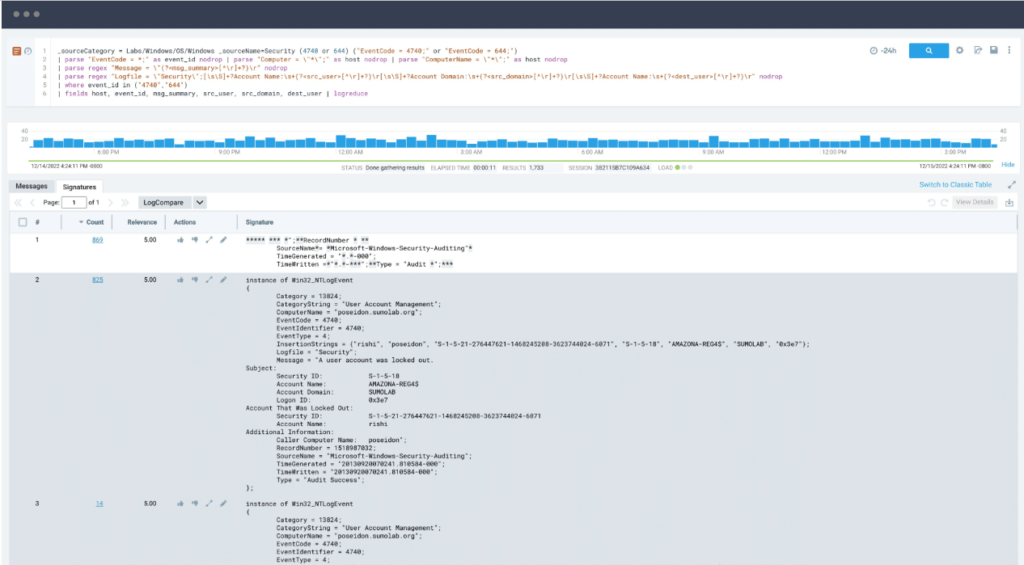
Sumo Logic is a cloud-based platform that excels in aggregating, analyzing, and visualizing log data to aid in IT operations, application monitoring, and security analytics. Its potent capacity for log management, coupled with advanced security analytics, makes it a standout choice for teams focusing on these areas.
Pros and Cons
Pros:
- Predictive insights through machine learning
- Effective integrations with various platforms and services
- Robust log management and security analytics
Cons:
- Heavy dependency on internet connectivity due to its cloud-based nature
- The interface may be complex for some users
- High cost can be a barrier for small to medium-sized organizations
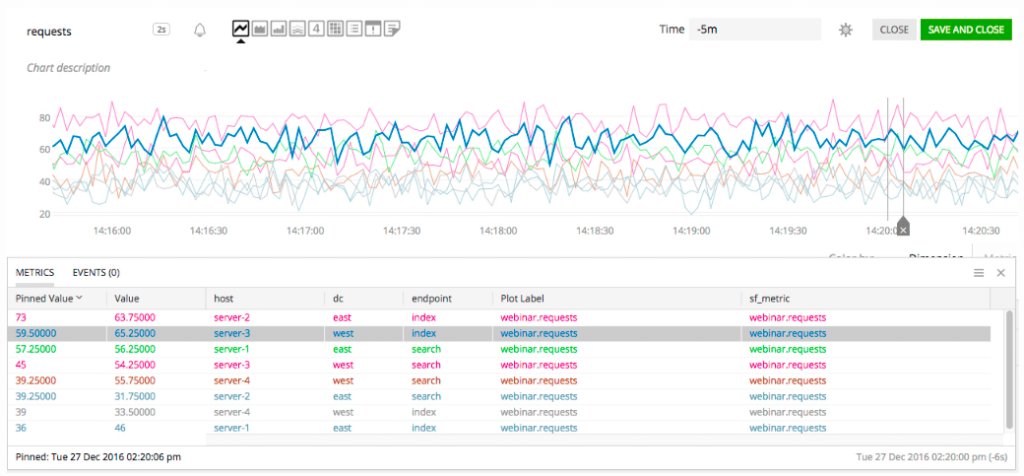
Splunk is a platform designed to collect and analyze high volumes of machine-generated data. It's an excellent choice for those who need in-depth insights from large data sets.
Pros and Cons
Pros:
- Robust integrations with major platforms
- Powerful predictive analytics and machine learning features
- Capable of handling and analyzing large data sets
Cons:
- Customization can be complex
- Has a steeper learning curve
- Can be expensive for smaller companies
Prometheus is an open-source service monitoring system and time series database. It collects metrics from monitored targets by scraping metrics HTTP endpoints on these targets, which complements its position as the best for robust monitoring in Kubernetes environments.
Pros and Cons
Pros:
- Powerful query language, PromQL
- Robust monitoring capabilities in Kubernetes environments
- Open-source and highly flexible
Cons:
- Visualization features are not as extensive as some other tools
- Lacks native long-term storage capabilities
- Can be complex to set up and use
Other Dynatrace Alternatives
Here are some additional Dynatrace alternatives that didn’t make it onto my shortlist, but are still worth checking out:
- Grafana Cloud
For open-source visualization and analytics
- Elastic
For real-time search and data analytics
- SolarWinds Observability SaaS
For AI-driven alert prioritization
- Sysdig
For container and Kubernetes security
- Datadog
For unified cloud service tracking
- Dotcom Monitor
For real-browser simulations
- Auvik
Good for comprehensive network infrastructure management
- Pingdom
Good for uptime, performance, and user experience monitoring
- LogicMonitor
Good for SaaS-based, agentless monitoring
- Icinga
Good for comprehensive monitoring with strong community support
- Honeycomb
Good for observability and debugging in production systems
- Sensu
Good for robust event filtering in monitoring workflows
- Stackify Retrace
Good for deep code-level insights for developers
- Instana
Good for real-time performance monitoring with automatic APM
- ThousandEyes
Good for network intelligence and visualizing network paths
- Scout APM
Good for developers wanting detailed performance insights
- Opsview
Good for businesses seeking customizable dashboards and reporting
- Riverbed
Good for network performance monitoring with digital experience focus
- Wavefront by VMware
Good for scalable, high-granularity observability and analytics


Other Software Reviews
How I Evaluate Dynatrace Alternatives
I evaluate every tool on two levels: the must-haves like full-stack APM and distributed tracing, then the differentiators that separate platforms for different teams and stacks.
Core Functionality (Table Stakes For This List)
When I'm selecting tools for my list, I rank each one on a scale from 0 (does not offer the functionality) to 5 (excels in this area) for each core functionality listed below. Then, I calculate the tool's total score into a percentage. Each tool needs to achieve a minimum total score of 75% to be considered for inclusion.
- Full-Stack APM: I check whether the tool provides code-level transaction tracing across major languages and frameworks, like catching a slow database call buried in a Java microservice.
- Infrastructure Monitoring: Each tool should cover servers, containers, Kubernetes clusters, and cloud services with auto-discovery rather than requiring manual host-by-host setup.
- Distributed Tracing: I evaluate how traces flow across service boundaries and whether the platform supports OpenTelemetry ingestion, which matters when teams run polyglot stacks.
- Log Management & Analytics: Logs need to be correlated with traces and metrics in a single view, so an SRE can pivot from a spike in error rates to the exact log lines behind it.
- AI-Driven Anomaly Detection: I look for machine learning that baselines normal behavior and surfaces root cause suggestions, not just static threshold alerts that flood on-call channels.
- Real User & Synthetic Monitoring: The platform should offer both RUM for live traffic analysis and synthetic checks that catch broken checkout flows or API failures before real users do.
Once I have a list of tools that meet this criteria, I consider what sets each platform apart.
Differentiating Factors (What Sets Vendors Apart)
Here's how I compare and contrast different vendors:
Standout Features
Pricing transparency matters when you're switching from Dynatrace, so I evaluate whether a platform offers predictable, usage-based pricing with clear cost controls. OpenTelemetry native support is another key differentiator—teams already instrumented with OTel collectors shouldn't need to rip everything out for proprietary agents. I also look for automated remediation workflows that trigger runbooks or escalate through tools like PagerDuty when an anomaly fires, turning alerts into action without manual intervention.
Beyond Features
Deployment flexibility is a big one—I check whether a platform supports SaaS, self-hosted, and hybrid models, since teams in regulated industries often need on-prem or specific data residency options. The integration ecosystem also shapes how well a tool fits your existing stack. Native connectors to CI/CD pipelines, ITSM platforms like ServiceNow, and incident tools like Opsgenie make a real difference during adoption. I also evaluate compliance certifications like SOC 2 Type II and ISO 27001, along with SSO and role-based access controls.
Why Look For A Dynatrace Alternative?
While Dynatrace is a good choice of application performance monitoring (APM) platform, there are a number of reasons why some users seek out alternative solutions. You might be looking for a Dynatrace alternative because…
- Pricing can get too steep for smaller teams
- Learning curve feels too high for new users
- You want simpler dashboards and reporting
- You need more flexible alerting and notification options
- You're running a hybrid setup and need broader integrations
- You prefer tools with more transparent billing
If any of these sound like you, you’ve come to the right place. My list contains several application performance monitoring (APM) platform options that are better suited for teams facing these challenges with Dynatrace and looking for alternative solutions.
Dynatrace Key Features
Here are some of the key features of Dynatrace, to help you contrast and compare what alternative solutions offer:
- Full-stack monitoring: Lets you track app performance, infrastructure, and user experience all in one place.
- Davis AI engine: Spots problems automatically and explains the root cause to save your team time.
- Real user monitoring: Shows how real users interact with your app so you can fix issues that matter.
- Application security: Flags vulnerabilities in real time while your code runs in production.
- Cloud-native support: Works well with Kubernetes, AWS, Azure, and other cloud environments.
- Smart alerting: Sends alerts only when needed so your team avoids alert fatigue.
- Custom dashboards: Lets you build views tailored to your team’s needs and metrics.
- Code-level insights: Helps you dig into performance down to individual lines of code.
- Log management: Lets you search, filter, and analyze logs to troubleshoot faster.
- Synthetic monitoring: Simulates user actions so you can test app performance from different locations.
Summary
In this buyer's guide, we dove deep into the realm of Dynatrace alternatives, exploring various options tailored to specific use cases. Whether you're seeking a tool for enterprise-level open-source monitoring, log management and security analytics, or container and Kubernetes security, you have many robust options to consider.
Here are three key takeaways from this guide:
- Assess Your Needs: Different tools are designed with various use cases in mind. Some are good for extensive log management, others for open-source environments, and others still for container and Kubernetes security. Understanding your organization's unique needs will guide you toward the right tool.
- Look at the Features: Tools may have similar core functions, but the devil is in the details. The unique features of each tool, their usability, and integrations with other tools you use can make all the difference in your monitoring experience.
- Consider the Pricing: While the cost is often a significant factor, it's important to consider what you're getting for your money. A more expensive tool might provide the robust functionality or support you need, and in some cases, a cheaper or even free tool may meet your needs.
Remember, the 'best' tool depends entirely on your organization's specific requirements and circumstances. Armed with the information in this guide, you are well on your way to making an informed decision.
What do you think?
Certainly, no list can encompass every excellent Dynatrace alternative out there. There might be some great Dynatrace or New Relic alternatives that I didn't cover in this guide. If you've used or heard about a tool that you believe deserves a spot on this list, please share your thoughts.
Your insights and experiences could be invaluable to others exploring their options. I look forward to hearing from you.