19 Best SRE Monitoring Tools in 2026

Best SRE Monitoring Tools Shortlist


SRE monitoring tools are platforms that help site reliability engineers track system health, detect incidents, and analyze performance across complex infrastructure. These tools are tightly connected to incident management tools and are built to monitor production systems while supporting modern software development workflows. They collect and analyze metrics, logs, and traces to provide real-time visibility, helping teams quickly identify issues and reduce downtime. This guide cuts through the noise to help you compare top options, understand what sets each tool apart, and choose the right fit for your team’s needs in 2026.
Why Trust Our Software Reviews
We’ve been testing and reviewing software since 2023. As tech leaders ourselves, we know how critical and difficult it is to make the right decision when selecting software.
We invest in deep research to help our audience make better software purchasing decisions. We’ve tested more than 2,000 tools for different tech use cases and written over 1,000 comprehensive software reviews. Learn how we stay transparent & our software review methodology.
Best SRE Monitoring Tools Summary
This comparison chart summarizes pricing details for my top SRE monitoring tool selections to help you find the best one for your budget and business needs
| Tool | Best For | Trial Info | Price | ||
|---|---|---|---|---|---|
| 1 | Best for AI-powered infrastructure monitoring | Free demo + 15-day free trial available | From $7/host/month | Website | |
| 2 | Best for cloud-scale observability | Free demo + 14-day free trial available | From $15/host/month (billed annually) | Website | |
| 3 | Best for full-stack monitoring | Free trial + free demo available | Pricing upon request | Website | |
| 4 | Best for cloud log analysis | 30-day free trial + free plan + free demo available | From $79/month (billed annually) | Website | |
| 5 | Best for open-source metrics and alerting | Free to use | No licensing cost | Website | |
| 6 | Best for Google Cloud observability | Free plan available | From $0.1510/MiB for metrics ingested | Website | |
| 7 | Best for AWS-native monitoring | Free plan available | Pricing upon request | Website | |
| 8 | Best for monitoring data visualization | Free plan available | From $19/month + usage | Website | |
| 9 | Best for log processing pipelines | 7-day free trial available | Pricing upon request | Website | |
| 10 | Best for time series data monitoring | 30-day free trial available | Pricing upon request | Website |
-

Freshservice
Visit WebsiteThis is an aggregated rating for this tool including ratings from Crozdesk users and ratings from other sites.4.6 -
Deel IT
Visit WebsiteThis is an aggregated rating for this tool including ratings from Crozdesk users and ratings from other sites.4.9 -
Rippling IT
Visit WebsiteThis is an aggregated rating for this tool including ratings from Crozdesk users and ratings from other sites.4.8


Best SRE Monitoring Tools Reviews
Below are my detailed summaries of the SRE monitoring tools that made it onto my shortlist. My reviews offer a detailed look at the features, integrations, and best use cases of each platform to help you find the best one for you.
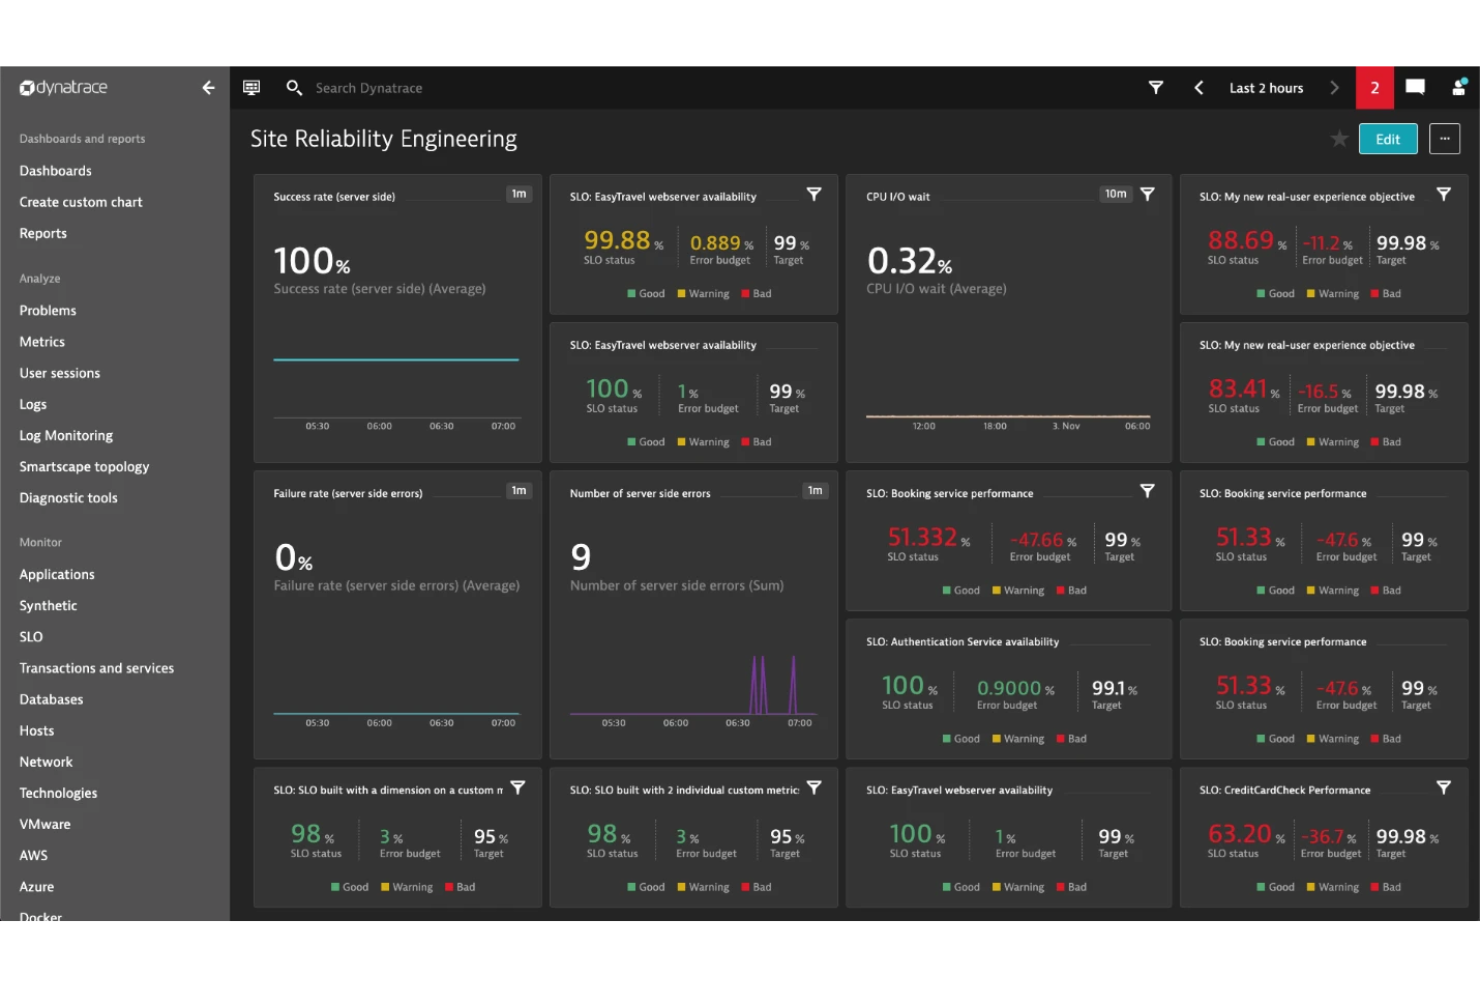
Dynatrace is an observability and security platform for SRE monitoring that combines application performance monitoring, infrastructure monitoring, log analytics, and AI-driven automation in a single solution.
Who Is Dynatrace Best For?
Dynatrace is a strong fit for enterprise SRE teams and IT operations groups managing large-scale, cloud-native environments.
Why I Picked Dynatrace
I picked Dynatrace as one of the best because I rely on its unified observability and security platform to monitor complex, cloud-native environments. I like how its Davis AI engine automatically detects anomalies and pinpoints root causes across infrastructure, applications, and services. My team uses Dynatrace’s automation features to reduce manual effort and keep our SRE workflows running smoothly.
Dynatrace Key Features
- Full-stack monitoring: Tracks metrics across infrastructure, applications, and user experience in real time.
- Smartscape topology mapping: Visualizes dependencies and relationships between services, hosts, and processes.
- Synthetic monitoring: Simulates user interactions to test application performance and availability.
- Log analytics: Collects, indexes, and analyzes log data for troubleshooting and incident response.
Dynatrace Integrations
Dynatrace offers native integrations with AWS, Microsoft Azure, Google Cloud Platform, Kubernetes, Oracle, Alibaba Cloud, and GitHub, with an API available for custom integrations.
Pros and Cons
Pros:
- Granular access controls for large teams
- Automated dependency mapping for microservices
- AI-driven root cause analysis is reliable
Cons:
- Log retention costs can add up quickly
- High resource usage for deep monitoring
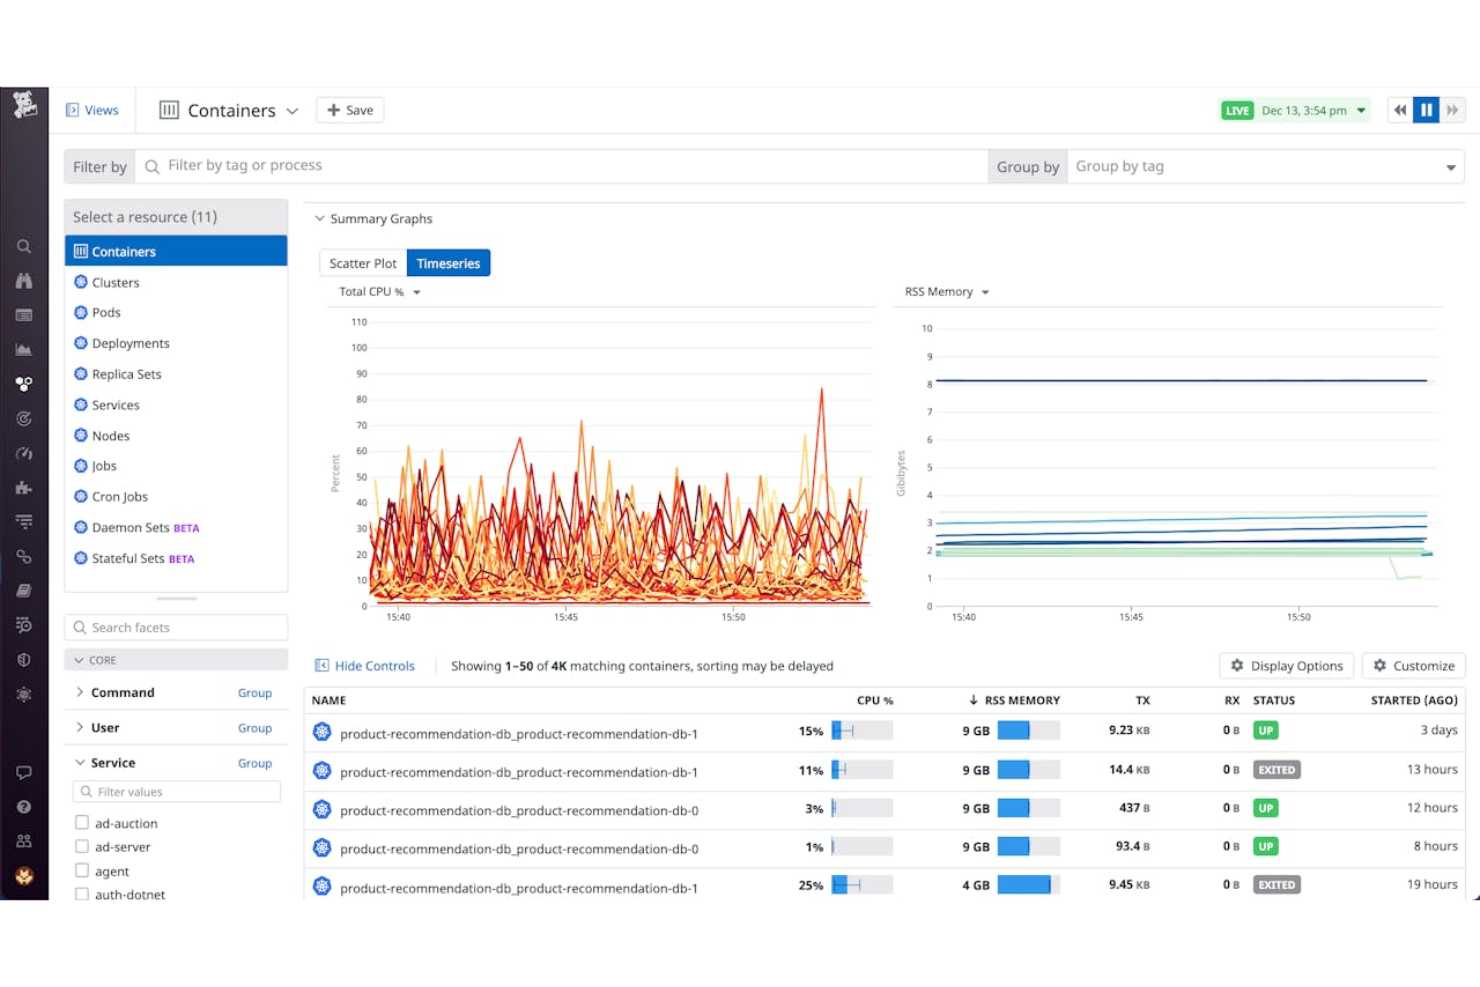
Datadog is a cloud-based monitoring and analytics platform for site reliability engineers that brings together infrastructure monitoring, application performance monitoring, log management, and real-time observability in one system.
Who Is Datadog Best For?
Datadog is a strong fit for cloud-native teams and site reliability engineers at mid-sized to large enterprises managing complex, distributed systems.
Why I Picked Datadog
I picked Datadog as one of the best because I rely on its unified platform to monitor infrastructure, applications, and logs in real time. I like how I can correlate metrics and traces across cloud environments without switching tools. My team uses Datadog’s out-of-the-box dashboards and customizable alerts to quickly spot and investigate incidents across distributed systems.
Datadog Key Features
- Network performance monitoring: Visualize network traffic flow and pinpoint bottlenecks across environments.
- Synthetic monitoring: Simulate user interactions to test application uptime and performance.
- Security monitoring: Detect threats and monitor security events alongside operational data.
- Service dependency mapping: Automatically map relationships between services and infrastructure components.
Datadog Integrations
Datadog offers 1,000+ native integrations, including AWS, Azure, Google Cloud Platform, Kubernetes, Docker, Slack, PagerDuty, Jira, GitHub, ServiceNow, and Salesforce, with an API available for custom integrations.
Pros and Cons
Pros:
- Automated anomaly detection and alerting
- Built-in log management and analytics
- Real-time monitoring across cloud and on-prem
Cons:
- Retention for logs and metrics costs extra
- Limited support for legacy systems
New Relic is a full-stack observability platform for SRE monitoring that brings together application performance monitoring, infrastructure monitoring, distributed tracing, and log management in one system.
Who Is New Relic Best For?
New Relic is a strong fit for SRE teams and DevOps engineers at mid-sized to large organizations managing complex, cloud-based applications.
Why I Picked New Relic
I picked New Relic as one of the best because I rely on its unified telemetry platform to bring together metrics, traces, and logs in one place. I like how its AI-powered insights help my team quickly identify and resolve incidents across our stack. My team uses New Relic’s full-stack observability to monitor everything from cloud infrastructure to application performance in real time.
New Relic Key Features
- Synthetic monitoring: Simulates user interactions to test application uptime and performance.
- Distributed tracing: Tracks requests as they move through microservices and infrastructure.
- Customizable dashboards: Lets you build visualizations tailored to your monitoring needs.
- Alert policies: Enables you to set thresholds and automate incident notifications.
New Relic Integrations
New Relic offers 800+ native integrations, including AWS, Azure, Google Cloud Platform, Kubernetes, Docker, Slack, PagerDuty, Jira, GitHub, ServiceNow, and Salesforce, with an API available for custom integrations.
Pros and Cons
Pros:
- Offers deep observability across cloud-native stacks
- Customizable dashboards for SRE workflows
- Real-time streaming data for rapid incident response
Cons:
- Limited on-premises deployment options
- High data ingest costs for large environments
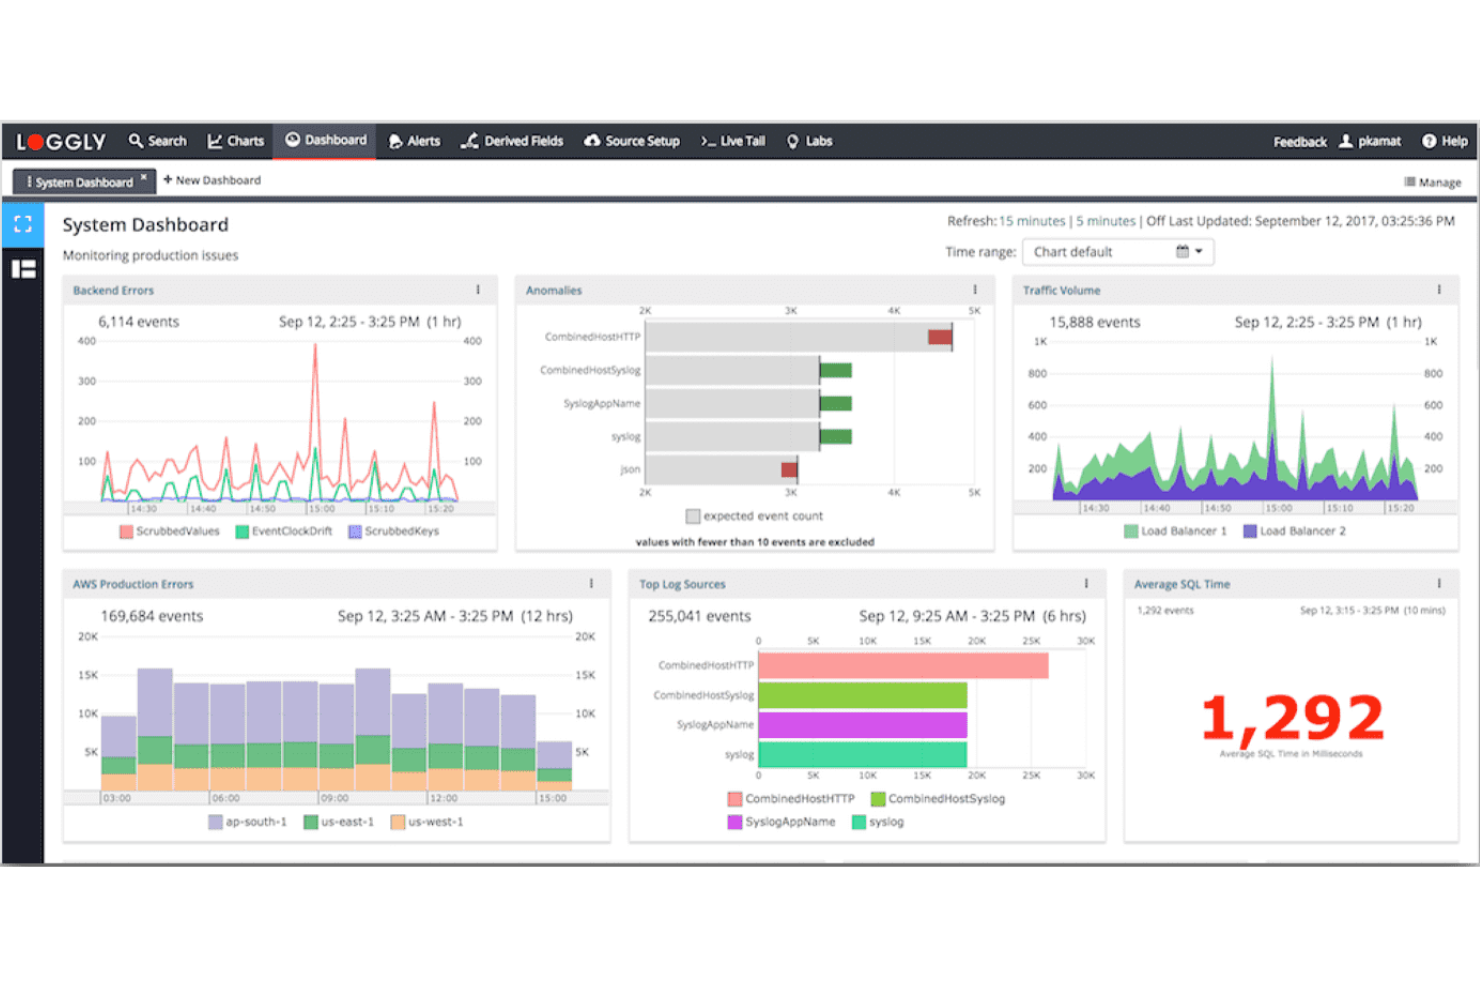
Loggly is a cloud-based log management platform for SRE monitoring that collects, indexes, and analyzes log data from servers, applications, and cloud services in real time.
Who Is Loggly Best For?
Loggly is a strong fit for SREs and IT teams at mid-sized to large organizations managing distributed cloud infrastructure.
Why I Picked Loggly
I picked Loggly as one of the best because I rely on its cloud-based log management to quickly search and visualize massive log volumes. I like how its dynamic field explorer and interactive dashboards let me drill into log data without building custom queries. My team uses its real-time search and automated parsing to monitor distributed systems and spot issues fast.
Loggly Key Features
- Automated alerting: Set up custom alerts based on log events and thresholds.
- Log archiving: Store and retrieve historical log data for compliance and audits.
- RESTful API access: Integrate log data with external tools and workflows.
- Support for multiple log sources: Collect logs from servers, cloud platforms, and network devices.
Loggly Integrations
Loggly offers native integrations with AWS CloudWatch, GitHub, Jira, Slack, Microsoft Teams, and PagerDuty, and provides an API for custom integrations.
Pros and Cons
Pros:
- Supports structured and unstructured log formats
- Visualizes log data with interactive dashboards
- Handles diverse log formats and sources
Cons:
- Alerting lacks advanced correlation logic
- No built-in support for on-premise deployment
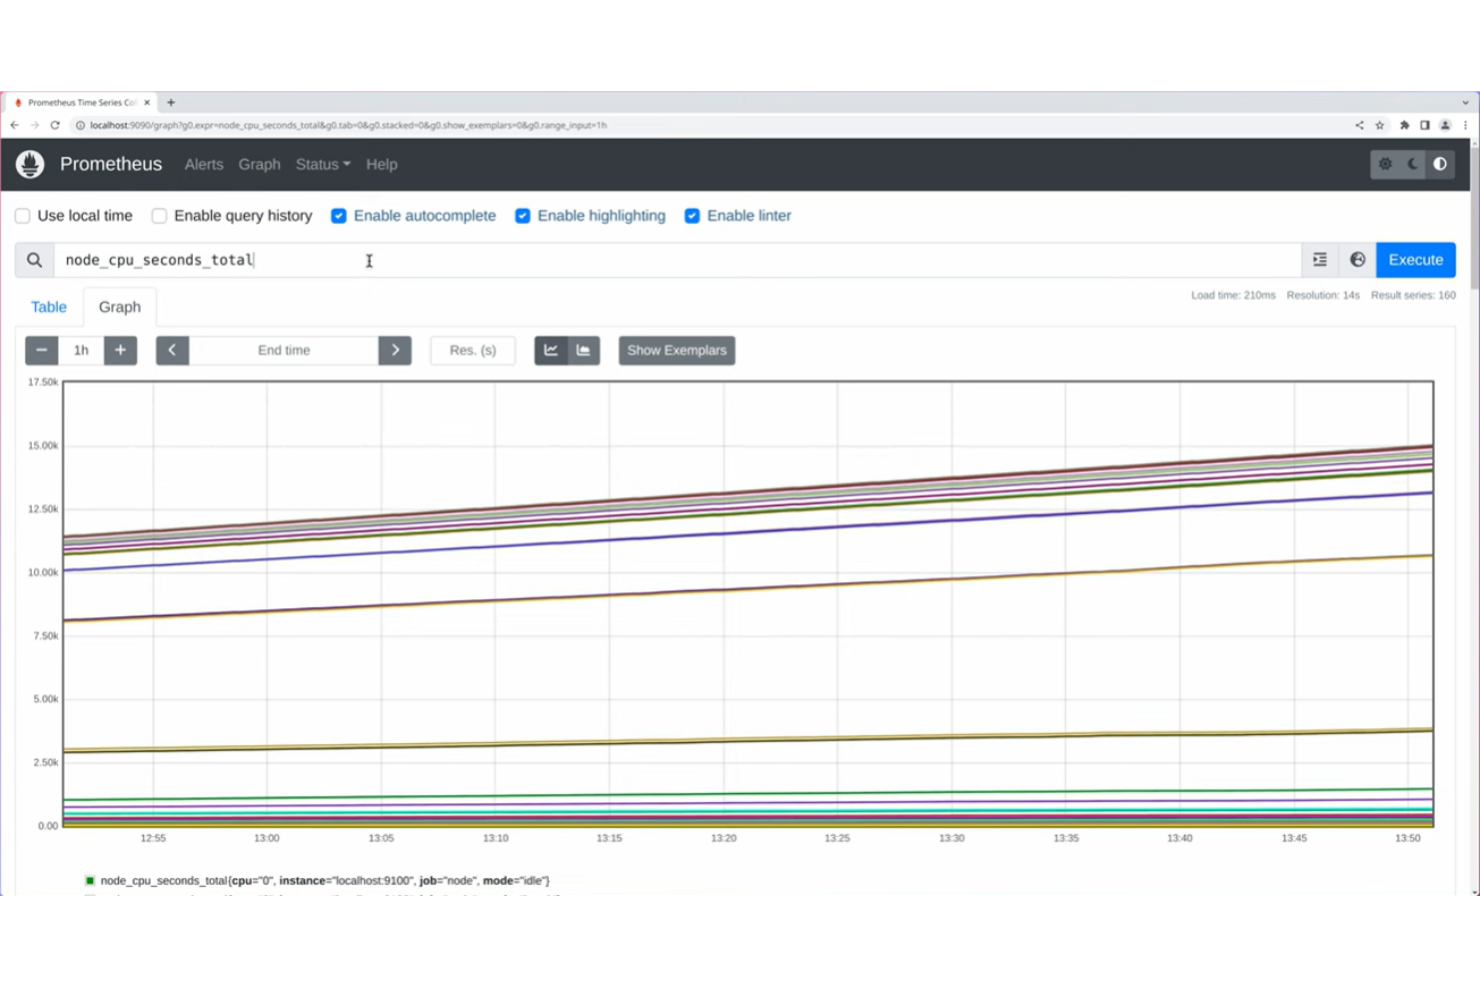
Prometheus is an open-source monitoring and alerting system designed for site reliability engineers who need to collect, store, and query time series metrics from infrastructure and applications.
Who Is Prometheus Best For?
Prometheus is a strong fit for site reliability engineers and DevOps teams at technology-driven organizations managing large-scale, containerized infrastructure.
Why I Picked Prometheus
I picked Prometheus as one of the best because I rely on its open-source toolkit to collect and store time series data from dynamic infrastructure. I like how the flexible query language lets me build custom dashboards and alerts for any metric my team cares about. My team uses Prometheus to monitor Kubernetes clusters and containerized workloads, taking advantage of its pull-based data collection and service discovery.
Prometheus Key Features
- Alertmanager integration: Route alerts to email, PagerDuty, or Slack based on custom rules.
- Multi-dimensional data model: Store metrics with labels for flexible querying and filtering.
- Service discovery: Automatically detect targets in cloud and container environments.
- Data retention configuration: Set custom retention periods for time series data.
Prometheus Integrations
Prometheus offers native integrations with Alertmanager, Grafana, Kubernetes, Consul, and Docker, and provides an API for custom integrations.
Pros and Cons
Pros:
- Strong open-source community and documentation
- Flexible PromQL query language for custom metrics
- Pull-based metrics collection supports dynamic environments
Cons:
- Lacks native distributed tracing support
- No built-in long-term storage for metrics
Google Cloud Monitoring is a cloud-native monitoring platform for site reliability engineering that collects, visualizes, and analyzes metrics, events, and logs from Google Cloud and hybrid environments.
Who Is Google Cloud Monitoring Best For?
Google Cloud Monitoring is a strong fit for SRE teams managing workloads on Google Cloud or hybrid cloud environments.
Why I Picked Google Cloud Monitoring
I picked Google Cloud Monitoring as one of the best because it gives me native monitoring and observability across Google Cloud resources without extra setup. I like how I can visualize metrics, logs, and uptime checks for my cloud and hybrid workloads in one place. My team uses its alerting policies and custom dashboards to track service health and respond quickly to incidents.
Google Cloud Monitoring Key Features
- Multi-cloud monitoring: Collects and displays metrics from AWS and on-prem systems alongside Google Cloud.
- SLO tracking: Lets you define and monitor service level objectives for reliability.
- Uptime monitoring: Continuously checks service availability from multiple global locations.
- Incident timelines: Visualize incidents and related events in a chronological view for faster troubleshooting.
Google Cloud Monitoring Integrations
Google Cloud Monitoring offers native integrations across the Google Cloud ecosystem, including Google Compute Engine, Google Kubernetes Engine, Google App Engine, Google Cloud Functions, and Google Cloud Storage. An API is available for custom integrations.
Pros and Cons
Pros:
- Scalable for large, distributed environments
- Custom SLO and SLA tracking features
- Supports multi-cloud and hybrid monitoring
Cons:
- Pricing can increase quickly with high data volume
- UI navigation can be unintuitive for new users
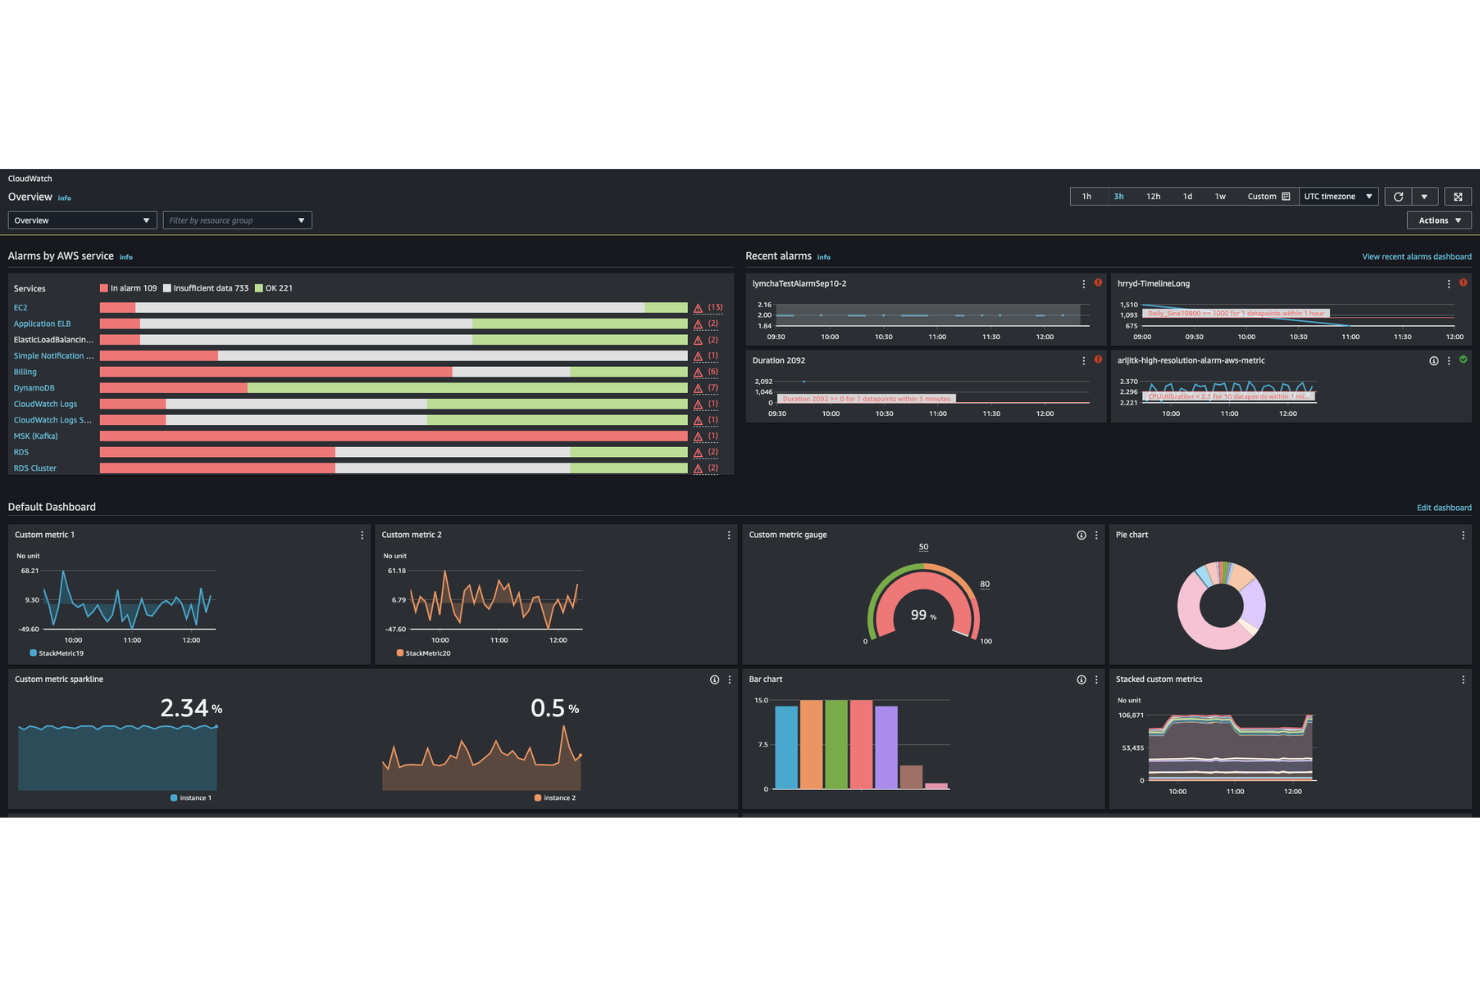
Amazon CloudWatch is a cloud-native monitoring and observability platform from AWS that provides metrics collection, log management, event monitoring, and automated alerting for infrastructure and applications running on AWS.
Who Is Amazon CloudWatch Best For?
Amazon CloudWatch is a strong fit for AWS-focused SRE teams and cloud infrastructure engineers in midsize to large enterprises.
Why I Picked Amazon CloudWatch
I picked Amazon CloudWatch as one of the best because it gives me native AWS monitoring and observability without extra setup. I like how I can collect and visualize metrics, logs, and events from all my AWS resources in one place. My team uses its automated alarms and dashboards to track cloud infrastructure health and application performance in real time.
Amazon CloudWatch Key Features
- Custom metrics: Send and monitor application-specific metrics alongside AWS resource data.
- Log Insights: Run queries and analyze log data interactively for troubleshooting.
- Anomaly detection: Automatically detect unusual metric patterns using machine learning.
- Synthetic monitoring: Simulate user interactions to monitor endpoint availability and latency.
Amazon CloudWatch Integrations
Amazon CloudWatch offers native integrations with over 70 AWS services, including Amazon EC2, Amazon S3, Amazon API Gateway, and Amazon RDS. It also supports integration with Amazon OpenSearch Service and provides an API for custom integrations.
Pros and Cons
Pros:
- Granular permissions with AWS IAM integration
- Supports custom metrics and dashboards
- Deep integration with AWS services and resources
Cons:
- No built-in incident management workflows
- Limited visibility into non-AWS environments
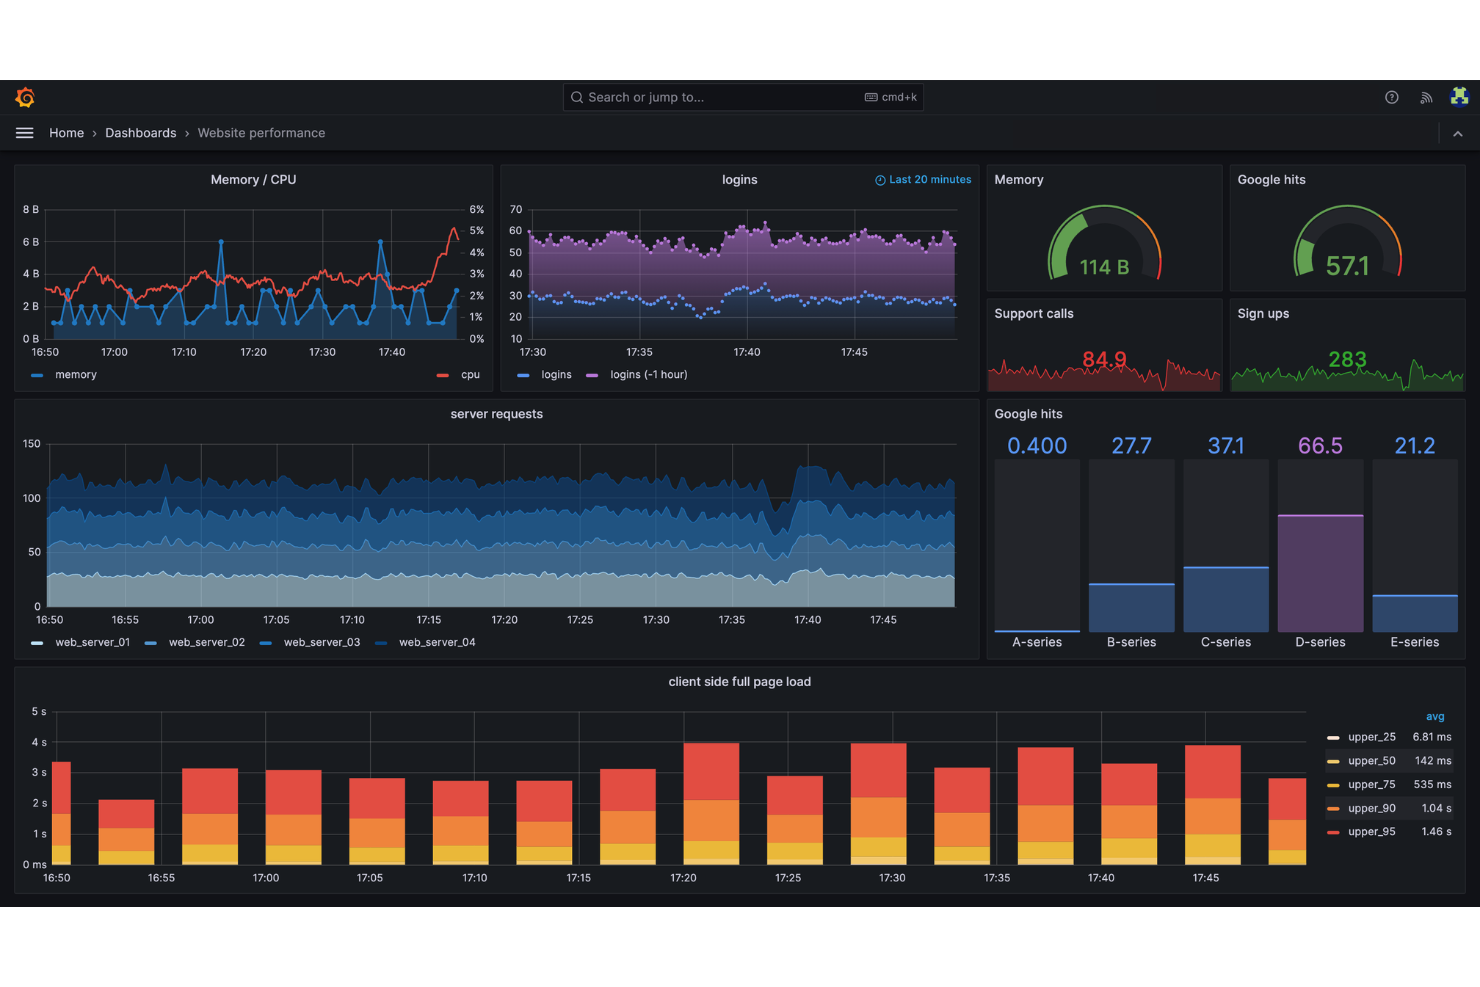
Grafana Labs is an open-source monitoring and analytics platform for site reliability engineers that lets you visualize, query, and correlate time series data from multiple sources in customizable dashboards.
Who Is Grafana Labs Best For?
Grafana Labs is a strong fit for site reliability engineers and DevOps teams at organizations that need to visualize and analyze metrics from diverse data sources.
Why I Picked Grafana Labs
I picked Grafana Labs as one of the best because I rely on its open-source dashboards to visualize time series data from Prometheus, Loki, and other sources in one place. I like how I can build custom panels and alerts for SRE metrics, then share those dashboards with my team. My team uses Grafana Labs to correlate logs, metrics, and traces for faster incident response.
Grafana Labs Key Features
- Role-based access control: Manage user permissions and restrict access to sensitive dashboards.
- Data source plugins: Connect to databases like MySQL, PostgreSQL, InfluxDB, and Elasticsearch.
- Annotation support: Mark events directly on dashboards for context during incident reviews.
- Templated dashboards: Use variables to create reusable, dynamic dashboards for different environments or teams.
Grafana Labs Integrations
Grafana Labs offers native integrations with MongoDB, AppDynamics, Jira, Oracle GitLab, Salesforce, Splunk, and provides an API for custom integrations.
Pros and Cons
Pros:
- Strong open-source plugin ecosystem
- PromQL enables advanced metric querying
- Supports multi-source data aggregation in dashboards
Cons:
- Distributed tracing support is limited
- High-cardinality data can impact performance
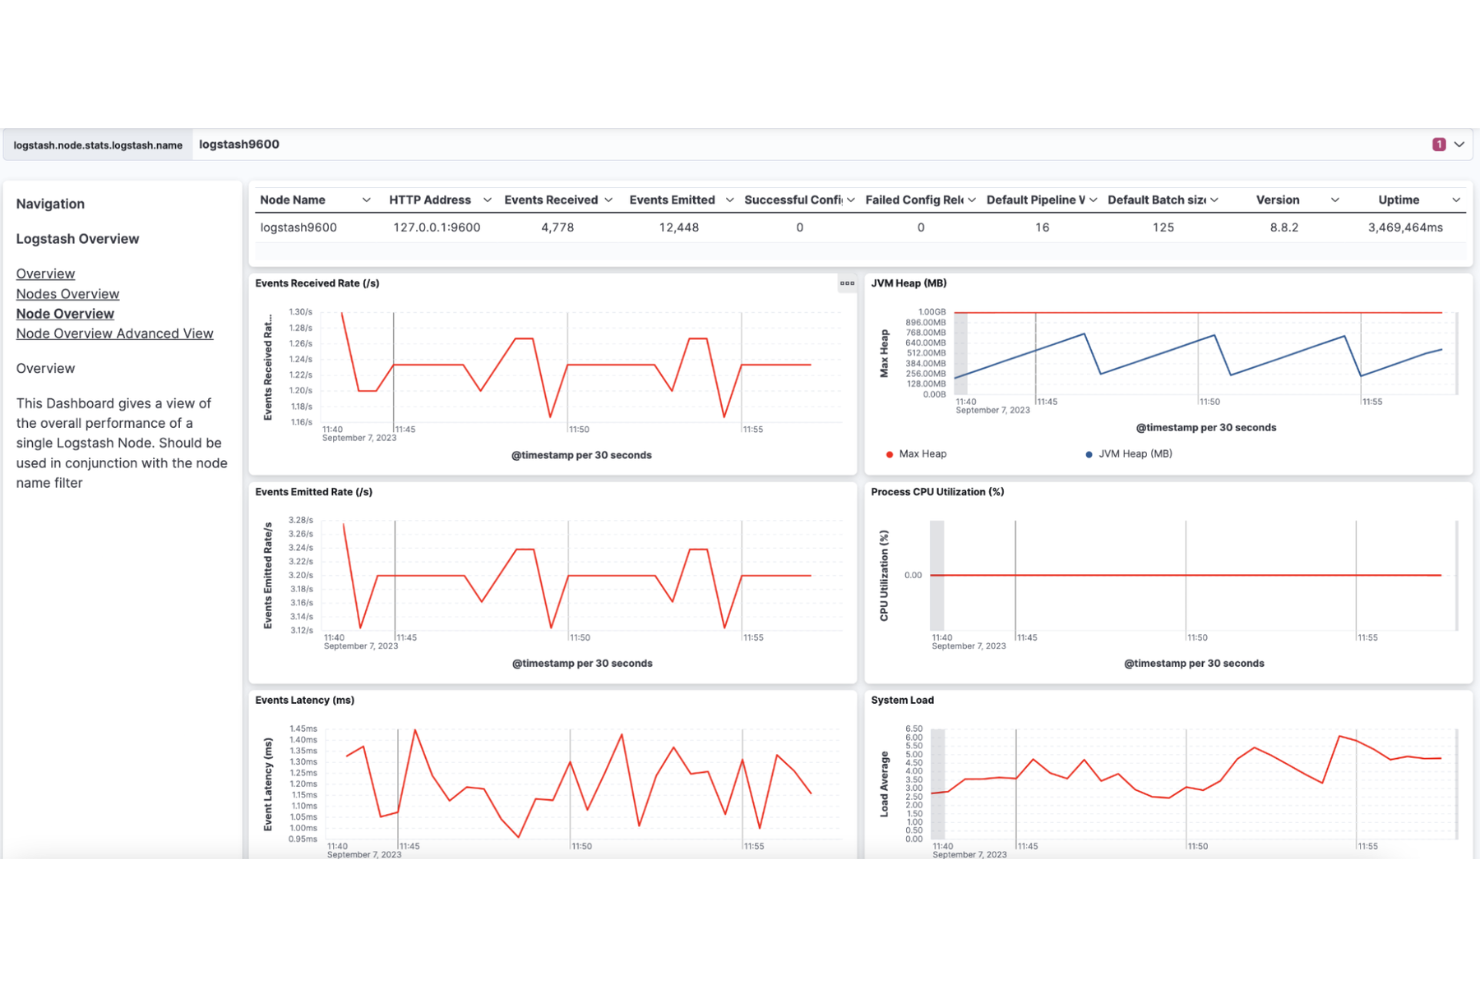
Logstash is a real-time data pipeline tool for SRE monitoring that ingests, transforms, and forwards logs and event data from diverse sources to various outputs.
Who Is Logstash Best For?
Logstash is a strong fit for SREs and IT teams at large enterprises who need to centralize and process high-volume log and event data.
Why I Picked Logstash
I picked Logstash as one of the best because I rely on its real-time data pipeline to ingest, transform, and forward logs from dozens of sources. My team uses its rich plugin ecosystem to parse, enrich, and route data to Elasticsearch and other outputs. I like how we can build complex pipelines for SRE monitoring without writing custom code for every data source.
Logstash Key Features
- Centralized pipeline management: Configure and monitor multiple pipelines from a single interface.
- Extensive codec support: Handle various data formats like JSON, CSV, and syslog.
- Persistent queues: Buffer events on disk to prevent data loss during outages.
- Dead letter queue: Capture and isolate failed events for later review and troubleshooting.
Logstash Integrations
Logstash offers over 200+ native plugins for inputs, filters, and outputs, including native integrations with Elasticsearch, Amazon S3, Kafka, JDBC, and AWS CloudWatch, and provides an API for custom plugin development.
Pros and Cons
Pros:
- Flexible pipeline configuration for custom workflows
- Offers persistent queues for data durability
- Handles complex log parsing and enrichment
Cons:
- Plugin compatibility issues after major updates
- Troubleshooting pipeline errors can be difficult
InfluxDB is a time series database and monitoring platform designed for SRE teams who need to collect, store, and analyze high-volume network and infrastructure metrics.
Who Is InfluxDB Best For?
InfluxDB is a strong fit for SREs and DevOps teams at organizations handling high-throughput network and infrastructure monitoring.
Why I Picked InfluxDB
I picked InfluxDB as one of the best because it’s purpose-built for high-performance time series data, which is essential for network monitoring at scale. I like how I can ingest, store, and query millions of metrics per second without lag. My team uses its Flux query language to analyze network traffic patterns and detect anomalies in real time. InfluxDB’s schema flexibility lets us adapt quickly as our monitoring needs evolve.
InfluxDB Key Features
- Native Telegraf agent support: Collects metrics from hundreds of sources using lightweight plugins.
- Downsampling and data retention policies: Automatically manages storage by aggregating and expiring old data.
- Custom dashboards: Lets you build visualizations for real-time and historical network data.
- Alerting engine: Triggers notifications based on user-defined thresholds and conditions.
InfluxDB Integrations
InfluxDB offers native integrations with Telegraf, Grafana, Kapacitor, Chronograf, and MQTT, and provides an API for custom integrations.
Pros and Cons
Pros:
- Flux query language enables advanced analytics
- Flexible retention and downsampling policies
- Handles high-ingest time series data volumes
Cons:
- No native alerting in open source version
- Lacks built-in machine learning features
Other SRE Monitoring Tools
Here are some additional SRE monitoring tools options that didn’t make it onto my shortlist, but are still worth checking out:
- Sensu
For flexible infrastructure monitoring
- Sentry
For real-time error tracking
- PagerDuty
For incident response and on-call
- MongoDB Atlas
For database monitoring and alerts
- Rootly
For automated incident workflows
- Firebase Crashlytics
For mobile crash reporting
- DebugBear
For website performance monitoring
- Zenduty
For customizable incident escalation
- Nobl9
For SLO and error budget management


SRE Monitoring Tools Selection Criteria
When selecting the best SRE monitoring tools to include in this list, I considered common buyer needs and pain points like reducing incident response times and supporting dynamic, cloud-native environments. I also used the following framework to keep my evaluation structured and fair:
Core Functionality (25% of total score)
To be considered for inclusion in this list, each solution had to fulfill these common use cases:
- Monitor system and application health
- Generate and manage alerts
- Support automated incident response
- Integrate with notification tools
- Provide historical data and reporting
Additional Standout Features (25% of total score)
To help further narrow down the competition, I also looked for unique features, such as:
- Automated remediation workflows
- Custom plugin or script support
- Dynamic entity discovery
- Built-in secrets management
- Role-based access control
Usability (10% of total score)
To get a sense of the usability of each system, I considered the following:
- Clear and intuitive dashboard design
- Logical navigation and menu structure
- Minimal configuration steps for setup
- Accessible documentation within the interface
- Responsive interface with low latency
Onboarding (10% of total score)
To evaluate the onboarding experience for each platform, I considered the following:
- Availability of step-by-step setup guides
- Access to training videos and tutorials
- Interactive product tours or walkthroughs
- Prebuilt templates for common use cases
- Live chat or chatbot support during onboarding
Customer Support (10% of total score)
To assess each software provider’s customer support services, I considered the following:
- 24/7 support availability
- Access to a knowledgeable support team
- Fast response times to inquiries
- Detailed online knowledge base
- Community forums for peer support
Value For Money (10% of total score)
To evaluate the value for money of each platform, I considered the following:
- Transparent and predictable pricing structure
- Flexible plans for different team sizes
- Free trial or freemium option available
- No hidden fees or surprise charges
- Features included at each pricing tier
Customer Reviews (10% of total score)
To get a sense of overall customer satisfaction, I considered the following when reading customer reviews:
- Positive feedback on reliability and uptime
- Reports of responsive customer support
- Comments on ease of integration
- User satisfaction with alerting accuracy
- Feedback on scalability for growing teams
How to Choose SRE Monitoring Tools
It’s easy to get bogged down in long feature lists and complex pricing structures. To help you stay focused as you work through your unique software selection process, here’s a checklist of factors to keep in mind:
| Factor | What to Consider |
| Scalability | Can the tool handle your current and projected infrastructure size? Look for proven support for large, dynamic environments. |
| Integrations | Does it natively connect with your alerting, ticketing, and messaging tools? Check for compatibility with your existing stack. |
| Customizability | Can you tailor checks, alerts, and workflows to your team’s needs? Assess support for custom plugins or scripts. |
| Ease of use | Will your team be able to adopt and operate the tool quickly? Consider the learning curve and clarity of the interface. |
| Implementation and onboarding | How long will it take to deploy and configure? Ask about migration support, documentation, and available onboarding resources. |
| Cost | Are pricing tiers transparent and predictable? Factor in both upfront and ongoing costs, including add-ons or usage-based fees. |
| Security safeguards | Does the tool offer encryption, access controls, and audit logs? Ensure it meets your organization’s security standards. |
| Support availability | Is responsive support available when you need it? Check for 24/7 coverage, SLAs, and access to technical expertise. |
What are SRE Monitoring Tools?
SRE monitoring tools are software platforms that help site reliability engineers track, analyze, and respond to system performance and reliability. These tools provide instrumentation to collect metrics, logs, and traces, supporting end-to-end visibility across applications and infrastructure. They integrate with incident management platforms and workflows like on-call scheduling to alert on-call engineers and manage the full incident lifecycle. Features like runbooks and orchestration help automate response and resolution. SRE tools also connect with APM, configuration management, and infrastructure as code (IaC), supporting provisioning and debugging processes.
Features of SRE Monitoring Tools
When selecting SRE monitoring tools, keep an eye out for the following key features:
- Real-time metrics collection: Continuously gathers data on system and application performance, providing up-to-date insights for proactive monitoring and troubleshooting.
- Custom alerting: Lets you define specific thresholds and conditions that trigger notifications, so your team can respond quickly to incidents and anomalies.
- Automated incident response: Supports workflows that automatically execute remediation steps or escalate issues based on predefined rules, reducing manual intervention.
- Role-based access control: Allows you to manage user permissions and restrict access to sensitive monitoring data and configuration settings.
- Integration support: Connects natively with popular tools for alerting, ticketing, messaging, and infrastructure management, streamlining your workflows.
- Historical data retention: Stores monitoring data over time, enabling trend analysis, capacity planning, and post-incident reviews.
- Dynamic entity discovery: Automatically detects and registers new infrastructure components as your environment scales or changes.
- Secrets management: Securely stores and manages credentials or sensitive information needed for checks, integrations, or automation tasks.
- Maintenance mode: Lets you temporarily suppress alerts during planned maintenance or known outages, preventing unnecessary noise.
- Custom plugin support: Enables you to extend monitoring capabilities with scripts or plugins tailored to your unique systems and requirements.
Common SRE Monitoring Tools AI Features
Beyond the standard SRE monitoring tools features listed above, many of these solutions are incorporating AI with features like:
- Anomaly detection: Uses AI algorithms to automatically identify unusual patterns or deviations in system metrics, helping teams catch incidents before they escalate.
- Predictive alerting: Leverages machine learning to forecast potential outages or performance issues based on historical data and trends, allowing for proactive intervention.
- Automated root cause analysis: Applies AI to correlate events and logs, pinpointing the likely source of incidents and reducing time spent on manual investigation.
- Intelligent noise reduction: Filters and groups related alerts using AI, minimizing alert fatigue by surfacing only the most relevant and actionable notifications.
- Incident prioritization: Uses AI to assess the potential impact of incidents and automatically rank them, helping teams focus on the most critical issues first.
Benefits of SRE Monitoring Tools
Implementing SRE monitoring tools provides several benefits for your team and your business. Here are a few you can look forward to:
- Faster incident response: Automated alerting and incident workflows help your team detect and resolve issues quickly, minimizing downtime.
- Improved system reliability: Continuous monitoring and proactive remediation features support higher uptime and more stable services.
- Better resource planning: Historical data retention and trend analysis enable smarter capacity planning and infrastructure optimization.
- Reduced alert fatigue: Intelligent alerting and noise reduction features ensure your team only receives actionable notifications.
- Improved security and compliance: Role-based access control and secrets management protect sensitive data and support regulatory requirements.
- Simplified collaboration: Integration with messaging and ticketing tools keeps everyone aligned during incidents and postmortems.
- Scalability for dynamic environments: Dynamic entity discovery and flexible integrations make it easier to monitor growing or changing infrastructure.
Costs and Pricing of SRE Monitoring Tools
Selecting SRE monitoring tools requires an understanding of the various pricing models and plans available. Costs vary based on features, team size, add-ons, and more. The table below summarizes common plans, their average prices, and typical features included in SRE monitoring tools solutions:
Plan Comparison Table for SRE Monitoring Tools
| Plan Type | Average Price | Common Features |
| Free Plan | $0 | Basic monitoring, limited alerting, community support, and access for a small team. |
| Personal Plan | $5-$25/user/month | Expanded metrics, custom alerting, integrations with messaging tools, and basic reporting. |
| Business Plan | $25-$75/user/month | Advanced incident response, role-based access control, historical data retention, and improved support. |
| Enterprise Plan | $75-$150/user/month | Custom plugin support, dynamic entity discovery, advanced security features, dedicated onboarding, and SLAs. |
SRE Monitoring Tools FAQs
Here are some answers to common questions about SRE monitoring tools:
How do SRE monitoring tools differ from traditional monitoring solutions?
SRE monitoring tools focus on reliability engineering practices, offering features like automated incident response, error budgeting, and dynamic infrastructure discovery. Traditional monitoring tools may only track metrics and send alerts, while SRE tools help teams manage reliability targets and simplify incident workflows.
Can SRE monitoring tools integrate with existing DevOps toolchains?
Yes, most SRE monitoring tools offer integrations with popular DevOps platforms, ticketing systems, messaging apps, and CI/CD pipelines. This lets your team connect monitoring data with incident management, collaboration, and automation tools you already use.
What should I consider when scaling SRE monitoring tools for a growing environment?
Look for solutions that support dynamic entity discovery, flexible integrations, and scalable data retention. Make sure the tool can handle increased data volume, more users, and complex infrastructure without performance issues or excessive cost increases.
Are there security risks with implementing SRE monitoring tools?
Yes, as with any monitoring solution, there are security considerations. Choose tools with strong access controls, encrypted data storage, and audit logging. Review how the tool handles sensitive credentials and ensure it aligns with your organization’s security policies.
How long does it take to implement an SRE monitoring tool?
Implementation time varies by tool and environment complexity. Many solutions offer quick-start guides, templates, and onboarding support, so small teams can get started in hours or days. Larger or more complex environments may require more planning and phased rollout.