Prometheus vs. New Relic: Comparison and Expert Reviews for 2026


If you’re struggling to keep your systems healthy and your users happy, choosing the right observability platform can make all the difference. Prometheus and New Relic both promise deep visibility, but they take very different approaches to monitoring, alerting, and scaling. You want a solution that fits your stack, your team’s skills, and your budget—without adding more headaches.
In this article, you’ll get a clear comparison of Prometheus and New Relic, including their pros and cons, best-fit use cases, pricing, security, and usability. By the end, you’ll know which monitoring solution is the better match for your needs and where each one shines—or falls short.
Prometheus vs. New Relic: An Overview
Prometheus

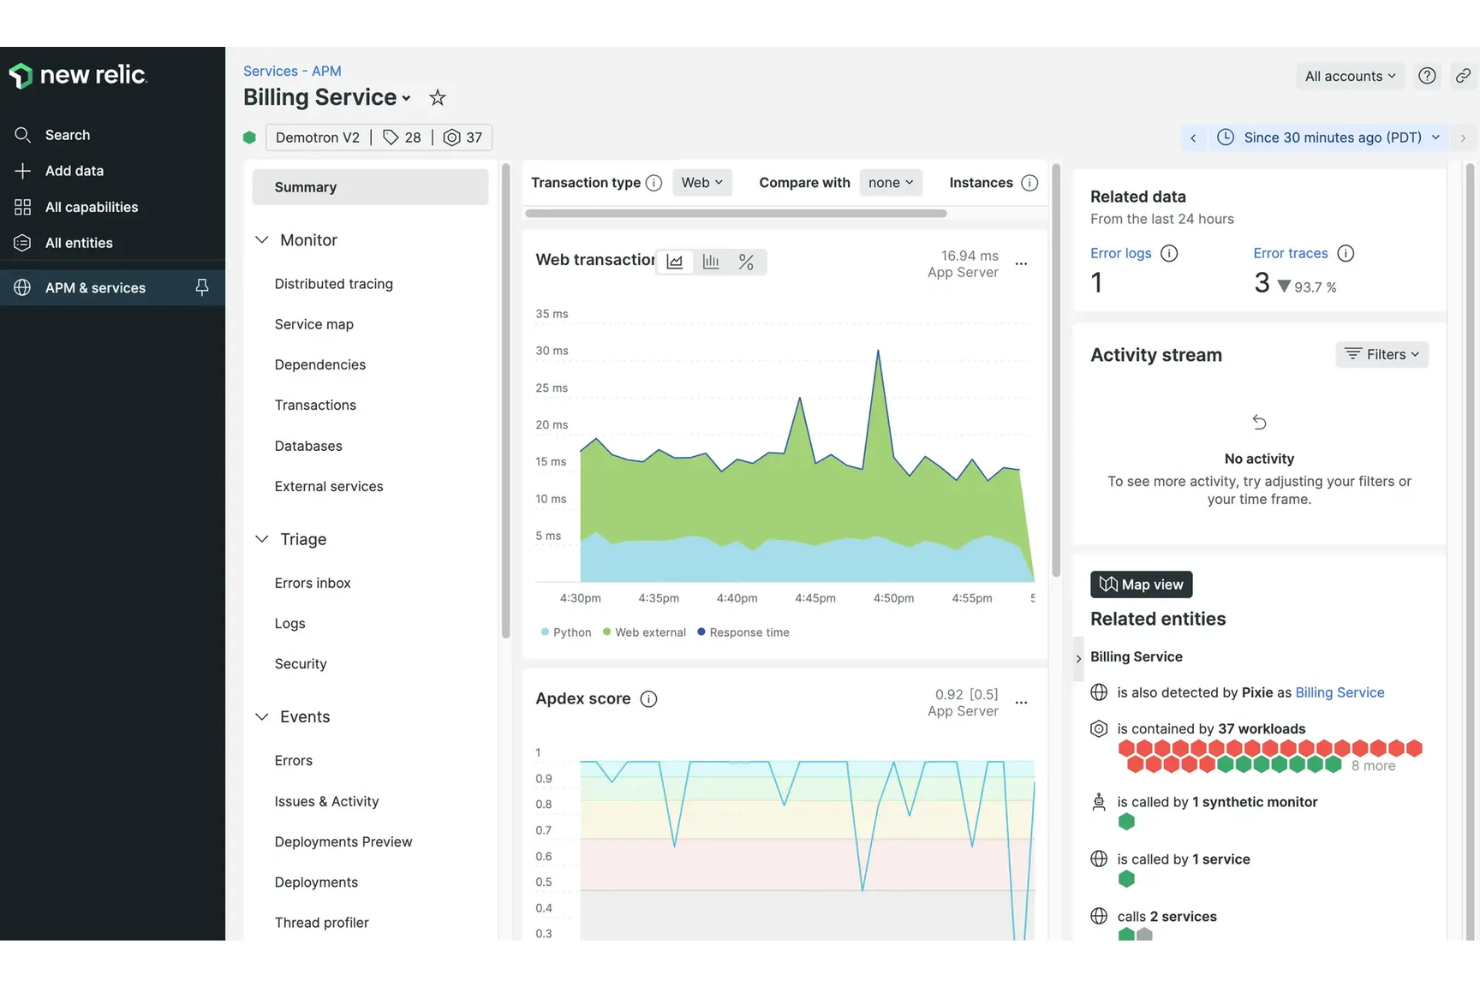
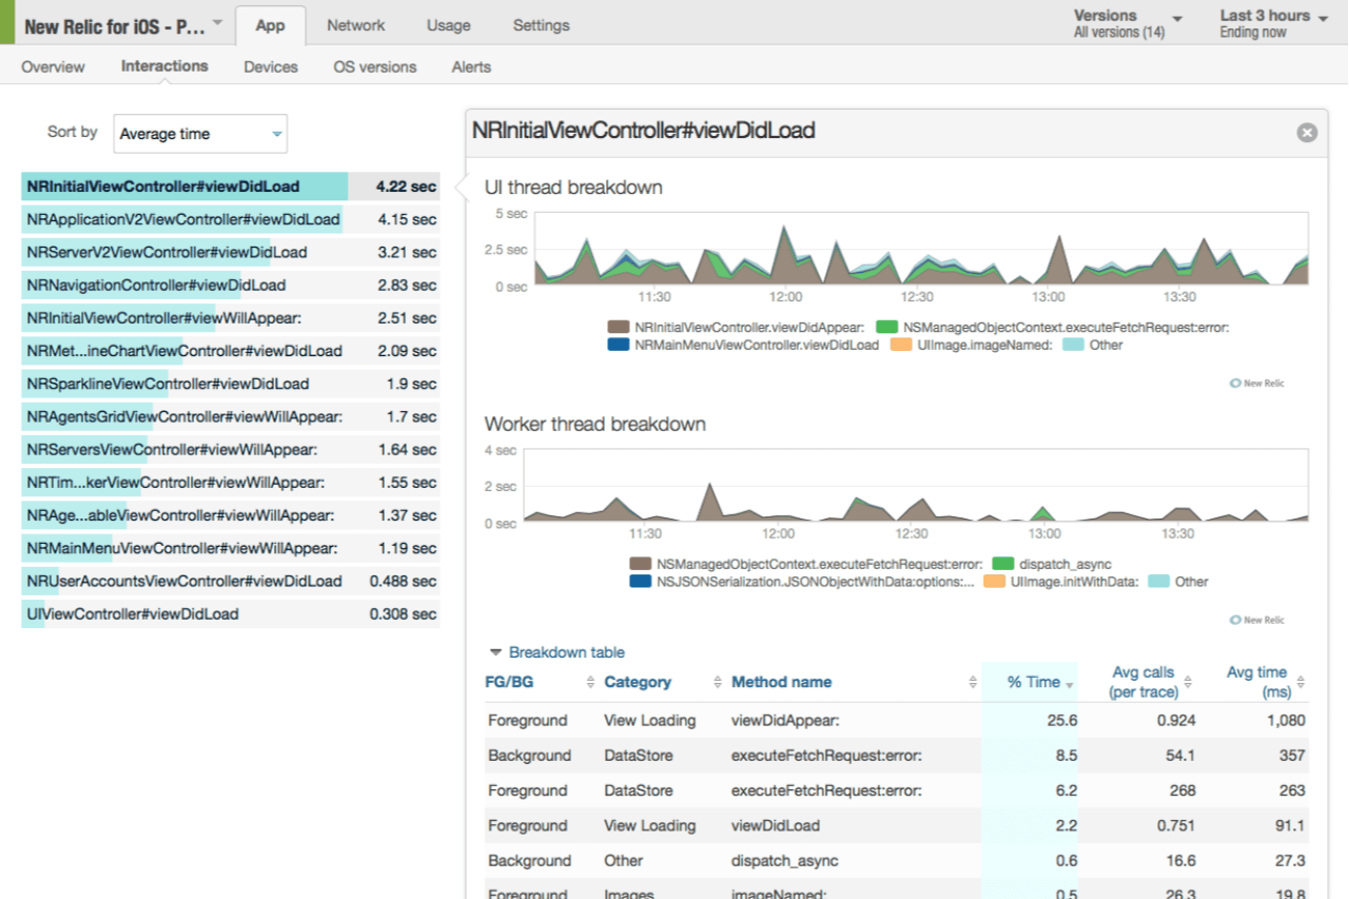
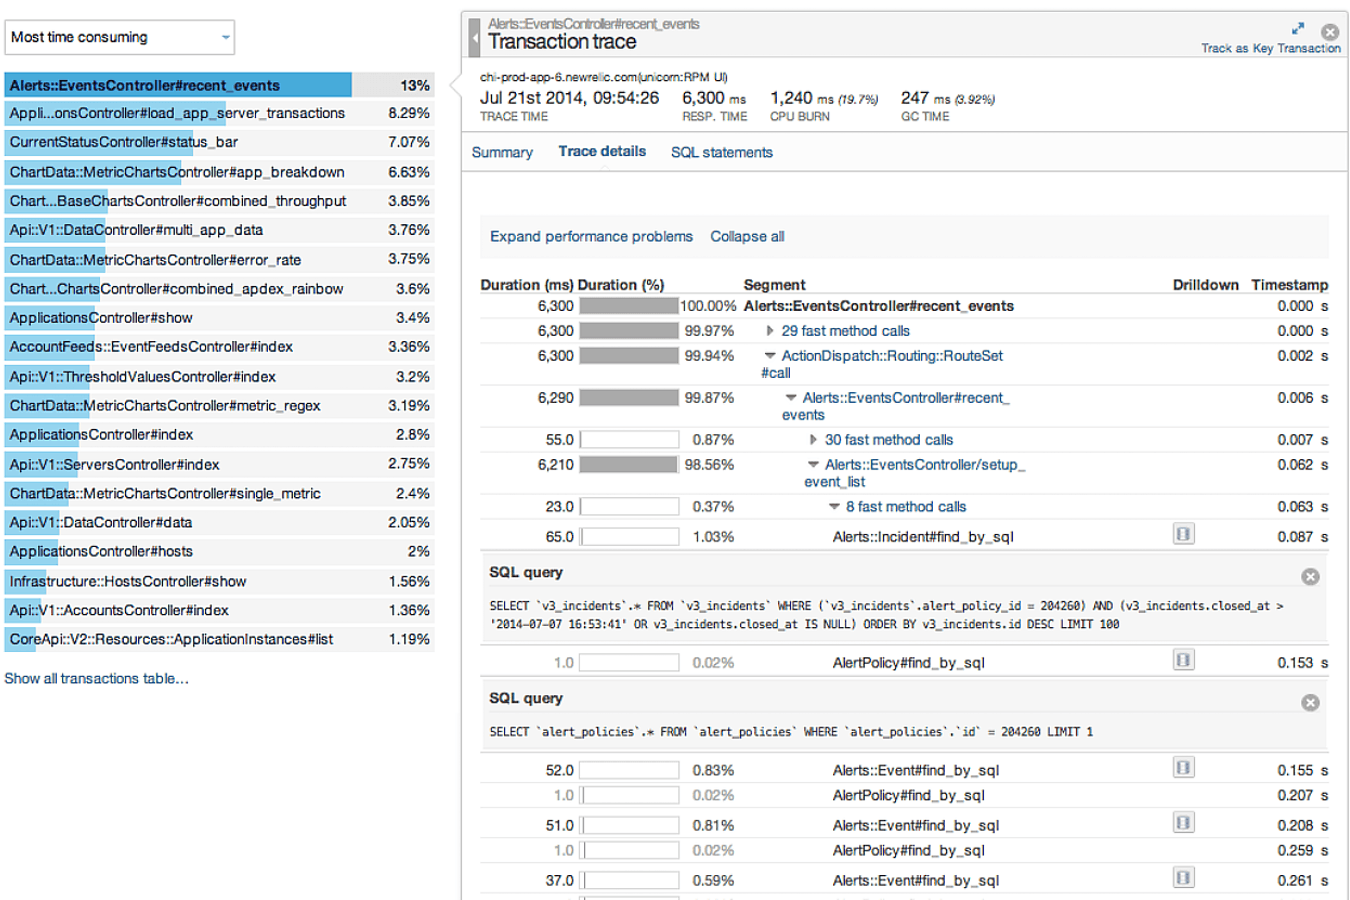
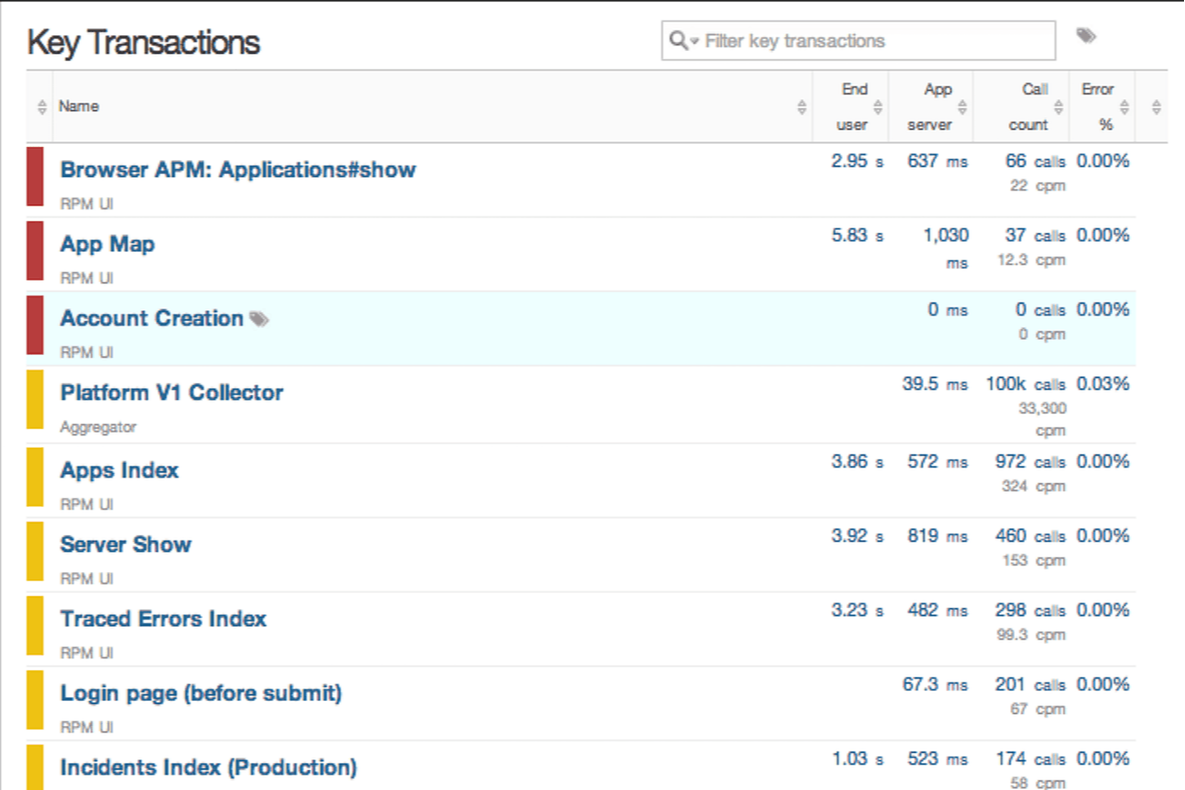
New Relic
Why Trust Our Software Reviews
We’ve been testing and reviewing software since 2023. As tech leaders ourselves, we know how critical and difficult it is to make the right decision when selecting software.
We invest in deep research to help our audience make better software purchasing decisions. We’ve tested more than 2,000 tools for different tech use cases and written over 1,000 comprehensive software reviews. Learn how we stay transparent & our software review methodology.
Prometheus vs. New Relic Pricing Comparison
| Prometheus | New Relic | |
|---|---|---|
| Free Trial | Free to use | Free plan available |
| Pricing | No licensing cost | From $49/user/month |
Prometheus vs. New Relic Pricing & Hidden Costs
Prometheus is open source and free to use, but you’ll need to factor in the costs of hosting, scaling, and maintaining your own infrastructure. This includes hardware, storage, and the time your team spends on setup and ongoing management. New Relic uses a subscription-based pricing model, with a free tier and 100 GB/month of data ingest included. Paid plans scale based on data ingest, user seats, and compute costs.
To choose the right pricing model, look beyond the sticker price and consider your team’s expertise, the complexity of your environment, and your long-term growth. Estimate the total cost of ownership—including support, scaling, and any add-ons you’ll need. Ask vendors for clear breakdowns of what’s included and what might trigger extra charges, so you can avoid surprises as your monitoring needs evolve.
Prometheus vs. New Relic Feature Comparison
Both Prometheus and New Relic offer essential observability functionalities like metrics collection, alerting, and dashboarding. You can monitor system health, set up custom alerts, and visualize performance data in real time with either platform. Both tools also support integrations with popular cloud services and third-party tools.
Prometheus stands out with its flexible query language and strong support for custom, cloud-native monitoring at scale. New Relic, on the other hand, offers advanced application performance monitoring (APM), distributed tracing, and AI-powered insights that help you quickly pinpoint issues across complex environments. Each platform brings unique strengths to the table, depending on your monitoring priorities.
| Prometheus | New Relic | |
|---|---|---|
| AI Integration | ||
| API | ||
| Automated Testing | ||
| Browser Compatibility Testing | ||
| Bug Tracking | ||
| Code Review | ||
| Custom Reports | ||
| Data Export | ||
| Data Import | ||
| Developer Tools | ||
| External Integrations | ||
| Malware Protection | ||
| Multi-User | ||
| Notifications | ||
| Performance Testing | ||
| Process Reporting | ||
| Static Analysis | ||
| Status Notifications | ||
| Workflow Management |
Prometheus vs. New Relic Integrations
| Integration | Prometheus | New Relic |
| Kubernetes | ✅ | ✅ |
| Grafana | ✅ | ✅ |
| AWS CloudWatch | ✅ | ✅ |
| Azure Monitor | ✅ | ✅ |
| Google Cloud Platform | ✅ | ✅ |
| Slack | ✅ | ✅ |
| Jenkins | ✅ | ✅ |
| Salesforce | ❌ | ✅ |
| ServiceNow | ❌ | ✅ |
| Datadog | ❌ | ✅ |
| API | ✅ | ✅ |
| Zapier | ❌ | ✅ |
Prometheus and New Relic both support popular cloud and DevOps ecosystems, but they approach integrations very differently. Prometheus relies heavily on exporters, open-source tooling, and its Alertmanager for connecting to external systems, which makes it highly flexible but more engineering-intensive.
New Relic, on the other hand, offers a broader range of native, out-of-the-box integrations—especially for business and IT service platforms like Salesforce and ServiceNow. If you need turnkey integrations and minimal setup, New Relic is the stronger choice, while Prometheus is better suited for teams that prefer customizable, open-source-driven integrations via APIs and exporters.
Prometheus vs. New Relic Security, Compliance & Reliability
| Factor | Prometheus | New Relic |
| Data Encryption | Relies on your configuration for encryption in transit and at rest. | Provides built-in encryption for data in transit and at rest by default. |
| Regulatory Compliance | No built-in compliance certifications; compliance depends on your setup. | Holds certifications like SOC 2, ISO 27001, and GDPR compliance for managed services. |
| Access Controls | Uses role-based access via external tools like OAuth or LDAP. | Offers granular, built-in role-based access controls and SSO integration. |
| High Availability | Requires manual setup for redundancy and failover. | Delivers managed high availability and automatic failover in its cloud platform. |
| Audit Logging | Needs external solutions or custom setup for audit trails. | Includes built-in audit logging and monitoring for user actions and system changes. |
New Relic clearly leads in security and compliance, offering built-in protections and certifications that Prometheus leaves up to your own implementation. Prometheus is flexible but demands more effort and expertise to secure, while New Relic’s managed platform gives you peace of mind with strong defaults and compliance support.
Prometheus vs. New Relic Ease of Use
| Factor | Prometheus | New Relic |
| User Interface | Minimalist and technical, requiring comfort with configuration files and code. | Modern, intuitive dashboards with guided workflows and visualizations for all skill levels. |
| Setup Process | Manual installation and configuration, often needing deep infrastructure knowledge. | Fast, automated onboarding with step-by-step setup and agent-based deployment. |
| Documentation | Extensive but technical, best suited for experienced engineers. | Comprehensive, user-friendly guides and in-app tips for quick learning. |
| Support Resources | Community-driven support with forums and open-source channels. | 24/7 professional support, live chat, and a large knowledge base. |
| Customization | Highly customizable through code and integrations, but requires expertise. | Easy customization through UI, prebuilt integrations, and low-code options. |
New Relic is much more approachable for teams of all experience levels, while Prometheus appeals to those who want full control and don’t mind a steeper learning curve. Prometheus shines for power users who love to tinker, but New Relic’s polished experience and strong support make it easier for most teams to get value quickly.
Prometheus vs New Relic: Pros & Cons
Prometheus
- Prometheus's real-time alerting helps your team react swiftly to system changes.
- It offers extensive customization for monitoring metrics that matter to your work.
- The open-source nature allows you to tailor it exactly to your IT environment.
- Prometheus's steep learning curve might challenge your newer team members.
- Its lack of native long-term storage can complicate historical data analysis.
- The complex setup may require more initial time investment from your team.
New Relic
- Flexible usage-based pricing with a generous free tier.
- AI-powered features for automated root cause analysis.
- Unified platform for logs, metrics, and traces.
- Alert noise can require significant tuning for accuracy.
- Dashboards can feel cluttered with large environments.
- Costs can spike with high data ingestion.
Best Use Cases for Prometheus and New Relic
Prometheus
- Cloud Services Prometheus is perfect for monitoring dynamic cloud environments due to its real-time data processing and alerting capabilities.
- Large Enterprises Its scalability ensures your team can monitor extensive networks and infrastructure without performance issues.
- Tech Startups You can leverage its open-source nature for cost-effective, customizable solutions in fast-paced development environments.
- IT Departments Prometheus provides your team with the tools needed for detailed system monitoring and prompt issue detection.
- DevOps Teams Its customizable metrics and alerting systems are tailored for your continuous integration and deployment processes.
- Data Centers Prometheus excels in environments requiring precise monitoring and quick response to hardware or network changes.
New Relic
- Cloud-Native Startups Microservices and Kubernetes monitoring align with modern, cloud-first stacks.
- Large Enterprises Scalable data ingestion and multi-account management fit complex organizations.
- Financial Services Granular security and compliance features support regulated environments.
- DevOps Teams Integrated logs, metrics, and traces streamline troubleshooting and deployment monitoring.
- E-Commerce Companies Transaction tracing and synthetic monitoring support high-volume, customer-facing platforms.
- SaaS Providers New Relic’s real-time monitoring and alerting help SaaS teams maintain uptime and user experience.
Who Should Use Prometheus, And Who Should Use New Relic?
Prometheus is best suited for engineering-driven teams that want full control over their monitoring stack, especially in cloud-native and Kubernetes environments. It’s ideal for organizations with the technical resources to manage exporters, customize queries, and build their own observability workflows using open-source tools. If you prioritize flexibility, cost efficiency, and deep infrastructure visibility, you will get the most value from Prometheus.
New Relic is a better fit for teams that want an all-in-one, fully managed observability platform with minimal setup. It works well if you need quick deployment, polished dashboards, and built-in integrations across both technical and business systems. If your organization values ease of use, scalability, and unified monitoring across applications, infrastructure, and services, you’ll benefit most from New Relic.
Differences Between Prometheus and New Relic
| Prometheus | New Relic | |
|---|---|---|
| Automation | Requires manual configuration for scaling, alerting, and integrations. | Built-in automation for instrumentation, scaling, alerting, and anomaly detection. |
| Data Collection | Primarily metrics-based using a pull model and exporters. | Collects metrics, logs, traces, and events via agents and integrations. |
| Deployment Model | Self-hosted, open source, and managed by your team (with optional managed offerings like Cortex/Thanos). | Fully managed, cloud-based SaaS with no infrastructure to maintain. |
| Pricing Structure | Free software, but you pay for infrastructure, storage, and operational overhead. | Subscription-based (with a free tier), pricing tied to data ingest, users, and features. |
| Scalability | Requires additional tools (e.g., Thanos, Cortex) for large-scale or long-term storage. | Natively scalable as a SaaS platform with no user-managed infrastructure. |
| Read Prometheus ReviewOpens new window | Read New Relic ReviewOpens new window |
Similarities Between Prometheus and New Relic
| API Access | Both offer APIs for querying data, automating workflows, and integrating with external systems. |
|---|---|
| Cloud Monitoring | Both can monitor environments running on AWS, Azure, and Google Cloud, including cloud-native services. |
| Custom Alerts | Both support configurable alerts based on thresholds, conditions, or anomalies to enable proactive incident response. |
| Customizable Dashboards | Both provide customizable dashboards to visualize system performance and health. |
| Metrics Monitoring | Both collect, store, and visualize time-series metrics for infrastructure and applications. |
| Read Prometheus ReviewOpens new window Read New Relic ReviewOpens new window | |