10 Best Database Monitoring Tools Reviewed for 2026

Best Database Monitoring Tools Shortlist


With so many different database monitoring tools available, figuring out which is right for you is tough. You know you want to improve your database management process, but need to figure out which tool is best to help you out. I've got you! In this post I'll help make your choice easy, sharing my personal experiences using dozens of different database monitoring tools with large teams and projects, with my picks of the best database monitoring tools.
Why Trust Our Software Reviews
We’ve been testing and reviewing software since 2023. As tech leaders ourselves, we know how critical and difficult it is to make the right decision when selecting software.
We invest in deep research to help our audience make better software purchasing decisions. We’ve tested more than 2,000 tools for different tech use cases and written over 1,000 comprehensive software reviews. Learn how we stay transparent & our software review methodology.
Best Database Monitoring Tools Summary
| Tool | Best For | Trial Info | Price | ||
|---|---|---|---|---|---|
| 1 | Best scalable IT monitoring platform | Free plan + 30-day free trial available | From $275/month (billed annually) | Website | |
| 2 | Best for database performance optimization of business-critical applications | 30-day free trial + free demo + free plan availabl | From $199/year | Website | |
| 3 | Best for full-stack observability and application performance monitoring | Free trial available | From $7/host/month | Website | |
| 4 | Best open-source solution | Free plan available | Pricing upon request | Website | |
| 5 | Best for secure database monitoring | Free plan available | From $15/host/month (billed annually) | Website | |
| 6 | Best for comprehensive database insights | 30-day free trial + free demo available | From $10/month (billed annually) | Website | |
| 7 | Best for SQL charting features | 21-day free trial | From $199/user/year (billed annually) | Website | |
| 8 | Best for centralized SQL monitoring | 14-day free trial available | Pricing upon request | Website | |
| 9 | Best for real-time system health monitoring | 14-day free trial + free plan + free demo available | From $4.50/node/month (billed annually) | Website | |
| 10 | Best for marketing databases | Free demo available | Pricing upon request | Website |
-

Reftab
Visit WebsiteThis is an aggregated rating for this tool including ratings from Crozdesk users and ratings from other sites.4.7 -
Freshservice
Visit WebsiteThis is an aggregated rating for this tool including ratings from Crozdesk users and ratings from other sites.4.6 -
Deel IT
Visit WebsiteThis is an aggregated rating for this tool including ratings from Crozdesk users and ratings from other sites.4.9


Best Database Monitoring Tools Reviews
Below is my list of the best database monitoring tools, along with my analysis of their top features and functionalities that make them stand out in the crowded market of IT monitoring tools.
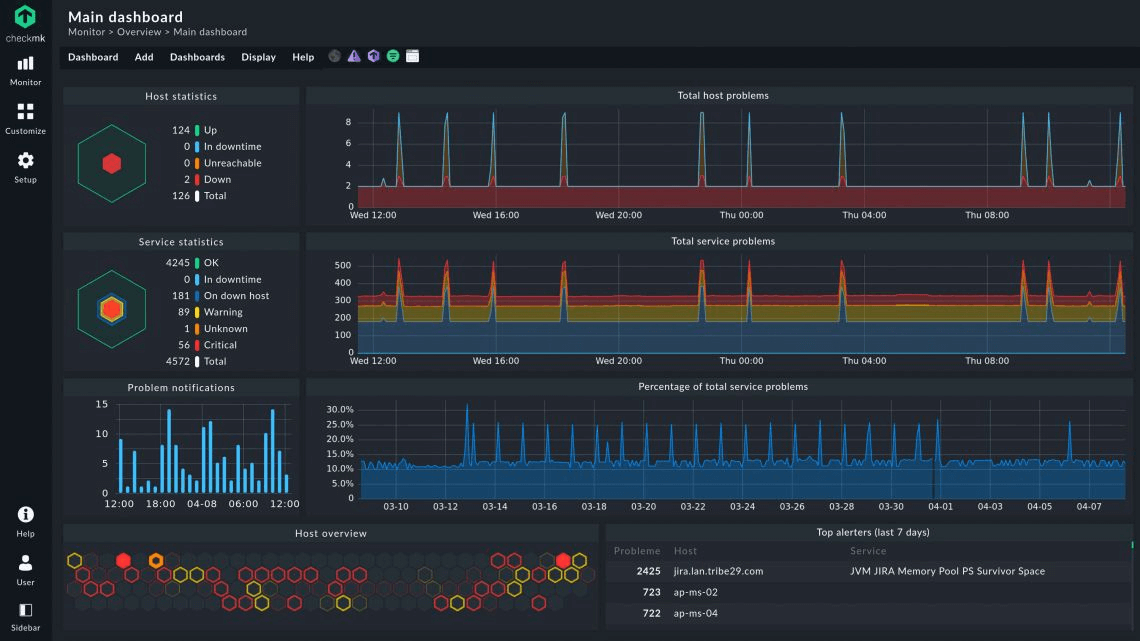
Checkmk is an IT infrastructure monitoring solution that gives you the freedom to customize everything while monitoring. You can track network devices, cloud services, databases, operating systems, server hardware, and web applications.
Why I picked Checkmk: I picked Checkmk because of its flexibility and scalability. It comes with more than 2,000 plugins to help you monitor various aspects of your entire IT infrastructure. You can start with its free forever open-source edition and move to Enterprise or Cloud edition when you want to automate and scale your IT monitoring.
Checkmk Standout Features and Integrations
I think the main standout feature of Checkmk is its rule-based 1-to-N configuration. This results in a low configuration and setup effort in complex IT environments as well and makes it highly scalable.
Checkmk offers a range of pre-built integrations with technologies like Amazon Web Services (AWS), Microsoft Azure, VMware, and Docker. It also offers native integrations with monitoring protocols, including SNMP, WMI, and JMX, to monitor infrastructure components.
Pros and Cons
Pros:
- Free out-of-the-box plugins in the open-source edition itself
- Flexible licensing options
- Ability to customize nearly everything and monitor custom applications
Cons:
- Difficult UI navigation
- Steep learning curve
Best for database performance optimization of business-critical applications

ManageEngine Applications Manager is an application monitoring software. It excels in providing visibility into the performance and user experience of business-critical applications and infrastructure components. IT administrators and operators use ManageEngine to optimize their applications across physical, virtual, cloud, and container platforms.
Why I picked ManageEngine Applications Manager: I chose ManageEngine due to its out-of-the-box monitoring, alerting, and reporting for more than 150 applications and infrastructure elements. It employs agentless real-time database monitoring with automated discovery of database instances.
ManageEngine Applications Manager Standout Features and Integrations
Some of the standout features of ManageEngine Applications Manager include trend analysis, proactive anomaly detection using dynamic baselines, and multi-vendor database support. I think that its agentless monitoring using methods like native OS and API calls further makes it suitable for scaling business applications.
ManageEngine Applications Manager provides native integrations with databases like Oracle, MySQL, PostgreSQL, MongoDB, AWS Aurora, and Azure SQL. It also offers out-of-the-box integration with Slack, ServiceNow, and Site24x7.
Pros and Cons
Pros:
- Allows alert configuration at different levels
- In-built reporting tools
- Covers monitoring of microservices like Docker, Kubernetes
Cons:
- Outdated, clunky user interface
- Initial setup and configuration can be complex
New Product Updates from ManageEngine Applications Manager
Oracle Cloud Application Monitoring Now Available in ManageEngine Applications Manager
ManageEngine Applications Manager introduces Oracle Cloud Application Monitoring, Oracle Cloud Function Monitoring, and Oracle Cloud NAT Gateway Monitoring. These new capabilities help teams monitor Oracle Cloud applications, serverless workloads, and network resources from a single platform. For more information, visit ManageEngine Applications Manager's official site.
 .
.Best for full-stack observability and application performance monitoring
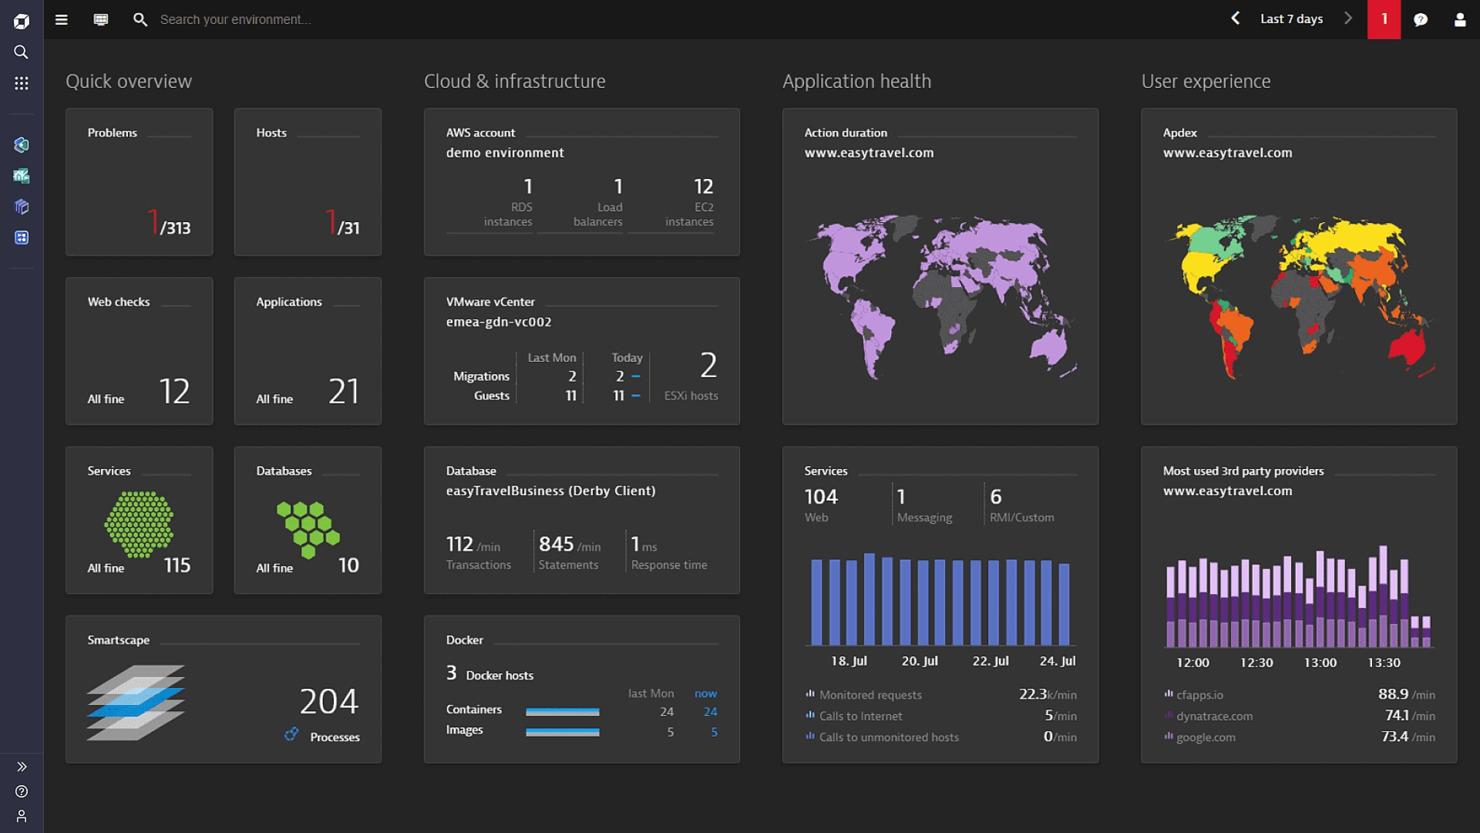
Dynatrace is an advanced observability and application performance monitoring (APM) tool. It gives you comprehensive insights into the performance and user experience of applications, infrastructure, and cloud environments.
Why I picked Dynatrace: I picked Dynatrace because of its AI-powered full-stack observability that prioritizes customer experience. It has a powerful real-user monitoring system that helps you track the user experience in real time and resolve complaints from a centralized system. I think its artificial intelligence capability and integrations with workflow and communication tools like Jira and Slack make it suitable for large teams and enterprise environments.
Dynatrace Standout Features and Integrations
The standout feature of Dynatrace, in my opinion, is its patented AI assistant called Davis AI for root cause analytics. It powers its entire suite to find performance issues faster and optimize the experience of end users.
Integrations include 600+ pre-built integrations with ServiceNow, Adobe Analytics, Apple Safari, Google Chrome, Amazon CloudWatch, Jira, and Slack. Dynatrace also offers native integrations with major cloud platforms like AWS, Microsoft Azure, and Google Cloud.
Pros and Cons
Pros:
- Faster root cause analysis driven by AI
- Real user monitoring for application performance
- Easy configuration
Cons:
- Can be expensive
- Agent-based monitoring can lead to system performance issues

Icinga is an open-source monitoring solution designed to support complex IT environments. It provides a comprehensive stack for monitoring infrastructure, cloud, databases, and applications, ensuring that your systems are running smoothly.
Why I picked Icinga: I like Icinga because it lets you inspect connectivity and health across many database types—like MySQL, MariaDB, PostgreSQL—by tracking metrics such as thread counts, buffer pool usage, replication lag, and slow queries. These checks give your team actionable insight so you can address bottlenecks or performance drops early. You can also define custom queries tailored to your environment. For example, you can pull internal database stats or confirm backup availability, and if you want, export all metrics into your own time-series store.
Icinga Standout Features and Integrations
Other features include monitoring automation, which helps reduce manual intervention by automating routine monitoring tasks. The platform also provides metrics and logs integration, allowing you to capture and analyze data from various sources for better insights.
Integrations include Grafana, AWS, Azure, Puppet, Ansible, Chef, Terraform, Jira, PagerDuty, ServiceNow, BigPanda, and Stackstorm.
Pros and Cons
Pros:
- Free to use with no setup fees
- Scalable for both small and large environments
- Highly customizable for various IT infrastructure needs
Cons:
- Occasional performance issues reported during high-load scenario
- Setup and configuration comes with a learning curve
New Product Updates from Icinga
Icinga Adds OpenTelemetry Support
Icinga introduces OpenTelemetry metrics support, HTTP response streaming, and key system updates. These improvements enhance performance, scalability, and integration with modern monitoring tools. For more information, visit Icinga’s official site.
 .
.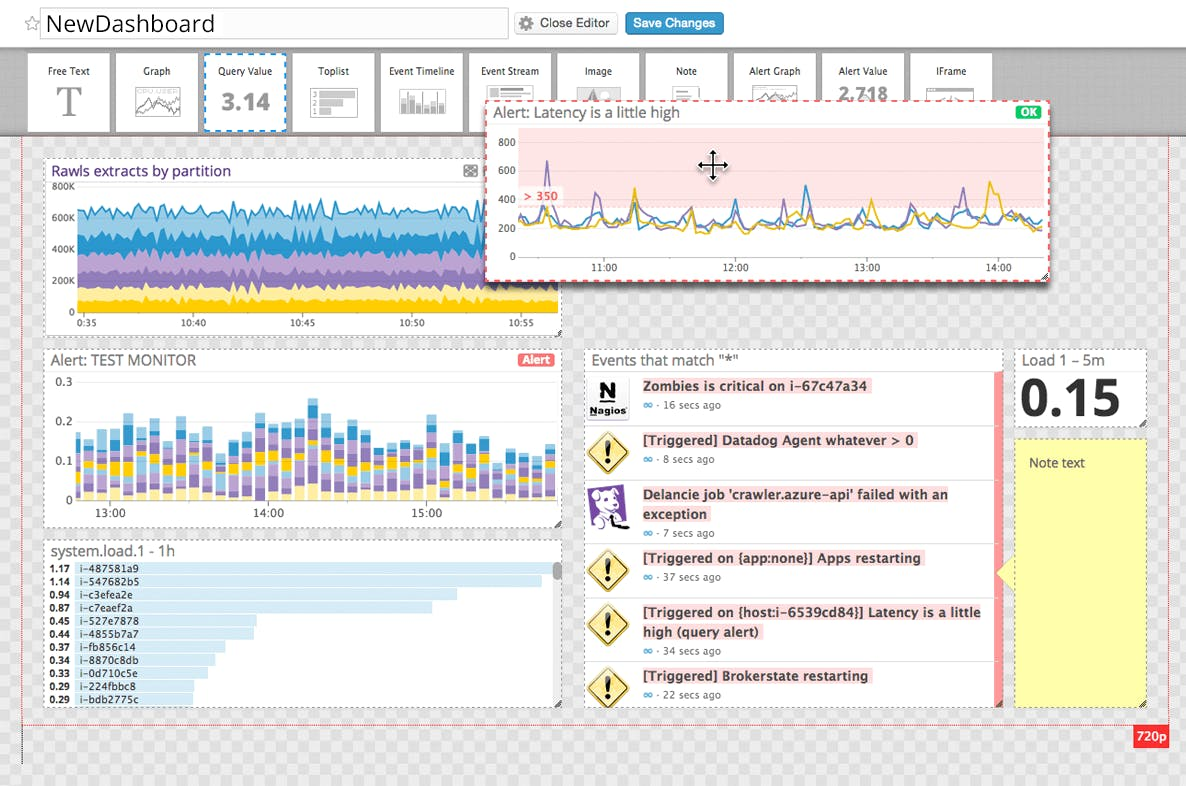
Datadog is a comprehensive platform that allows you to measure performance, troubleshoot issues, and optimize your infrastructure. It allows you to collect data from all sources, including user sessions, and present it on an intuitive dashboard for analysis and troubleshooting.
Why I picked Datadog: Datadog provides all the essential features of a database monitoring platform when it comes to tracking performance metrics and troubleshooting issues. Beyond this, I picked Datadog because of its collaboration capabilities without sacrificing security. I think Datadog is great for any team size without worrying about security risks because it allows you to create secure logins for each user and limit their access to sensitive information.
Datadog Standout Features and Integrations
The standout feature of Datadog is the provision to secure personally identifiable information (PII) through its automatic obfuscation from all query data. I think this is the feature that makes Datadog a secure, collaborative monitoring platform. Datadog enables scalable DBM access where you can add or remove members whenever you want while specifying their level of access.
Datadog offers more than 600 built-in integrations like Amazon RDS, Amazon Lambda, Microsoft Azure, Google Cloud, Hive, Jira, Kong, and OpenAI, to name a few. It also offers REST API functionality that allows you to build integrations with any service.
Pros and Cons
Pros:
- Out-of-the-box slow query detection
- User-friendly incident management
- Real-time, centralized monitoring of everything
Cons:
- More integrations can lead to slow performance and information delivery
- Pricing of logs by volume leads to high costs

Site24x7 is a comprehensive monitoring platform designed for IT operations and DevOps teams, providing services to monitor websites, databases, servers, cloud resources, networks, and applications.
Why I picked Site24x7: It supports a wide range of database systems, including SQL, NoSQL, and Oracle, whether they're on-premises or in hybrid setups. I also like its ability to auto-discover and visualize critical metrics. This feature aggregates data into a holistic dashboard, giving you both host-level and query-level overviews of all nodes in your cluster. With this comprehensive view, you can quickly pinpoint and resolve issues like slow response times or high load.
Site24x7 Standout Features and Integrations
Site24x7 supports monitoring heterogeneous databases from various environments in a single console. Whether you're managing relational databases like Oracle DB, MSSQL, MySQL, PostgreSQL, and SAP HANA, or NoSQL databases like MongoDB and Cassandra, Site24x7 provides a unified view. Additionally, it offers AI-powered monitoring, which aids in proactively identifying potential issues before they impact your database performance.
Integrations include ServiceNow, PagerDuty, Jira, Microsoft Teams, Slack, Nagios, AWS, Azure, Google Cloud Platform, Docker, Jenkins, and Kubernetes.
Pros and Cons
Pros:
- Comprehensive monitoring for various systems
- Customizable dashboards and reports
- Offers real-time alerts across various channels
Cons:
- Complexity in initial setup for large environments
- Excessive alerts can be overwhelming for users
New Product Updates from Site24x7
Site24x7 Adds Synchronization Statuses for MSPs
Site24x7 now provides MSPs enhanced alerts and synchronization statuses in a centralized notification center to spot configuration sync issues sooner and accelerate incident response. For more information, visit Site24x7's official site.


DbVisualizer offers a practical mix of visualization and management tools for teams that need to monitor and understand their database activity. With strong SQL charting features, it lets you turn query results into clear visual insights that help you spot trends and performance issues faster. Its ability to track data changes and present results in multiple formats makes it a useful option for maintaining database health and optimizing performance.
Why I Picked DbVisualizer
I picked DbVisualizer for its strong SQL charting features, which let you turn query results into visual charts that make performance patterns easy to spot. Its real-time data monitoring allows you to run SQL statements at set intervals and view results in grid, text, or chart formats, all in one place. With the ability to watch multiple databases simultaneously and automatically track any result set, DbVisualizer helps administrators identify trends and issues quickly without manual effort.
DbVisualizer Key Features
In addition to SQL charting, DbVisualizer offers:
- Automatic Monitoring: It allows you to set up automated monitoring of SQL statements, ensuring continuous oversight of database performance.
- Data Export: The ability to print and export monitored data ensures that you can share insights and reports easily with your team.
- Explain Plan Analysis: Inspect how queries run to improve efficiency and reduce load.
DbVisualizer Integrations
Native integrations include Oracle, SQL Server, MySQL, PostgreSQL, DB2, Sybase, SQLite, Derby, H2, and HSQLDB.
Pros and Cons
Pros:
- Offers visual query builders for streamlined coding
- Allows inline data editing with spreadsheet simplicity
- Includes version control for SQL scripts
Cons:
- Some users report occasional performance slowdowns
- Can be resource-intensive on large database environments
New Product Updates from DbVisualizer

DbVisualizer Adds AI Enhancements, Map Visualization, and SQL Tab Groups
DbVisualizer expands AI capabilities, introduces geospatial map visualization, and adds SQL Commander tab groups. The release also improves audit logging, database connection management, and database support to streamline development workflows. For more information, visit DbVisualizer's official site.
 .
.
NinjaOne is a cloud-based IT management platform designed to simplify and automate various aspects of IT operations. It offers tools for remote monitoring, patch management, and IT asset tracking, enabling IT professionals and managed service providers to oversee and maintain their IT infrastructure.
Why I picked NinjaOne: I picked NinjaOne as a good database monitoring tool because it lets you monitor SQL Server performance with custom scripts, disk space thresholds, and latency checks. You can set alerts to trigger technician notifications when performance drops, helping you catch issues early. It also supports automated responses to these alerts, cutting down on manual tasks. Plus, all SQL Server instances can be tracked from a centralized dashboard, so your team doesn’t need to log into each one individually.
NinjaOne Standout Features and Integrations
Other features include customizable alerting mechanisms that notify you of potential issues based on predefined conditions, allowing for prompt attention to critical matters. The platform also offers real-time performance monitoring, enabling continuous oversight of system health and immediate detection of anomalies.
Integrations include Accelo, Autotask, Bitdefender, BrightGauge, Connectwise Manage, CrowdStrike, IT Glue, Microsoft Entra, Okta, Slack, SentinelOne, and Zendesk.
Pros and Cons
Pros:
- Centralized control over device configurations
- Effective patch management automation
- Comprehensive endpoint management capabilities
Cons:
- The mobile app could offer more functionalities
- Initial setup may require time and resources
New Product Updates from NinjaOne
NinjaOne Adds Windows Agent Deployment to Network Discovery
NinjaOne adds Windows agent deployment directly from Network Discovery. This update helps IT teams move from discovering unmanaged Windows devices to monitoring, patching, and managing them faster. For more information, visit NinjaOne’s official site.
 .
.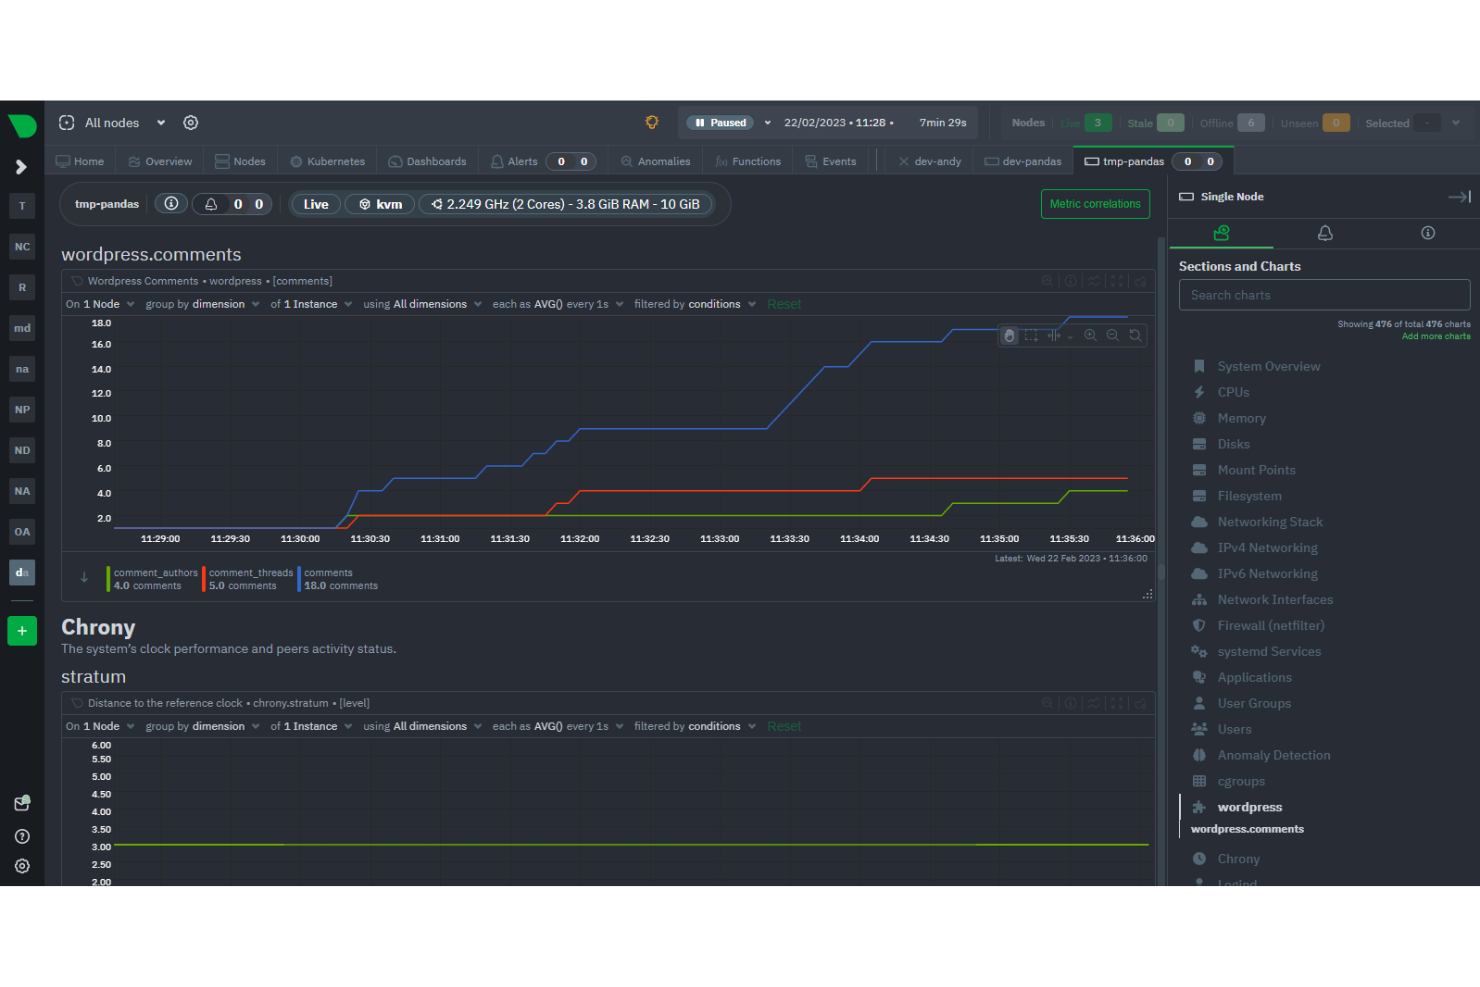
Netdata is an open-source monitoring and troubleshooting platform that provides real-time, high-resolution metrics and visualizations for systems, hardware, containers, and applications. It emphasizes minimal resource usage and supports a wide range of operating systems including Linux, FreeBSD, and MacOS.
Why I picked Netdata: I chose Netdata because it's designed to collect per-second metrics such as CPU usage, disk activity, bandwidth usage, and website visits, and display them in low-latency dashboards. This real-time capability is particularly valuable for database monitoring, where timely data is crucial for maintaining system health and performance. Netdata also offers rapid setup and full automation, which allows users to begin monitoring with a simple command, gaining access to fully automated dashboards and preconfigured alerts.
Netdata Standout Features and Integrations
A standout feature of Netdata is its health engine that can send automated alarms about anomalous behavior or performance degradation to your favorite notification apps. It collects, stores, queries, visualizes, alerts, and even trains machine-learning models for every single metric.
Integrations include Containers, Kubernetes Containers, Virtual Machines, Apache, Consul, Elasticsearch, OpenSearch, MySQL, Redis, Squid log files, Windows, macOS, and hundreds more.
Pros and Cons
Pros:
- Real-time monitoring
- Many integrations available
- Prebuilt dashboards and alarms
Cons:
- Learning curve for new users
- Some compatibility issues

Adverity is a data platform that helps marketing teams manage and monitor their data workflows. It offers tools to connect, transform, and oversee data from various sources.
Why I picked Adverity: Adverity offers automated data quality monitoring to catch issues like duplicates, anomalies, and delays before they impact your dashboards. You can set custom rules that trigger alerts when data doesn’t meet your standards. The platform also shows whether data streams are complete, fetching, or missing, so you can address gaps quickly. These monitoring tools help keep your marketing data reliable and analysis-ready. Everything happens in real time, reducing the need for manual checks.
Adverity Standout Features and Integrations
Some other features include smart naming conventions to ensure consistency in data fields. Additionally, Adverity provides a data dictionary that maps source data fields to your centralized system, making it easier to understand and manage your data structure.
Integrations include Google, Meta, TikTok, Google BigQuery, Looker Studio, Facebook Ads, Amazon Advertising, Hubspot, Salesforce, Amazon S3, Snowflake, and Microsoft Azure.
Pros and Cons
Pros:
- Automated data quality monitoring
- Provides the ability to create personalized dashboards
- Can harmonize data from various sources
Cons:
- Certain configurations may require technical knowledge
- The initial setup can be time-consuming
New Product Updates from Adverity
Adverity Enhances Connectors and Adds TikTok GMV Max
Adverity updates connectors for Amazon Ads, SmartNews Ads, Indeed, and monday.com, and introduces the TikTok GMV Max connector. These updates improve data accuracy, control, and performance across integrations. For more information, visit Adverity’s official site.
 .
.Other Data Monitoring Tools
Here are some other database monitoring tools that are best for special scenarios:
- New Relic
Monitoring tool for startups and small businesses
- Prometheus
For time series-based monitoring
- Grafana Cloud
For visualizations and intuitive dashboards
- SolarWinds Database Performance Analyzer
For machine learning-powered performance tuning
- AppDynamics Database Monitoring
Full-stack observability platform for enterprises
- Paessler PRTG
Easy-to-use solution for monitoring IT infrastructure
- Quest Foglight for Databases
For cross-platform database monitoring
- Redgate SQL Monitor
For SQL monitoring
- PRTG
For comprehensive IT infrastructure monitoring
- Zabbix
Open-source monitoring for enterprises
- Splunk
Unified platform for observability and security
- Elastic
For AI-powered search analytics and automated monitoring
- Amazon CloudWatch
For AWS environments
- InfluxDB
Time-series database for event logging
- Oracle Enterprise Manager
For end-to-end Oracle database management


Related Software & Tool Reviews
If you still haven't found what you're looking for here, check out these other types of tools that we've tested and evaluated.
- Network Monitoring Software
- Server Monitoring Software
- SD-Wan Solutions
- Infrastructure Monitoring Tools
- Packet Sniffer
- Application Monitoring Tools
How I Evaluate Database Monitoring Tools
When a runaway query locks a production table or replication lag climbs, these tools are what DBAs and SREs use to diagnose and respond. My evaluation comes down to two things: the baseline every tool has to clear, and what actually differentiates one pick from another.
Core Functionality (Table Stakes for This List)
For database monitoring tools, the core functionality I test and evaluate is:
- Real-time performance metrics: I look for live visibility into CPU, memory, disk I/O, and active connections at the instance level. If I can’t see a spike in buffer pool usage the moment it happens, the tool is too slow.
- Query profiling and analysis: The tool needs to capture individual queries, rank them by resource cost, and surface execution plans. I test this by running a known slow query and checking whether the tool flags it, shows wait times, and identifies what’s blocking it.
- Configurable alerting: I evaluate whether alerts can be set against both static thresholds and adaptive baselines learned from historical patterns. A good alert fires when replication lag exceeds normal range for that time of day, not just when it crosses a fixed number.
- Multi-engine support: I check which database engines are covered out of the box, including relational databases like PostgreSQL, MySQL, SQL Server, and Oracle, plus NoSQL options like MongoDB and Redis. A tool that only supports one engine needs to be exceptionally deep to justify the limitation.
- Historical trend analysis: I need at least 30 days of retained metric data to compare performance before and after a deployment or config change. I test whether the tool makes it easy to overlay time ranges and spot capacity trends heading toward trouble.
- Cloud and hybrid awareness: The tool must monitor cloud-managed services like Amazon RDS, Azure SQL, and Google Cloud SQL alongside on-prem instances. I verify it can pull cloud-specific metrics like read replica lag or provisioned IOPS utilization, not just generic OS-level stats.
- Dashboards and visualization: I evaluate whether pre-built dashboards give a usable overview on day one and whether I can build custom views for different audiences. A DBA needs query-level drill-downs, while a manager needs a green/yellow/red health summary.
If a tool can’t do these things reliably, it didn’t make the cut regardless of what else it offers.
Standout Features (What Separates the Picks)
When choosing standout database monitoring tools, I look for advanced root-cause analysis, true AI-driven anomaly detection, and deep integration with APM and ITSM platforms. Actionable query-tuning recommendations, turnkey compliance reporting, OpenTelemetry support, and streamlined deployment for modern cloud and Kubernetes environments are also things I keep an eye out for.
Finally, I test how quickly each tool surfaces actionable insights and how easy it is to connect the dots from database pain to business impact.
What I Weigh Beyond Features
Beyond specific features and capabilities, I also evaluate pricing models, deployment flexibility, and organizational fit. A per-host SaaS model like Datadog works well for cloud-native teams, while perpetual licenses from SolarWinds or IDERA suit stable on-prem environments.
I look at agent footprint on production servers, time-to-value for lean IT teams, and whether the vendor offers compliance reporting for regulated industries. Total cost of ownership matters more than sticker price.
How to Choose a Database Monitoring Tool
As you're shortlisting, trialing, and selecting database monitoring tools, consider the following:
- What problem are you trying to solve - Start by identifying the database monitoring feature gap you're trying to fill to clarify the features and functionality the tool needs to provide.
- Who will need to use it - To evaluate cost and requirements, consider who'll be using the platform and how many licenses you'll need. You'll need to evaluate if it'll just be the data team, or the whole organization that will require access. When that's clear, it's worth considering if you're prioritizing ease of use for all, or speed for your technical power users.
- What other tools it needs to work with - Clarify what tools you're replacing, what tools are staying, and the tools you'll need to integrate with. This could include your existing data infrastructure, various No SQL database sources, and your overall tech stack. You might also need to decide if the tools will need to integrate together, or alternatively, if you can replace multiple tools with one consolidated database monitoring tool.
- What outcomes are important - Consider the result that the tool needs to deliver to be considered a success. Think about what capability you want to gain, or what you want to improve, and how you will be measuring success. You could compare database monitoring tool features until you’re blue in the face, but if you aren’t thinking about the outcomes you want to drive, you could be wasting a lot of valuable time.
- How it would work within your organization - Consider the solutions alongside your workflows and delivery methodology. Evaluate what's working well, and the areas that are causing issues that need to be addressed. Remember every business is different — don’t assume that because a tool is popular that it'll work in your organization.
Trends in Database Monitoring Tools
The landscape of database monitoring tools is rapidly evolving, reflecting the increasing complexity of data environments and the growing demand for proactive, real-time management of database systems. Through a review of product updates, press releases, and release logs from leading tools in the market, I've identified the following trends that are shaping the future of these products.
Evolving Features and Technology
- Integration with Cloud and Hybrid Environments: There's a significant push towards better integration capabilities with cloud services and hybrid environments. This trend reflects the shift in database storage and management from on-premises to cloud-based solutions, necessitating tools that can seamlessly monitor across these diverse environments.
- AI and Machine Learning for Predictive Analytics: Advanced predictive analytics powered by AI and machine learning algorithms are becoming more common. These features enable proactive issue identification and resolution, significantly reducing downtime and optimizing database performance.
- Automation in Performance Tuning: Automation capabilities for database performance tuning are rapidly evolving. Tools are now equipped with more intelligent algorithms to automatically adjust configurations for optimal performance without human intervention.
Most In-Demand Features, and Features Declining in Importance
- Scalability and Flexibility: As databases grow in size and complexity, the ability to scale monitoring tools without losing performance or increasing latency is highly valued. Flexibility in monitoring various database types and architectures is also crucial.
- Extensive Manual Configuration: The need for extensive manual configuration and setup is diminishing. With the move towards more intelligent, adaptive tools, the preference is shifting towards solutions that require minimal manual effort to deploy and maintain.
These trends illustrate a clear trajectory towards more intelligent, automated, and integrated database monitoring solutions, often incorporating database DevOps tools. As databases become more central to business operations, data professionals are looking for solutions that can not only keep pace with the rapid evolution of database environments but also offer innovative features that anticipate future challenges.
What Are Database Monitoring Tools?
A database monitoring tool is a software application to monitor the performance, availability, and overall health status of a database. It tracks critical metrics like disk usage, query performance, database server resources, and system performance.
Database administrators, IT operations, and support teams use database monitoring tools to identify bottlenecks, maintain the efficiency of the database environment, and ensure optimal performance while minimizing downtime. These teams often complement their monitoring efforts with comprehensive database testing strategies to prevent issues before they impact production systems.
Features
When it comes to maintaining the efficiency of a database environment, employing robust monitoring tools is paramount. Here are some key features I look for in my research:
- Real-time monitoring: Real-time monitoring and visualization from SQL analytics tools enable quick detection and response to issues, minimizing downtime and ensuring optimal performance.
- Alerting and notifications: Alerting and notifications help in proactively addressing potential issues before they escalate, ensuring uninterrupted operations.
- Performance analytics: Assists in optimizing database performance by pinpointing areas for improvement and forecasting future resource needs.
- Resource utilization tracking: Monitoring resource utilization ensures efficient allocation of resources, preventing bottlenecks and maintaining optimal performance.
- Query performance analysis: Identifying and optimizing poorly performing queries enhance overall database performance and user experience.
- Security auditing: Security auditing helps in ensuring compliance with regulations and safeguarding sensitive data from breaches or unauthorized access.
- Automated backups and recovery: Automatically backs up database data and enables swift recovery in case of data loss or corruption.
- Scalability monitoring: Helps in proactively scaling resources to accommodate growing demands and maintaining performance under heavy loads.
- Historical data retention: Enables informed decision-making and proactive management of database resources.
- Customizable dashboards and reports: Provides customizable dashboards and reports to visualize key performance metrics.
Deciding on which of these features will be of the highest priority to meet your needs ensures you find the tool that's best for your business.
Benefits
Database monitoring tools offer numerous benefits for users and organizations, providing essential insights into the performance, availability, and health of their database environments. Here are five primary benefits of utilizing these tools:
- Improved Performance Optimization: By continuously monitoring database performance metrics, users can identify bottlenecks and inefficiencies, enabling them to optimize performance and enhance system responsiveness.
- Enhanced System Reliability: Database monitoring tools alert users to potential issues or anomalies in real-time, allowing for proactive troubleshooting and minimizing downtime, thus ensuring the reliability of critical systems.
- Increased Operational Efficiency: With automated monitoring and alerting capabilities, organizations can streamline operational processes and allocate resources more efficiently, resulting in improved productivity and cost savings.
- Better Resource Utilization: By tracking resource utilization trends, users can make informed decisions regarding resource allocation and capacity planning, ensuring optimal utilization of hardware and software resources.
- Enhanced Security and Compliance: Database monitoring tools enable users to monitor access and activities, detect unauthorized or suspicious behavior, and ensure compliance with regulatory requirements, thereby enhancing data security and mitigating risks.
Incorporating database monitoring tools into your data operations empowers you to achieve greater efficiency, reliability, and overall business success.
Costs & Pricing
Navigating the plethora of plan and pricing options for database monitoring tools can be daunting for software buyers new to the field. These platforms come in different pricing structures for varying business sizes and needs. Getting familiar with average costs and plan structures helps you make an informed purchasing choice.
Plan Comparison Table for Database Monitoring Tools
Below, I outline the various plan options along with their average pricing and common features to help you make an informed decision:
| Plan Type | Average Price | Common Features |
|---|---|---|
| Free | $0 | Basic monitoring functionalities such as real-time monitoring, limited alerts, and basic performance analytics. |
| Standard | $50-$200/month | Expanded monitoring capabilities, customizable dashboards, alerting and notification features, historical data retention. |
| Professional | $200-$500/month | Advanced performance analytics, enhanced security features, scalability monitoring, automated backups and recovery. |
| Enterprise | $500+/month | Comprehensive suite of monitoring and data observability tools, dedicated support, custom integrations, priority access to new features. |
Be sure to evaluate your organization's specific requirements and budget constraints when selecting the most suitable plan. Consider whether the platform will scale with the evolving needs of your organization.
Database Monitoring Tools Frequently Asked Questions
Here are some other frequently asked questions about database monitoring tools that you may find useful:
What can database performance monitoring tools tell me about my databases?
What are the most important database performance metrics, and how do you monitor them?
What’s Next:
If you're in the process of researching database monitoring tools, connect with a SoftwareSelect advisor for free recommendations.
You fill out a form and have a quick chat where they get into the specifics of your needs. Then you'll get a shortlist of software to review. They'll even support you through the entire buying process, including price negotiations.