10 Migliori Strumenti di Monitoraggio Database Recensiti per il 2026

Migliori strumenti di monitoraggio dei database - Shortlist


Con così tanti strumenti di monitoraggio dei database disponibili, capire quale sia quello giusto per te può essere difficile. Vuoi migliorare il processo di gestione del tuo database, ma devi capire quale strumento possa davvero aiutarti. Nessun problema! In questo articolo ti aiuto a scegliere facilmente, condividendo le mie esperienze personali usando decine di strumenti diversi di monitoraggio dei database in grandi team e progetti, con i miei consigli sui migliori strumenti di monitoraggio dei database.
Table of Contents
Perché Fidarti delle Nostre Recensioni Software
Testiamo e recensiamo software dal 2023. Come leader tecnologici, sappiamo quanto sia cruciale e difficile prendere la decisione giusta nella scelta di un software.
Investiamo in una ricerca approfondita per aiutare il nostro pubblico a effettuare scelte migliori di acquisto software. Abbiamo testato oltre 2.000 strumenti per diversi casi d’uso tecnologici e scritto più di 1.000 recensioni complete. Scopri come restiamo trasparenti e la nostra metodologia di recensione del software.
Sommario dei Migliori strumenti di monitoraggio dei database
| Tool | Best For | Trial Info | Price | ||
|---|---|---|---|---|---|
| 1 | Best scalable IT monitoring platform | Free plan + 30-day free trial available | From $275/month (billed annually) | Website | |
| 2 | Best for database performance optimization of business-critical applications | 30-day free trial + free demo + free plan availabl | From $199/year | Website | |
| 3 | Best for full-stack observability and application performance monitoring | Free trial available | From $7/host/month | Website | |
| 4 | Best open-source solution | Free plan available | Pricing upon request | Website | |
| 5 | Best for secure database monitoring | 14-day free trial | From $15/host/month (billed annually) | Website | |
| 6 | Best for comprehensive database insights | 30-day free trial + free demo available | From $10/month (billed annually) | Website | |
| 7 | Best for SQL charting features | 21-day free trial | From $199/user/year (billed annually) | Website | |
| 8 | Best for centralized SQL monitoring | 14-day free trial available | Pricing upon request | Website | |
| 9 | Best for real-time system health monitoring | 14-day free trial + free plan + free demo available | From $4.50/node/month (billed annually) | Website | |
| 10 | Best for marketing databases | Free demo available | Pricing upon request | Website |
-

TestDevLab
Visit Website -
Site24x7
Visit WebsiteThis is an aggregated rating for this tool including ratings from Crozdesk users and ratings from other sites.4.7 -
GitHub Actions
Visit WebsiteThis is an aggregated rating for this tool including ratings from Crozdesk users and ratings from other sites.4.8


Recensioni dei migliori strumenti di monitoraggio dei database
Qui sotto trovi la mia lista dei migliori strumenti di monitoraggio dei database, insieme alla mia analisi delle loro principali funzioni e caratteristiche che li rendono unici nel ricco mercato degli strumenti di monitoraggio IT.
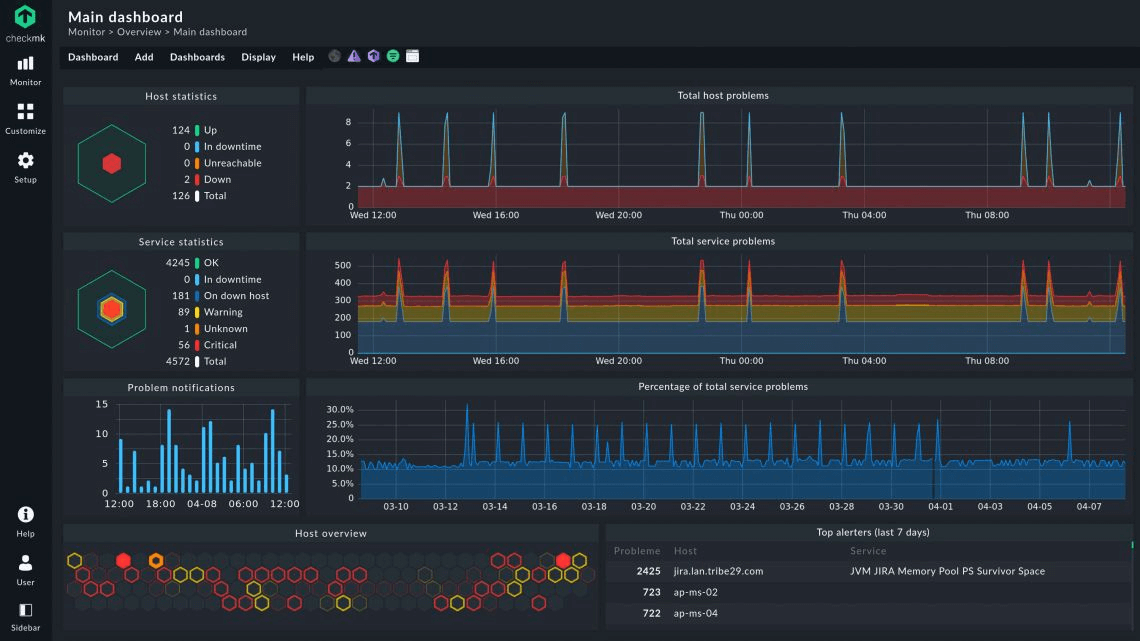
Checkmk is an IT infrastructure monitoring solution that gives you the freedom to customize everything while monitoring. You can track network devices, cloud services, databases, operating systems, server hardware, and web applications.
Why I picked Checkmk: I picked Checkmk because of its flexibility and scalability. It comes with more than 2,000 plugins to help you monitor various aspects of your entire IT infrastructure. You can start with its free forever open-source edition and move to Enterprise or Cloud edition when you want to automate and scale your IT monitoring.
Checkmk Standout Features and Integrations
I think the main standout feature of Checkmk is its rule-based 1-to-N configuration. This results in a low configuration and setup effort in complex IT environments as well and makes it highly scalable.
Checkmk offers a range of pre-built integrations with technologies like Amazon Web Services (AWS), Microsoft Azure, VMware, and Docker. It also offers native integrations with monitoring protocols, including SNMP, WMI, and JMX, to monitor infrastructure components.
Pros and Cons
Pros:
- Free out-of-the-box plugins in the open-source edition itself
- Flexible licensing options
- Ability to customize nearly everything and monitor custom applications
Cons:
- Difficult UI navigation
- Steep learning curve
Best for database performance optimization of business-critical applications

ManageEngine Applications Manager is an application monitoring software. It excels in providing visibility into the performance and user experience of business-critical applications and infrastructure components. IT administrators and operators use ManageEngine to optimize their applications across physical, virtual, cloud, and container platforms.
Why I picked ManageEngine Applications Manager: I chose ManageEngine due to its out-of-the-box monitoring, alerting, and reporting for more than 150 applications and infrastructure elements. It employs agentless real-time database monitoring with automated discovery of database instances.
ManageEngine Applications Manager Standout Features and Integrations
Some of the standout features of ManageEngine Applications Manager include trend analysis, proactive anomaly detection using dynamic baselines, and multi-vendor database support. I think that its agentless monitoring using methods like native OS and API calls further makes it suitable for scaling business applications.
ManageEngine Applications Manager provides native integrations with databases like Oracle, MySQL, PostgreSQL, MongoDB, AWS Aurora, and Azure SQL. It also offers out-of-the-box integration with Slack, ServiceNow, and Site24x7.
Pros and Cons
Pros:
- Allows alert configuration at different levels
- In-built reporting tools
- Covers monitoring of microservices like Docker, Kubernetes
Cons:
- Outdated, clunky user interface
- Initial setup and configuration can be complex
New Product Updates from ManageEngine Applications Manager
Oracle Cloud Application Monitoring Now Available in ManageEngine Applications Manager
ManageEngine Applications Manager introduces Oracle Cloud Application Monitoring, Oracle Cloud Function Monitoring, and Oracle Cloud NAT Gateway Monitoring. These new capabilities help teams monitor Oracle Cloud applications, serverless workloads, and network resources from a single platform. For more information, visit ManageEngine Applications Manager's official site.
 .
.Best for full-stack observability and application performance monitoring
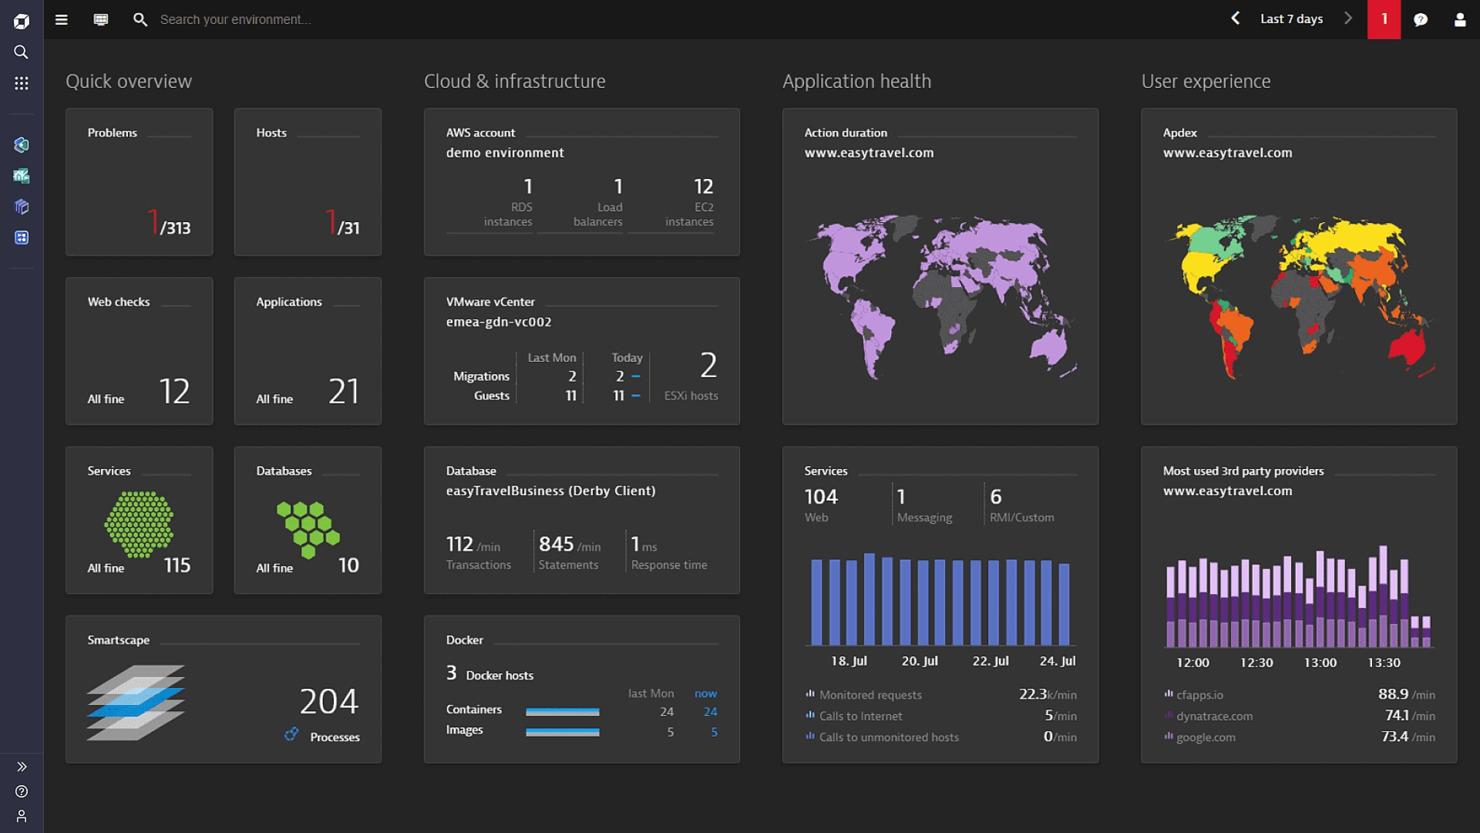
Dynatrace is an advanced observability and application performance monitoring (APM) tool. It gives you comprehensive insights into the performance and user experience of applications, infrastructure, and cloud environments.
Why I picked Dynatrace: I picked Dynatrace because of its AI-powered full-stack observability that prioritizes customer experience. It has a powerful real-user monitoring system that helps you track the user experience in real time and resolve complaints from a centralized system. I think its artificial intelligence capability and integrations with workflow and communication tools like Jira and Slack make it suitable for large teams and enterprise environments.
Dynatrace Standout Features and Integrations
The standout feature of Dynatrace, in my opinion, is its patented AI assistant called Davis AI for root cause analytics. It powers its entire suite to find performance issues faster and optimize the experience of end users.
Integrations include 600+ pre-built integrations with ServiceNow, Adobe Analytics, Apple Safari, Google Chrome, Amazon CloudWatch, Jira, and Slack. Dynatrace also offers native integrations with major cloud platforms like AWS, Microsoft Azure, and Google Cloud.
Pros and Cons
Pros:
- Faster root cause analysis driven by AI
- Real user monitoring for application performance
- Easy configuration
Cons:
- Can be expensive
- Agent-based monitoring can lead to system performance issues

Icinga is an open-source monitoring solution designed to support complex IT environments. It provides a comprehensive stack for monitoring infrastructure, cloud, databases, and applications, ensuring that your systems are running smoothly.
Why I picked Icinga: I like Icinga because it lets you inspect connectivity and health across many database types—like MySQL, MariaDB, PostgreSQL—by tracking metrics such as thread counts, buffer pool usage, replication lag, and slow queries. These checks give your team actionable insight so you can address bottlenecks or performance drops early. You can also define custom queries tailored to your environment. For example, you can pull internal database stats or confirm backup availability, and if you want, export all metrics into your own time-series store.
Icinga Standout Features and Integrations
Other features include monitoring automation, which helps reduce manual intervention by automating routine monitoring tasks. The platform also provides metrics and logs integration, allowing you to capture and analyze data from various sources for better insights.
Integrations include Grafana, AWS, Azure, Puppet, Ansible, Chef, Terraform, Jira, PagerDuty, ServiceNow, BigPanda, and Stackstorm.
Pros and Cons
Pros:
- Free to use with no setup fees
- Scalable for both small and large environments
- Highly customizable for various IT infrastructure needs
Cons:
- Occasional performance issues reported during high-load scenario
- Setup and configuration comes with a learning curve
New Product Updates from Icinga
Icinga Adds OpenTelemetry Support
Icinga introduces OpenTelemetry metrics support, HTTP response streaming, and key system updates. These improvements enhance performance, scalability, and integration with modern monitoring tools. For more information, visit Icinga’s official site.
 .
.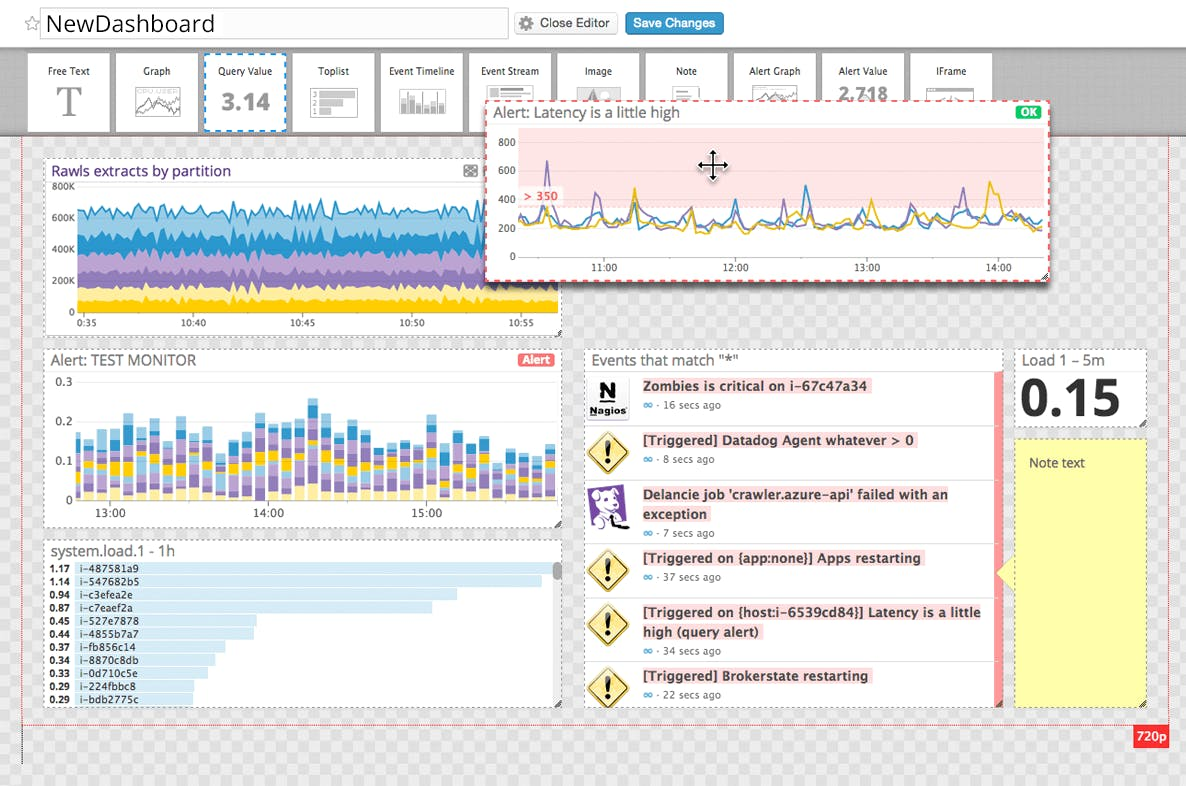
Datadog is a comprehensive platform that allows you to measure performance, troubleshoot issues, and optimize your infrastructure. It allows you to collect data from all sources, including user sessions, and present it on an intuitive dashboard for analysis and troubleshooting.
Why I picked Datadog: Datadog provides all the essential features of a database monitoring platform when it comes to tracking performance metrics and troubleshooting issues. Beyond this, I picked Datadog because of its collaboration capabilities without sacrificing security. I think Datadog is great for any team size without worrying about security risks because it allows you to create secure logins for each user and limit their access to sensitive information.
Datadog Standout Features and Integrations
The standout feature of Datadog is the provision to secure personally identifiable information (PII) through its automatic obfuscation from all query data. I think this is the feature that makes Datadog a secure, collaborative monitoring platform. Datadog enables scalable DBM access where you can add or remove members whenever you want while specifying their level of access.
Datadog offers more than 600 built-in integrations like Amazon RDS, Amazon Lambda, Microsoft Azure, Google Cloud, Hive, Jira, Kong, and OpenAI, to name a few. It also offers REST API functionality that allows you to build integrations with any service.
Pros and Cons
Pros:
- Out-of-the-box slow query detection
- User-friendly incident management
- Real-time, centralized monitoring of everything
Cons:
- More integrations can lead to slow performance and information delivery
- Pricing of logs by volume leads to high costs

Site24x7 is a comprehensive monitoring platform designed for IT operations and DevOps teams, providing services to monitor websites, databases, servers, cloud resources, networks, and applications.
Why I picked Site24x7: It supports a wide range of database systems, including SQL, NoSQL, and Oracle, whether they're on-premises or in hybrid setups. I also like its ability to auto-discover and visualize critical metrics. This feature aggregates data into a holistic dashboard, giving you both host-level and query-level overviews of all nodes in your cluster. With this comprehensive view, you can quickly pinpoint and resolve issues like slow response times or high load.
Site24x7 Standout Features and Integrations
Site24x7 supports monitoring heterogeneous databases from various environments in a single console. Whether you're managing relational databases like Oracle DB, MSSQL, MySQL, PostgreSQL, and SAP HANA, or NoSQL databases like MongoDB and Cassandra, Site24x7 provides a unified view. Additionally, it offers AI-powered monitoring, which aids in proactively identifying potential issues before they impact your database performance.
Integrations include ServiceNow, PagerDuty, Jira, Microsoft Teams, Slack, Nagios, AWS, Azure, Google Cloud Platform, Docker, Jenkins, and Kubernetes.
Pros and Cons
Pros:
- Comprehensive monitoring for various systems
- Customizable dashboards and reports
- Offers real-time alerts across various channels
Cons:
- Complexity in initial setup for large environments
- Excessive alerts can be overwhelming for users
New Product Updates from Site24x7
Site24x7 Adds Synchronization Statuses for MSPs
Site24x7 now provides MSPs enhanced alerts and synchronization statuses in a centralized notification center to spot configuration sync issues sooner and accelerate incident response. For more information, visit Site24x7's official site.


DbVisualizer offers a practical mix of visualization and management tools for teams that need to monitor and understand their database activity. With strong SQL charting features, it lets you turn query results into clear visual insights that help you spot trends and performance issues faster. Its ability to track data changes and present results in multiple formats makes it a useful option for maintaining database health and optimizing performance.
Why I Picked DbVisualizer
I picked DbVisualizer for its strong SQL charting features, which let you turn query results into visual charts that make performance patterns easy to spot. Its real-time data monitoring allows you to run SQL statements at set intervals and view results in grid, text, or chart formats, all in one place. With the ability to watch multiple databases simultaneously and automatically track any result set, DbVisualizer helps administrators identify trends and issues quickly without manual effort.
DbVisualizer Key Features
In addition to SQL charting, DbVisualizer offers:
- Automatic Monitoring: It allows you to set up automated monitoring of SQL statements, ensuring continuous oversight of database performance.
- Data Export: The ability to print and export monitored data ensures that you can share insights and reports easily with your team.
- Explain Plan Analysis: Inspect how queries run to improve efficiency and reduce load.
DbVisualizer Integrations
Native integrations include Oracle, SQL Server, MySQL, PostgreSQL, DB2, Sybase, SQLite, Derby, H2, and HSQLDB.
Pros and Cons
Pros:
- Offers visual query builders for streamlined coding
- Allows inline data editing with spreadsheet simplicity
- Includes version control for SQL scripts
Cons:
- Some users report occasional performance slowdowns
- Can be resource-intensive on large database environments
New Product Updates from DbVisualizer

DbVisualizer Adds AI Enhancements, Map Visualization, and SQL Tab Groups
DbVisualizer expands AI capabilities, introduces geospatial map visualization, and adds SQL Commander tab groups. The release also improves audit logging, database connection management, and database support to streamline development workflows. For more information, visit DbVisualizer's official site.
 .
.
NinjaOne is a cloud-based IT management platform designed to simplify and automate various aspects of IT operations. It offers tools for remote monitoring, patch management, and IT asset tracking, enabling IT professionals and managed service providers to oversee and maintain their IT infrastructure.
Why I picked NinjaOne: I picked NinjaOne as a good database monitoring tool because it lets you monitor SQL Server performance with custom scripts, disk space thresholds, and latency checks. You can set alerts to trigger technician notifications when performance drops, helping you catch issues early. It also supports automated responses to these alerts, cutting down on manual tasks. Plus, all SQL Server instances can be tracked from a centralized dashboard, so your team doesn’t need to log into each one individually.
NinjaOne Standout Features and Integrations
Other features include customizable alerting mechanisms that notify you of potential issues based on predefined conditions, allowing for prompt attention to critical matters. The platform also offers real-time performance monitoring, enabling continuous oversight of system health and immediate detection of anomalies.
Integrations include Accelo, Autotask, Bitdefender, BrightGauge, Connectwise Manage, CrowdStrike, IT Glue, Microsoft Entra, Okta, Slack, SentinelOne, and Zendesk.
Pros and Cons
Pros:
- Centralized control over device configurations
- Effective patch management automation
- Comprehensive endpoint management capabilities
Cons:
- The mobile app could offer more functionalities
- Initial setup may require time and resources
New Product Updates from NinjaOne
NinjaOne Adds Windows Agent Deployment to Network Discovery
NinjaOne adds Windows agent deployment directly from Network Discovery. This update helps IT teams move from discovering unmanaged Windows devices to monitoring, patching, and managing them faster. For more information, visit NinjaOne’s official site.
 .
.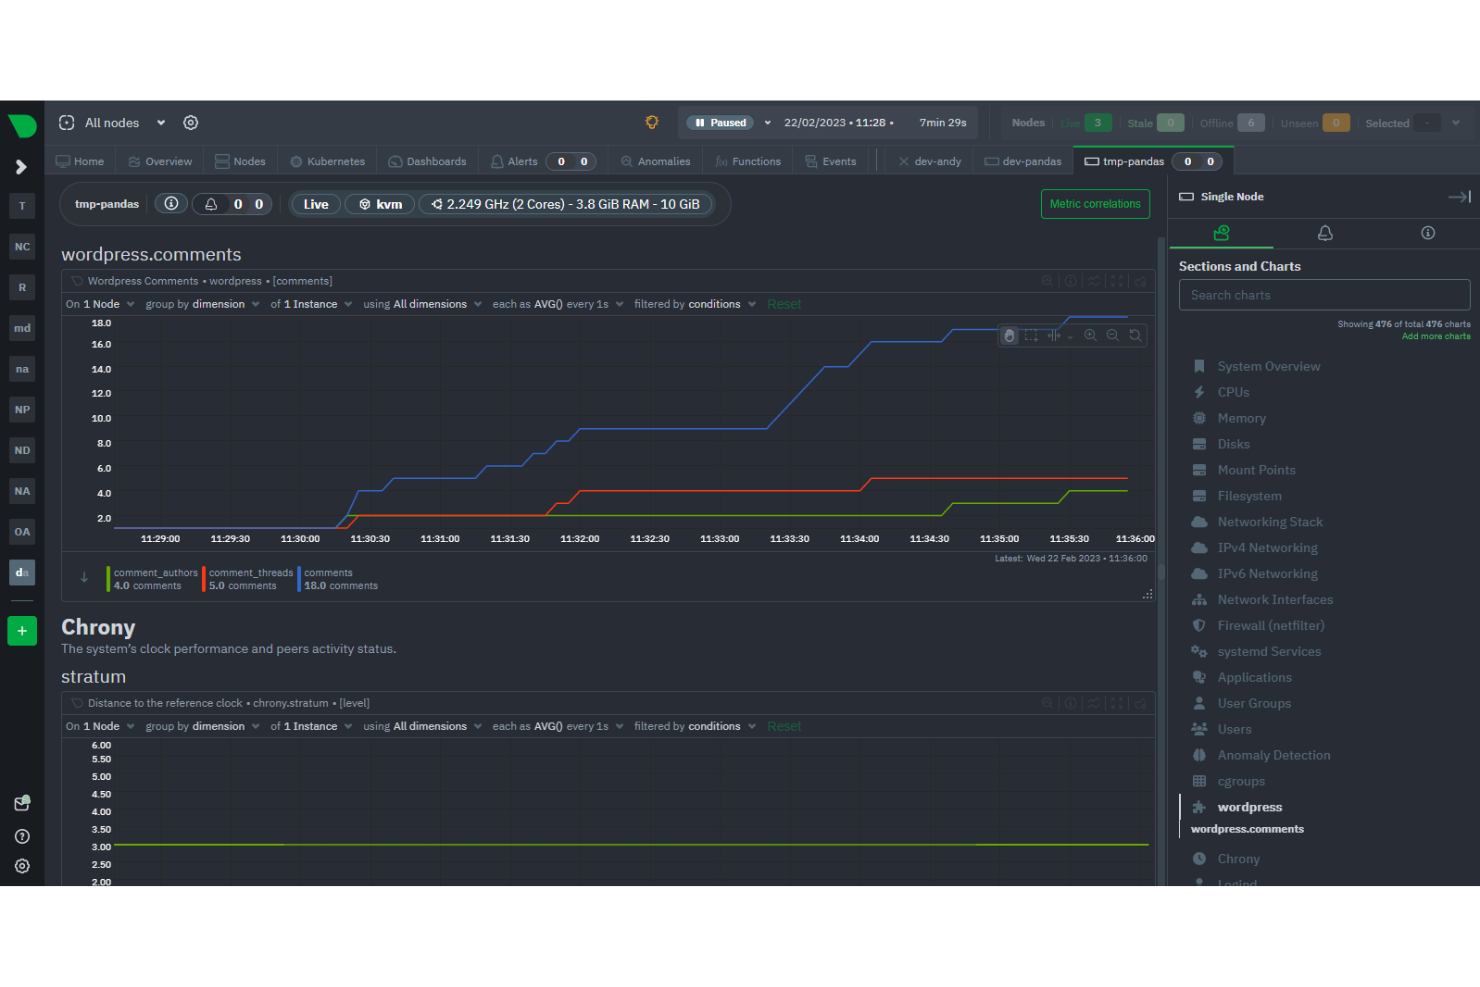
Netdata is an open-source monitoring and troubleshooting platform that provides real-time, high-resolution metrics and visualizations for systems, hardware, containers, and applications. It emphasizes minimal resource usage and supports a wide range of operating systems including Linux, FreeBSD, and MacOS.
Why I picked Netdata: I chose Netdata because it's designed to collect per-second metrics such as CPU usage, disk activity, bandwidth usage, and website visits, and display them in low-latency dashboards. This real-time capability is particularly valuable for database monitoring, where timely data is crucial for maintaining system health and performance. Netdata also offers rapid setup and full automation, which allows users to begin monitoring with a simple command, gaining access to fully automated dashboards and preconfigured alerts.
Netdata Standout Features and Integrations
A standout feature of Netdata is its health engine that can send automated alarms about anomalous behavior or performance degradation to your favorite notification apps. It collects, stores, queries, visualizes, alerts, and even trains machine-learning models for every single metric.
Integrations include Containers, Kubernetes Containers, Virtual Machines, Apache, Consul, Elasticsearch, OpenSearch, MySQL, Redis, Squid log files, Windows, macOS, and hundreds more.
Pros and Cons
Pros:
- Real-time monitoring
- Many integrations available
- Prebuilt dashboards and alarms
Cons:
- Learning curve for new users
- Some compatibility issues

Adverity is a data platform that helps marketing teams manage and monitor their data workflows. It offers tools to connect, transform, and oversee data from various sources.
Why I picked Adverity: Adverity offers automated data quality monitoring to catch issues like duplicates, anomalies, and delays before they impact your dashboards. You can set custom rules that trigger alerts when data doesn’t meet your standards. The platform also shows whether data streams are complete, fetching, or missing, so you can address gaps quickly. These monitoring tools help keep your marketing data reliable and analysis-ready. Everything happens in real time, reducing the need for manual checks.
Adverity Standout Features and Integrations
Some other features include smart naming conventions to ensure consistency in data fields. Additionally, Adverity provides a data dictionary that maps source data fields to your centralized system, making it easier to understand and manage your data structure.
Integrations include Google, Meta, TikTok, Google BigQuery, Looker Studio, Facebook Ads, Amazon Advertising, Hubspot, Salesforce, Amazon S3, Snowflake, and Microsoft Azure.
Pros and Cons
Pros:
- Automated data quality monitoring
- Provides the ability to create personalized dashboards
- Can harmonize data from various sources
Cons:
- Certain configurations may require technical knowledge
- The initial setup can be time-consuming
New Product Updates from Adverity
Adverity Enhances Connectors and Adds TikTok GMV Max
Adverity updates connectors for Amazon Ads, SmartNews Ads, Indeed, and monday.com, and introduces the TikTok GMV Max connector. These updates improve data accuracy, control, and performance across integrations. For more information, visit Adverity’s official site.
 .
.Altri strumenti di monitoraggio dei dati
Ecco alcuni altri strumenti di monitoraggio dei database che sono indicati per scenari particolari:
- New Relic
Monitoring tool for startups and small businesses
- Prometheus
For time series-based monitoring
- Grafana Cloud
For visualizations and intuitive dashboards
- SolarWinds Database Performance Analyzer
For machine learning-powered performance tuning
- AppDynamics Database Monitoring
Full-stack observability platform for enterprises
- Paessler PRTG
Easy-to-use solution for monitoring IT infrastructure
- Quest Foglight for Databases
For cross-platform database monitoring
- Redgate SQL Monitor
For SQL monitoring
- PRTG
For comprehensive IT infrastructure monitoring
- Zabbix
Open-source monitoring for enterprises
- Splunk
Unified platform for observability and security
- Elastic
For AI-powered search analytics and automated monitoring
- Amazon CloudWatch
For AWS environments
- InfluxDB
Time-series database for event logging
- Oracle Enterprise Manager
For end-to-end Oracle database management


Recensioni di altri software e strumenti correlati
Se ancora non hai trovato quello che cerchi qui, dai un'occhiata a queste altre tipologie di strumenti che abbiamo testato e valutato.
- Software di monitoraggio della rete
- Software di monitoraggio dei server
- Soluzioni SD-Wan
- Strumenti di monitoraggio dell'infrastruttura
- Packet Sniffer
- Strumenti di monitoraggio delle applicazioni
How I Evaluate Database Monitoring Tools
When a runaway query locks a production table or replication lag climbs, these tools are what DBAs and SREs use to diagnose and respond. My evaluation comes down to two things: the baseline every tool has to clear, and what actually differentiates one pick from another.
Core Functionality (Table Stakes for This List)
For database monitoring tools, the core functionality I test and evaluate is:
- Real-time performance metrics: I look for live visibility into CPU, memory, disk I/O, and active connections at the instance level. If I can’t see a spike in buffer pool usage the moment it happens, the tool is too slow.
- Query profiling and analysis: The tool needs to capture individual queries, rank them by resource cost, and surface execution plans. I test this by running a known slow query and checking whether the tool flags it, shows wait times, and identifies what’s blocking it.
- Configurable alerting: I evaluate whether alerts can be set against both static thresholds and adaptive baselines learned from historical patterns. A good alert fires when replication lag exceeds normal range for that time of day, not just when it crosses a fixed number.
- Multi-engine support: I check which database engines are covered out of the box, including relational databases like PostgreSQL, MySQL, SQL Server, and Oracle, plus NoSQL options like MongoDB and Redis. A tool that only supports one engine needs to be exceptionally deep to justify the limitation.
- Historical trend analysis: I need at least 30 days of retained metric data to compare performance before and after a deployment or config change. I test whether the tool makes it easy to overlay time ranges and spot capacity trends heading toward trouble.
- Cloud and hybrid awareness: The tool must monitor cloud-managed services like Amazon RDS, Azure SQL, and Google Cloud SQL alongside on-prem instances. I verify it can pull cloud-specific metrics like read replica lag or provisioned IOPS utilization, not just generic OS-level stats.
- Dashboards and visualization: I evaluate whether pre-built dashboards give a usable overview on day one and whether I can build custom views for different audiences. A DBA needs query-level drill-downs, while a manager needs a green/yellow/red health summary.
If a tool can’t do these things reliably, it didn’t make the cut regardless of what else it offers.
Standout Features (What Separates the Picks)
When choosing standout database monitoring tools, I look for advanced root-cause analysis, true AI-driven anomaly detection, and deep integration with APM and ITSM platforms. Actionable query-tuning recommendations, turnkey compliance reporting, OpenTelemetry support, and streamlined deployment for modern cloud and Kubernetes environments are also things I keep an eye out for.
Finally, I test how quickly each tool surfaces actionable insights and how easy it is to connect the dots from database pain to business impact.
What I Weigh Beyond Features
Beyond specific features and capabilities, I also evaluate pricing models, deployment flexibility, and organizational fit. A per-host SaaS model like Datadog works well for cloud-native teams, while perpetual licenses from SolarWinds or IDERA suit stable on-prem environments.
I look at agent footprint on production servers, time-to-value for lean IT teams, and whether the vendor offers compliance reporting for regulated industries. Total cost of ownership matters more than sticker price.
Come scegliere uno strumento di monitoraggio dei database
Quando selezioni, provi e valuti strumenti di monitoraggio dei database, prendi in considerazione i seguenti fattori:
- Quale problema stai cercando di risolvere - Inizia identificando la lacuna nelle funzionalità di monitoraggio dei database che vuoi colmare, così da chiarire quali caratteristiche e funzionalità lo strumento dovrà offrire.
- Chi dovrà utilizzarlo - Per valutare costi e requisiti, considera chi dovrà usare la piattaforma e quante licenze saranno necessarie. Dovrai capire se sarà solo il team dati o l'intera organizzazione ad aver bisogno di accesso. Una volta chiarito questo, varrà la pena considerare se prioritizzare la facilità d'uso per tutti o la velocità per gli utenti più tecnici e avanzati.
- Con quali altri strumenti dovrà funzionare - Chiarisci quali strumenti andrai a sostituire, quali rimarranno e con quali dovrai integrare. Questo potrebbe includere l'infrastruttura dati attuale, varie fonti No SQL database e l'intero stack tecnologico. Potresti anche dover decidere se gli strumenti dovranno integrarsi tra loro o se puoi sostituire più strumenti con uno unico e consolidato per il monitoraggio dei database.
- Quali risultati sono importanti - Considera il risultato che lo strumento deve ottenere per essere considerato un successo. Rifletti su quali capacità vuoi acquisire o cosa desideri migliorare e come misurerai il successo. Potresti confrontare le funzionalità degli strumenti di monitoraggio database all'infinito, ma se non pensi agli obiettivi che vuoi raggiungere, rischi di perdere molto tempo prezioso.
- Come funzionerà all'interno della tua organizzazione - Considera le soluzioni nel contesto dei tuoi workflow e delle metodologie di delivery. Valuta cosa sta già funzionando bene e quali aspetti causano problemi da affrontare. Ricorda che ogni azienda è diversa — non dare per scontato che, solo perché uno strumento è popolare, vada bene anche per la tua organizzazione.
Tendenze negli Strumenti di Monitoraggio dei Database
Il panorama degli strumenti di monitoraggio dei database sta rapidamente evolvendo, riflettendo la crescente complessità degli ambienti dati e la domanda sempre più forte di una gestione proattiva e in tempo reale dei sistemi database. Attraverso l’analisi di aggiornamenti di prodotto, comunicati stampa e log di rilascio dei principali strumenti sul mercato, ho individuato le seguenti tendenze che stanno modellando il futuro di questi prodotti.
Evoluzione delle Funzionalità e della Tecnologia
- Integrazione con Ambienti Cloud e Ibridi: C’è una forte spinta verso una migliore integrazione con i servizi cloud e gli ambienti ibridi. Questa tendenza riflette il passaggio dalla gestione dei database on-premises a soluzioni cloud, rendendo necessari strumenti che sappiano monitorare senza interruzioni tra questi diversi ambienti.
- AI e Machine Learning per l’Analisi Predittiva: Analisi predittive avanzate basate su AI e algoritmi di apprendimento automatico stanno diventando più comuni. Queste funzionalità consentono di individuare e risolvere in modo proattivo i problemi, riducendo notevolmente i tempi di inattività e ottimizzando le prestazioni del database.
- Automazione nell’Ottimizzazione delle Prestazioni: Le capacità di automazione nell’ottimizzazione delle prestazioni dei database stanno evolvendo rapidamente. Gli strumenti sono ora dotati di algoritmi sempre più intelligenti in grado di adeguare automaticamente le configurazioni per ottenere prestazioni ottimali senza intervento umano.
Funzionalità Più Richieste e Funzionalità in Calo di Importanza
- Scalabilità e Flessibilità: Con la crescita delle dimensioni e della complessità dei database, la capacità di scalare gli strumenti di monitoraggio senza perdere in prestazioni o aumentare la latenza è molto apprezzata. Fondamentale anche la flessibilità nel monitorare diversi tipi e architetture di database.
- Configurazione Manuale Estensiva: L’esigenza di una configurazione manuale estesa e di un setup complesso sta diminuendo. Con l’avanzare di strumenti sempre più intelligenti e adattivi, la preferenza si sposta verso soluzioni che richiedano il minimo sforzo manuale per l’implementazione e la manutenzione.
Queste tendenze illustrano una traiettoria chiara verso soluzioni di monitoraggio dei database più intelligenti, automatizzate e integrate, spesso con l’utilizzo di strumenti DevOps per database. Poiché i database diventano sempre più centrali per le operazioni di business, i professionisti dei dati cercano strumenti in grado non solo di tenere il passo con la rapida evoluzione degli ambienti database, ma anche di offrire funzionalità innovative che anticipino le sfide future.
Cosa Sono gli Strumenti di Monitoraggio dei Database?
Uno strumento di monitoraggio dei database è un’applicazione software progettata per monitorare le prestazioni, la disponibilità e lo stato generale di salute di un database. Tiene traccia di metriche fondamentali come l'uso del disco, le prestazioni delle query, le risorse del server database e le performance del sistema.
Amministratori di database, team IT e di supporto utilizzano strumenti di monitoraggio per individuare colli di bottiglia, mantenere l’efficienza dell’ambiente database e garantire prestazioni ottimali riducendo al minimo i tempi di inattività. Questi team spesso affiancano le attività di monitoraggio a strategie complete di testing dei database per prevenire problematiche prima che impattino sui sistemi in produzione.
Funzionalità
Quando si tratta di mantenere l'efficienza di un ambiente database, utilizzare strumenti di monitoraggio robusti è fondamentale. Ecco alcune funzionalità chiave che cerco durante la mia ricerca:
- Monitoraggio in tempo reale: Il monitoraggio e la visualizzazione in tempo reale dagli strumenti di analisi SQL consentono di rilevare e rispondere rapidamente ai problemi, riducendo al minimo i tempi di inattività e garantendo prestazioni ottimali.
- Avvisi e notifiche: Gli avvisi e le notifiche aiutano a intervenire in modo proattivo su potenziali problemi prima che si aggravino, assicurando operazioni senza interruzioni.
- Analitiche sulle prestazioni: Aiuta a ottimizzare le prestazioni del database identificando aree di miglioramento e prevedendo le future esigenze di risorse.
- Monitoraggio dell'utilizzo delle risorse: Monitorare l'utilizzo delle risorse garantisce una distribuzione efficiente delle stesse, prevenendo colli di bottiglia e mantenendo prestazioni ottimali.
- Analisi delle prestazioni delle query: Identificare e ottimizzare le query con prestazioni scarse migliora le prestazioni generali del database e l'esperienza utente.
- Audit di sicurezza: L'audit di sicurezza aiuta a garantire la conformità alle normative e a proteggere i dati sensibili da violazioni o accessi non autorizzati.
- Backup e ripristino automatici: Esegue automaticamente il backup dei dati del database e consente un rapido ripristino in caso di perdita o corruzione dei dati.
- Monitoraggio della scalabilità: Aiuta a scalare proattivamente le risorse per soddisfare la crescita della domanda e mantenere le prestazioni anche sotto carichi elevati.
- Mantenimento dei dati storici: Consente di prendere decisioni informate e gestire proattivamente le risorse del database.
- Dashboard e report personalizzabili: Fornisce dashboard e report personalizzabili per visualizzare i principali indicatori di prestazione.
Decidere quali di queste funzionalità avranno la priorità più alta per soddisfare le tue esigenze ti assicura di trovare lo strumento migliore per la tua azienda.
Vantaggi
Gli strumenti di monitoraggio dei database offrono numerosi vantaggi per utenti e organizzazioni, fornendo informazioni essenziali sulle prestazioni, la disponibilità e la salute dei propri ambienti database. Ecco cinque principali benefici derivanti dall'utilizzo di questi strumenti:
- Migliore ottimizzazione delle prestazioni: Monitorando costantemente le metriche di prestazione del database, gli utenti possono individuare colli di bottiglia e inefficienze, permettendo di ottimizzare le prestazioni e migliorare la reattività del sistema.
- Maggiore affidabilità del sistema: Gli strumenti di monitoraggio dei database avvisano gli utenti in tempo reale su potenziali problemi o anomalie, consentendo una risoluzione proattiva e riducendo al minimo i tempi di inattività, assicurando così l'affidabilità dei sistemi critici.
- Aumento dell'efficienza operativa: Con funzionalità di monitoraggio e avviso automatico, le organizzazioni possono semplificare i processi operativi e allocare meglio le risorse, migliorando la produttività e riducendo i costi.
- Migliore utilizzo delle risorse: Monitorando le tendenze di utilizzo delle risorse, gli utenti possono prendere decisioni informate in termini di allocazione e pianificazione della capacità, assicurando un uso ottimale delle risorse hardware e software.
- Più sicurezza e conformità: Gli strumenti di monitoraggio dei database consentono agli utenti di monitorare accessi e attività, rilevare comportamenti non autorizzati o sospetti e garantire la conformità ai requisiti normativi, migliorando così la sicurezza dei dati e riducendo i rischi.
Incorporare strumenti di monitoraggio nei tuoi processi di gestione dei dati ti consente di raggiungere maggiore efficienza, affidabilità e successo aziendale complessivo.
Costi e prezzi
Orientarsi tra i numerosi piani e opzioni tariffarie per gli strumenti di monitoraggio dei database può essere scoraggiante per chi è nuovo del settore. Queste piattaforme presentano strutture di prezzo differenti, pensate per varie dimensioni e necessità aziendali. Familiarizzare con i costi medi e le tipologie di piani ti aiuta a fare una scelta d'acquisto informata.
Tabella di confronto dei piani per gli strumenti di monitoraggio dei database
Di seguito, riepilogo le varie soluzioni di piano con il relativo prezzo medio e le principali funzionalità, per aiutarti a prendere una decisione consapevole:
| Tipo di piano | Prezzo medio | Funzionalità comuni |
|---|---|---|
| Gratuito | $0 | Funzionalità di monitoraggio di base come monitoraggio in tempo reale, avvisi limitati e analisi delle prestazioni basilari. |
| Standard | $50-$200/month | Capacità di monitoraggio estese, dashboard personalizzabili, funzionalità di avviso e notifica, mantenimento storico dei dati. |
| Professional | $200-$500/month | Analisi avanzate delle prestazioni, funzioni di sicurezza potenziate, monitoraggio della scalabilità, backup e ripristino automatici. |
| Enterprise | $500+/month | Suite completa di strumenti di monitoraggio e osservabilità dei dati, supporto dedicato, integrazioni personalizzate, accesso prioritario a nuove funzionalità. |
Assicurati di valutare i requisiti specifici della tua organizzazione e i vincoli di budget quando scegli il piano più adatto. Considera se la piattaforma sarà in grado di crescere insieme alle esigenze in evoluzione della tua organizzazione.
Domande Frequenti sugli Strumenti di Monitoraggio Database
Ecco alcune altre domande frequenti sugli strumenti di monitoraggio dei database che potrebbero esserti utili:
Cosa possono dirmi gli strumenti di monitoraggio delle prestazioni del database sui miei database?
Quali sono le metriche di prestazione del database più importanti e come si monitorano?
Cosa fare dopo:
Se stai cercando strumenti di monitoraggio per database, collegati gratuitamente con un consulente SoftwareSelect e ricevi consigli personalizzati.
Compila un modulo e fai una breve chiacchierata in cui ti verranno chiesti i dettagli sulle tue esigenze. Riceverai quindi una selezione di software da valutare. Ti supporteranno persino durante l'intero processo d'acquisto, comprese le trattative sul prezzo.