10 Meilleurs Outils de Surveillance de Serveurs Passés en Revue en 2026

Liste restreinte des meilleurs outils de supervision de serveurs


Le meilleur logiciel de supervision de serveurs aide les équipes à détecter rapidement les problèmes de performance, à réduire les temps d’arrêt, à suivre l’utilisation des ressources, et à garantir la fiabilité des systèmes critiques. Ces outils offrent aux équipes IT et aux opérations la visibilité nécessaire pour comprendre le comportement des serveurs sous charge et réagir avant que les utilisateurs ne soient impactés.
Les équipes recherchent souvent des solutions de supervision de serveurs lorsque des erreurs de configuration provoquent des pannes, que des vérifications manuelles font passer des signaux d’alerte inaperçus, ou que des lacunes de sécurité s’installent sur des infrastructures clés. Ces problèmes entraînent des ralentissements, des dysfonctionnements inattendus et compliquent la coordination du dépannage dans des environnements complexes.
Fort de plus de 20 ans d’expérience en tant que Chief Technology Officer, j’ai testé et évalué des dizaines de logiciels de supervision de serveurs dans des environnements réels pour juger leur précision, leurs options d’intégration et leur facilité d’utilisation. Ce guide présente les meilleures plateformes de supervision qui améliorent la fiabilité du système, accélèrent la réponse aux incidents et aident les équipes à maintenir des performances prévisibles. Chaque avis détaille les fonctionnalités, les avantages et inconvénients, ainsi que les meilleurs cas d’usage pour vous aider à choisir le bon outil.
Pourquoi faire confiance à nos avis logiciels
Nous testons et évaluons les logiciels de développement SaaS depuis 2023. En tant qu’experts techniques, nous savons à quel point il est crucial et difficile de faire le bon choix lors de la sélection d’un logiciel. Nous investissons dans une recherche approfondie afin d’aider notre audience à prendre de meilleures décisions d’achat logiciel.
Nous avons testé plus de 2 000 outils pour différents cas d’utilisation en développement SaaS et rédigé plus de 1 000 tests logiciels approfondis. Découvrez comment nous restons transparents et consultez notre méthodologie d’évaluation logicielle.
Table of Contents
- Meilleure Sélection de Logiciels
- Pourquoi Nous Faire Confiance
- Comparer les Caractéristiques
- Avis
- Autres Outils de Surveillance de Serveurs
- Logiciels Associés
- Critères de Sélection
- Comment Choisir
- Tendances
- Qu'est-ce que la Surveillance de Serveurs ?
- Fonctionnalités
- Bénéfices
- Coûts et Tarification
- FAQs
Résumé des meilleurs outils de supervision de serveurs
Ce tableau comparatif résume les détails tarifaires de mes meilleurs choix d’outils de surveillance de serveurs pour vous aider à trouver celui qui convient à votre budget et à vos besoins professionnels.
| Tool | Best For | Trial Info | Price | ||
|---|---|---|---|---|---|
| 1 | Idéal pour la gestion des terminaux et la conformité des correctifs | Version d'essai gratuite + démo gratuite disponible | Tarification sur demande | Website | |
| 2 | Idéal pour la supervision des serveurs Windows sans agent | Essai gratuit de 14 jours disponible | Tarification sur demande | Website | |
| 3 | Idéal pour la surveillance de serveurs à grande échelle | Offre gratuite + essai gratuit de 30 jours disponible | À partir de 225 $/mois (facturé annuellement) | Website | |
| 4 | Idéal pour le suivi continu des serveurs | Démo gratuite disponible | À partir de $245/25 appareils | Website | |
| 5 | Idéal pour la surveillance en temps réel des serveurs | Essai gratuit de 30 jours | À partir de 179 $/mois (facturé annuellement) | Website | |
| 6 | Idéal pour le suivi approfondi des métriques serveurs | Démo gratuite + essai gratuit de 30 jours disponible | À partir de 9$/mois (facturé annuellement) | Website | |
| 7 | Idéal pour la performance applicative pilotée par l'IA | Essai gratuit de 15 jours | À partir de $7/mois | Website | |
| 8 | Idéal pour le traçage distribué et le débogage des erreurs | Offre gratuite + démo gratuite disponible | À partir de 26 $ par mois (facturé annuellement) | Website | |
| 9 | Idéal pour la surveillance d'infrastructures à l'échelle du cloud | Essai gratuit de 14 jours + offre gratuite disponible | À partir de $15/hôte/mois (facturation annuelle) | Website | |
| 10 | Idéal pour la surveillance complète d'une infrastructure informatique | Version gratuite et démonstration gratuite disponibles | À partir de $2,595 (licence perpétuelle pour 100 nœuds) | Website |

-

TestDevLab
Visit Website -
Site24x7
Visit WebsiteThis is an aggregated rating for this tool including ratings from Crozdesk users and ratings from other sites.4.7 -
GitHub Actions
Visit WebsiteThis is an aggregated rating for this tool including ratings from Crozdesk users and ratings from other sites.4.8


Avis sur les meilleurs outils de supervision de serveurs
Voici mes résumés détaillés des meilleurs outils de supervision de serveurs faisant partie de ma sélection. Mes analyses offrent une vue approfondie des fonctionnalités clés, des avantages et inconvénients, des intégrations et des cas d’utilisation idéaux pour chacun afin de vous aider à trouver l’outil qui vous correspond.
NinjaOne
Idéal pour la gestion des terminaux et la conformité des correctifs
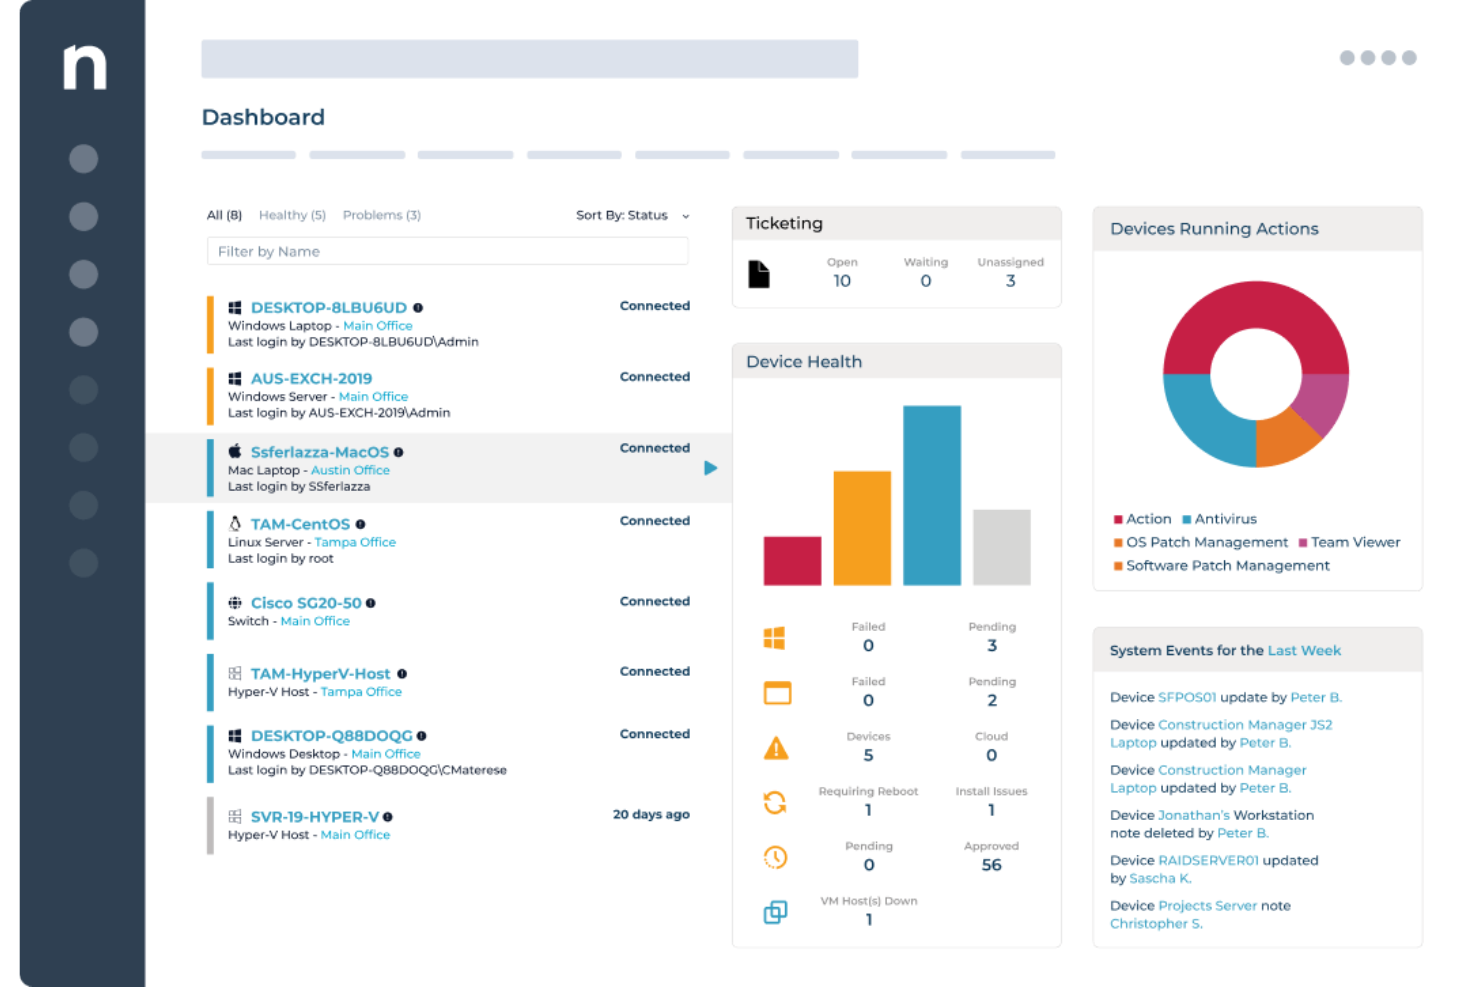
NinjaOne est un outil de surveillance de serveurs conçu principalement pour les professionnels de l'informatique et les fournisseurs de services gérés. Il excelle dans la gestion à distance, permettant aux équipes de surveiller et de gérer les terminaux depuis n'importe où.
Pourquoi j'ai choisi NinjaOne : Il est spécialement conçu pour la gestion à distance, offrant des fonctionnalités telles que le contrôle à distance et la gestion des correctifs qui permettent à votre équipe de gérer les problèmes sans être sur site. L'outil fournit une surveillance en temps réel, garantissant que vous êtes toujours au courant de l'état de vos systèmes. Des alertes automatiques vous informent des éventuels problèmes, vous permettant d'agir rapidement. L'interface conviviale de NinjaOne simplifie le processus, rendant la gestion à distance plus efficace.
Fonctionnalités et intégrations remarquables :
Les fonctionnalités comprennent la gestion automatisée des correctifs pour maintenir la sécurité des systèmes, un suivi détaillé des inventaires pour une meilleure gestion des actifs, et des alertes personnalisables pour tenir votre équipe informée.
Les intégrations incluent ConnectWise, Autotask, QuickBooks, Freshdesk, Zendesk, Microsoft 365, Google Workspace, Cisco Meraki, TeamViewer et Splashtop.
Pros and Cons
Pros:
- Documentation API complète
- Rapports flexibles avec métriques personnalisées
- Découverte automatisée des terminaux
Cons:
- Retards occasionnels dans le déploiement des correctifs
- Complexité dans la configuration des alertes pour les événements non standards
New Product Updates from NinjaOne
NinjaOne Adds Windows Agent Deployment to Network Discovery
NinjaOne adds Windows agent deployment directly from Network Discovery. This update helps IT teams move from discovering unmanaged Windows devices to monitoring, patching, and managing them faster. For more information, visit NinjaOne’s official site.
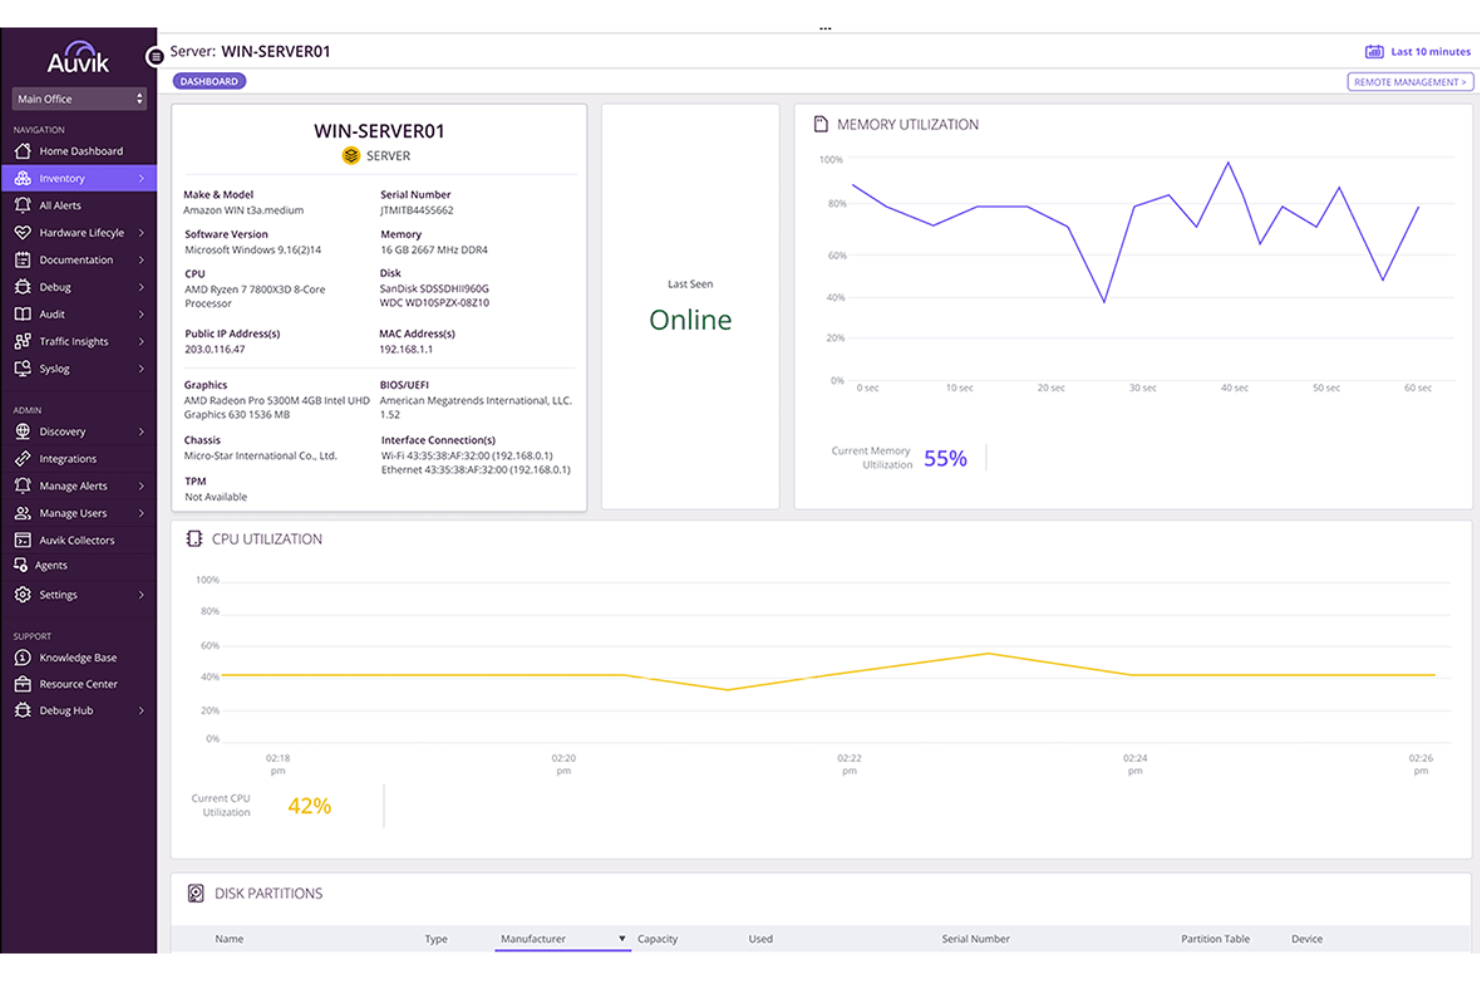
Auvik est conçu pour les équipes informatiques et les MSP qui ont besoin d'une visibilité fiable et sans effort sur les serveurs Windows, sans déployer d'agents ni gérer des installations complexes. Il cartographie automatiquement votre environnement, surveille la santé des serveurs en temps réel et vous alerte avant que des problèmes de performance ne perturbent les utilisateurs.
Pourquoi j'ai choisi Auvik
J'ai choisi Auvik car sa découverte et surveillance sans agent vous permet de commencer à suivre la santé des serveurs Windows immédiatement, sans devoir intervenir sur chaque machine. Vous évitez les interruptions grâce à des alertes en temps réel basées sur les seuils du CPU, de la mémoire et des services, donnant à votre équipe le temps de réagir avant toute perte de performance. La planification de la capacité devient plus facile grâce aux données de tendance et aux bases historiques, qui aident à détecter les premiers signes d'une tension sur les ressources. Vous améliorez également le dépannage grâce au contexte réseau et serveur sur une carte topologique unifiée, ce qui permet d’identifier plus rapidement la cause racine. Et comme Auvik gère les sauvegardes et la restauration de la configuration, votre équipe bénéficie d'une sécurité supplémentaire contre les mauvaises configurations ou les mises à jour échouées.
Fonctionnalités clés d'Auvik
Reposant sur ses atouts en surveillance temps réel, ces fonctionnalités aident les équipes à maintenir des environnements serveurs stables.
- Gestion d'inventaire : Collecte automatiquement des informations détaillées sur les serveurs et appareils pour l'audit.
- Analyse du trafic réseau : Affiche quelles applications et terminaux consomment les ressources.
- Visualisation de la topologie : Cartographie les relations entre appareils pour accélérer le dépannage.
- Suivi de l'utilisation de la bande passante : Met en évidence les pics et tendances d'utilisation affectant les performances des serveurs.
Intégrations Auvik
Les intégrations comprennent ConnectWise, Kaseya, N-able, Cisco, Juniper, Meraki, HPE et Palo Alto Networks.
Pros and Cons
Pros:
- Les sauvegardes de configuration automatisées protègent contre les changements inopportuns
- Les alertes en temps réel permettent aux équipes de réagir avant toute dégradation des performances
- La surveillance sans agent permet une mise en service rapide des serveurs Windows
Cons:
- Les fonctionnalités avancées peuvent nécessiter une configuration et des réglages additionnels
- Support limité pour Linux et autres serveurs non-Windows
New Product Updates from Auvik
Auvik Launches Aurora AI Assistance
Auvik adds Aurora AI assistance to help teams prioritize issues, troubleshoot problems, and take action using network context. This update brings AI-powered support directly into Auvik workflows. For more information, visit Auvik’s official site.
 .
.
Checkmk est un outil de surveillance de serveurs conçu pour les administrateurs et professionnels IT cherchant des métriques en temps réel. Il suit efficacement divers éléments de l'infrastructure afin de garantir des performances optimales et une résolution rapide des problèmes.
Pourquoi j'ai choisi Checkmk : Il est idéal pour ceux qui ont besoin de mesures en temps réel, offrant des tableaux de bord complets qui se mettent à jour en quelques secondes. L’outil fournit des options puissantes de visualisation, aidant votre équipe à repérer immédiatement les problèmes. Il propose également un système d’alertes flexible, qui permet de personnaliser les notifications selon vos besoins. Les vastes capacités de surveillance de Checkmk couvrent aussi bien les serveurs que les applications, en faisant une option très polyvalente.
Fonctionnalités principales & intégrations :
Fonctionnalités comprennent la découverte automatisée des appareils réseau, des tableaux de bord personnalisables pour des vues adaptées et un système d’alertes performant pour tenir votre équipe informée des problèmes critiques.
Intégrations comprennent AWS, Azure, Docker, Kubernetes, VMware, Cisco, Dell, HP, Microsoft et SAP.
Pros and Cons
Pros:
- Surveillance évolutive
- Tableaux de bord personnalisables
- API REST pour intégration avec des outils tiers
Cons:
- Configuration complexe
- Courbe d'apprentissage potentielle pour les débutants
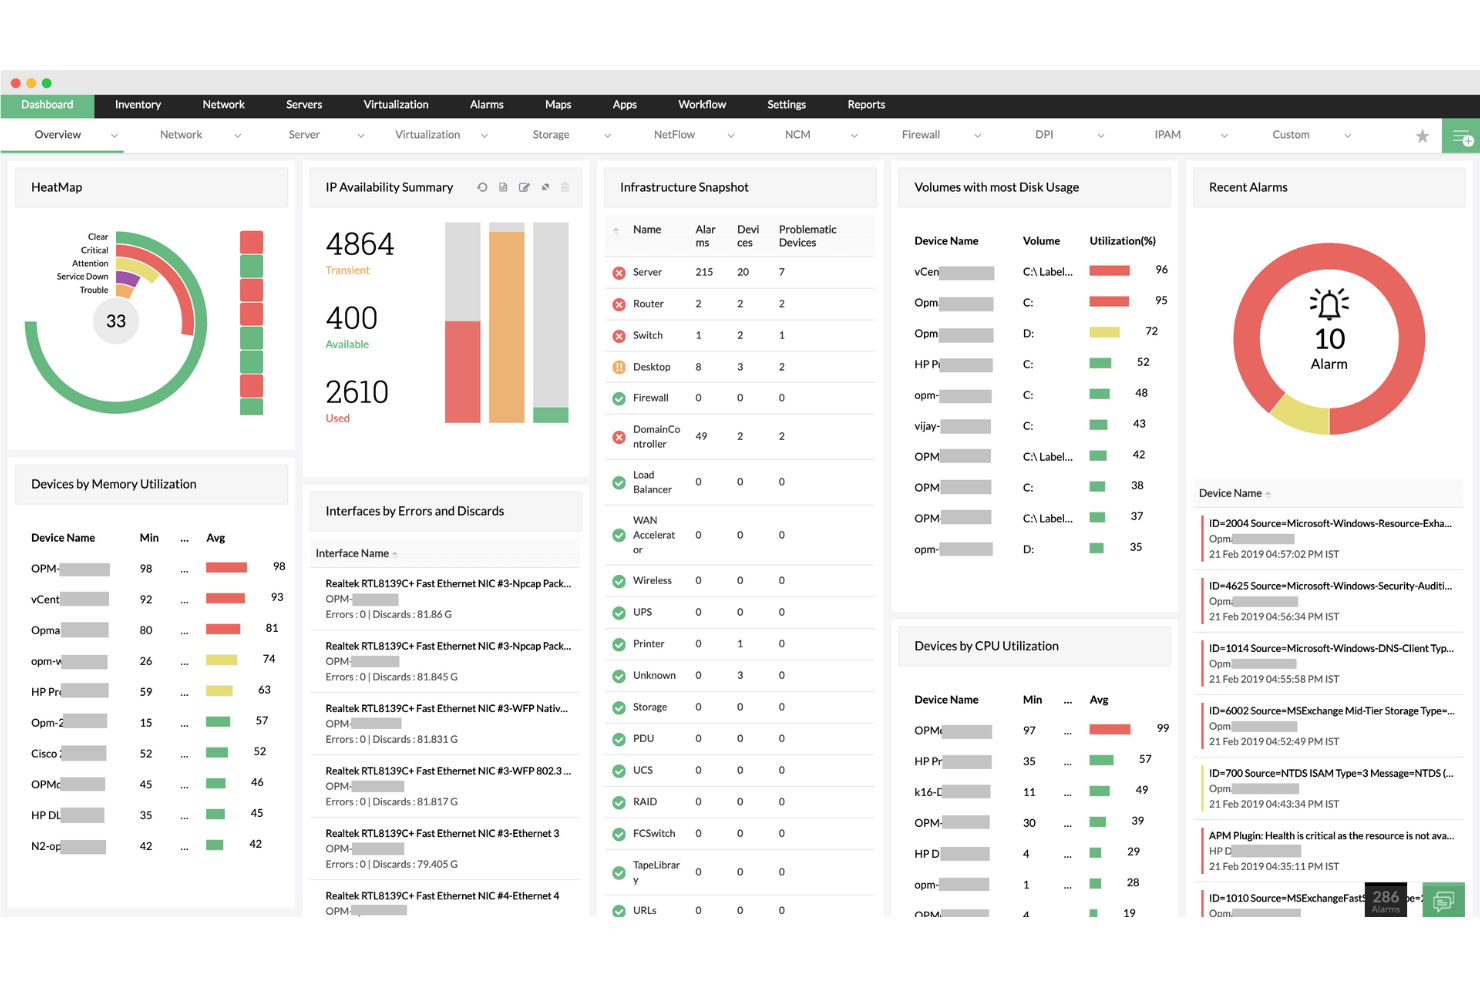
ManageEngine OpManager est un outil de surveillance des serveurs qui vous aide à suivre vos appareils réseau et vos serveurs grâce à une surveillance, des alertes et des rapports en temps réel afin de résoudre les problèmes potentiels avant qu'ils n'impactent votre entreprise. Cameron Rimington, fondateur et PDG d’IronPDF, a noté : « Grâce à la cartographie du réseau, nous pouvons voir comment les données circulent à travers nos serveurs et nos piles. Cela a immédiatement permis de localiser l’endroit où les requêtes étaient bloquées, nous aidant à diagnostiquer des ralentissements intermittents sans tâtonner. »
Pourquoi ai-je choisi ManageEngine OpManager : OpManager assure un suivi continu des performances, de la disponibilité et de l’état de santé des serveurs, garantissant leur bon fonctionnement grâce à des sondages constants utilisant des protocoles tels qu’ICMP, SNMP, WMI et TCP. Cette surveillance en temps réel vous aide à répondre rapidement aux requêtes d’E/S et à maintenir une connectivité fluide pour les utilisateurs finaux. De plus, OpManager suit la perte de paquets et le temps de réponse afin d’identifier et de résoudre les problèmes de latence provenant du serveur.
Fonctionnalités et intégrations remarquables :
Les fonctionnalités incluent la surveillance de la disponibilité des serveurs, la gestion des services et des processus, des tableaux de bord personnalisables, les alertes en temps réel, la surveillance des journaux de sécurité, le paramétrage de seuils de performance, des workflows automatisés, le diagnostic à distance des processus, le suivi de la perte de paquets, la surveillance du temps de réponse, la surveillance de la haute disponibilité, ainsi que la prise en charge des services personnalisés.
Les intégrations comprennent ServiceDesk Plus, ServiceNow, Jira, Slack, Microsoft Teams, Analytics Plus, AlarmsOne, des intégrations REST API et Webhook.
Pros and Cons
Pros:
- Capacités de surveillance complètes
- Alertes en temps réel
- Scalabilité pour les réseaux en expansion
Cons:
- Configuration initiale complexe
- Problèmes de mise à jour occasionnels
New Product Updates from ManageEngine OpManager
ManageEngine OpManager Vendor Templates and NCM XML Import
ManageEngine OpManager introduces enhanced vendor template integration and device template import for the NCM module using XML files. This update helps teams improve device classification and speed up configuration workflows. For more information, visit ManageEngine OpManager’s official site.
 .
.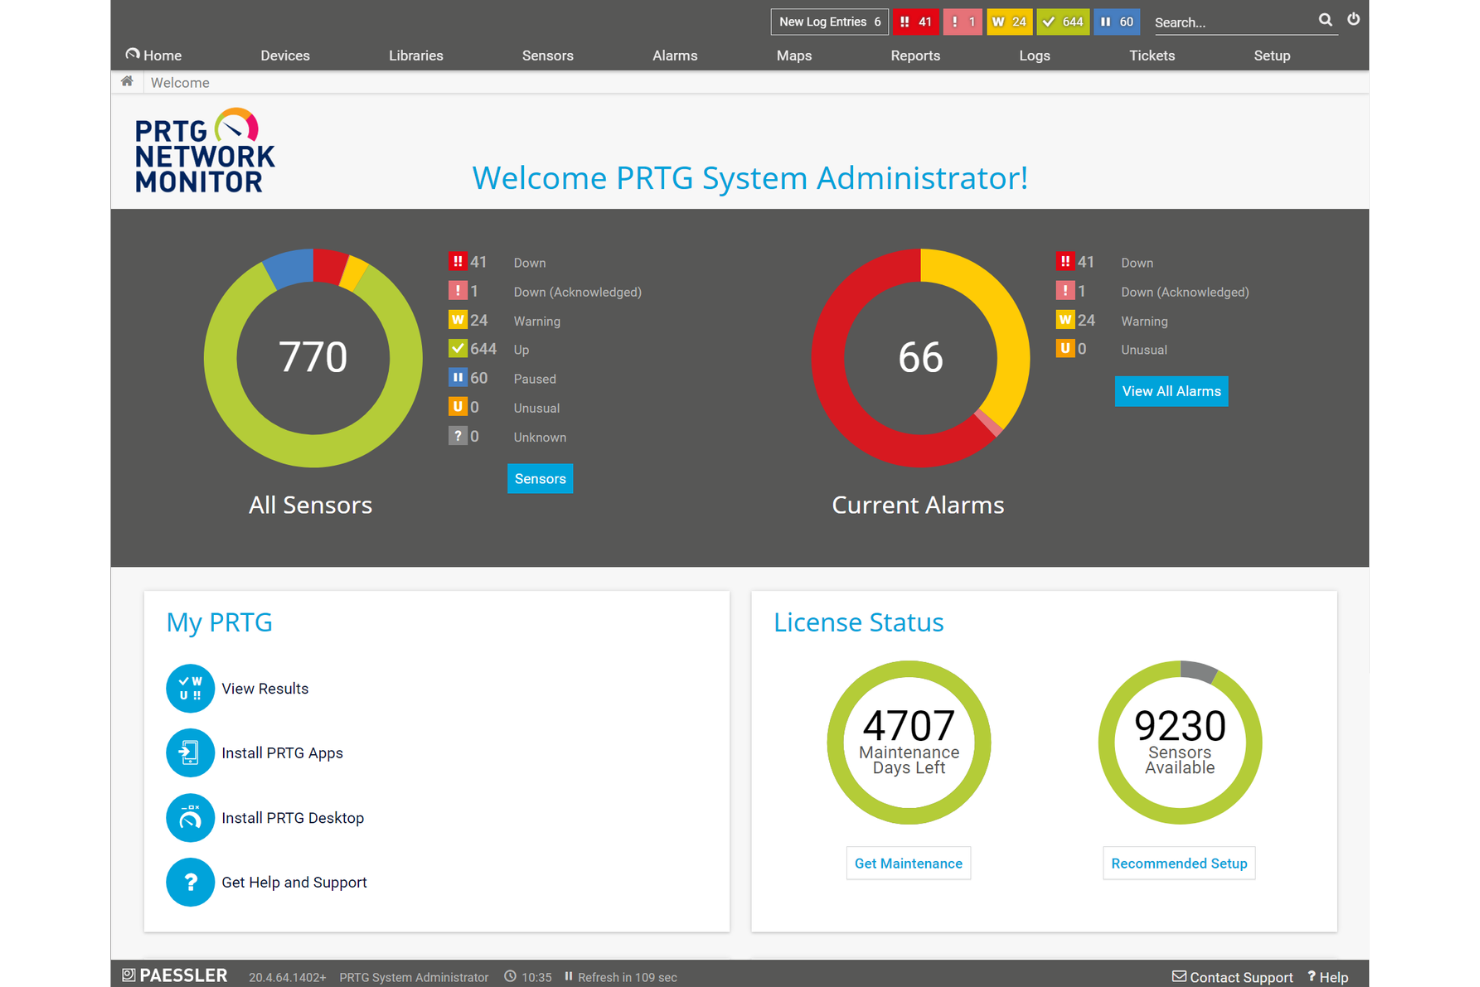
PRTG est un outil polyvalent de surveillance de serveurs conçu pour les réseaux de petite à moyenne taille. Il aide les équipes informatiques à surveiller l'ensemble de leur infrastructure, y compris les serveurs de messagerie, web, base de données, fichiers, virtuels et cloud.
Pourquoi j'ai choisi PRTG : Cet outil est idéal pour les réseaux de petite à moyenne taille grâce à son adaptabilité et sa facilité d'utilisation. Avec plus de 250 types de capteurs préconfigurés, votre équipe peut commencer la surveillance en temps réel immédiatement. Les alertes par e-mail et SMS vous tiennent informé(e) de tout problème, permettant une résolution rapide. PRTG offre également une adaptation dynamique aux environnements de serveurs, ce qui est parfait pour les réseaux en croissance ou en évolution.
Fonctionnalités marquantes & intégrations :
Fonctionnalités : alertes en temps réel pour vous informer, rapports personnalisables pour des analyses détaillées et adaptation dynamique à l’évolution des environnements serveurs.
Intégrations : AWS, Azure, VMware, Citrix XenServer, HPE ProLiant, Dell PowerEdge, Cisco UCS et divers partenaires informatiques.
Pros and Cons
Pros:
- Évolutif pour de nombreux types de réseaux
- Surveillance et alertes personnalisables
- Interface visuelle intuitive
Cons:
- Coûts élevés pour les déploiements importants
- Les fonctionnalités plus avancées peuvent nécessiter un temps d'apprentissage
New Product Updates from PRTG
PRTG Introduces New Monitoring Sensors In Beta
This week, PRTG introduces three BETA sensors that broaden your monitoring scope for Proxmox VE clusters and SIMATIC S7-300/400 PLCs, giving you deeper operational insights. For more information, visit PRTG’s official site.
 .
.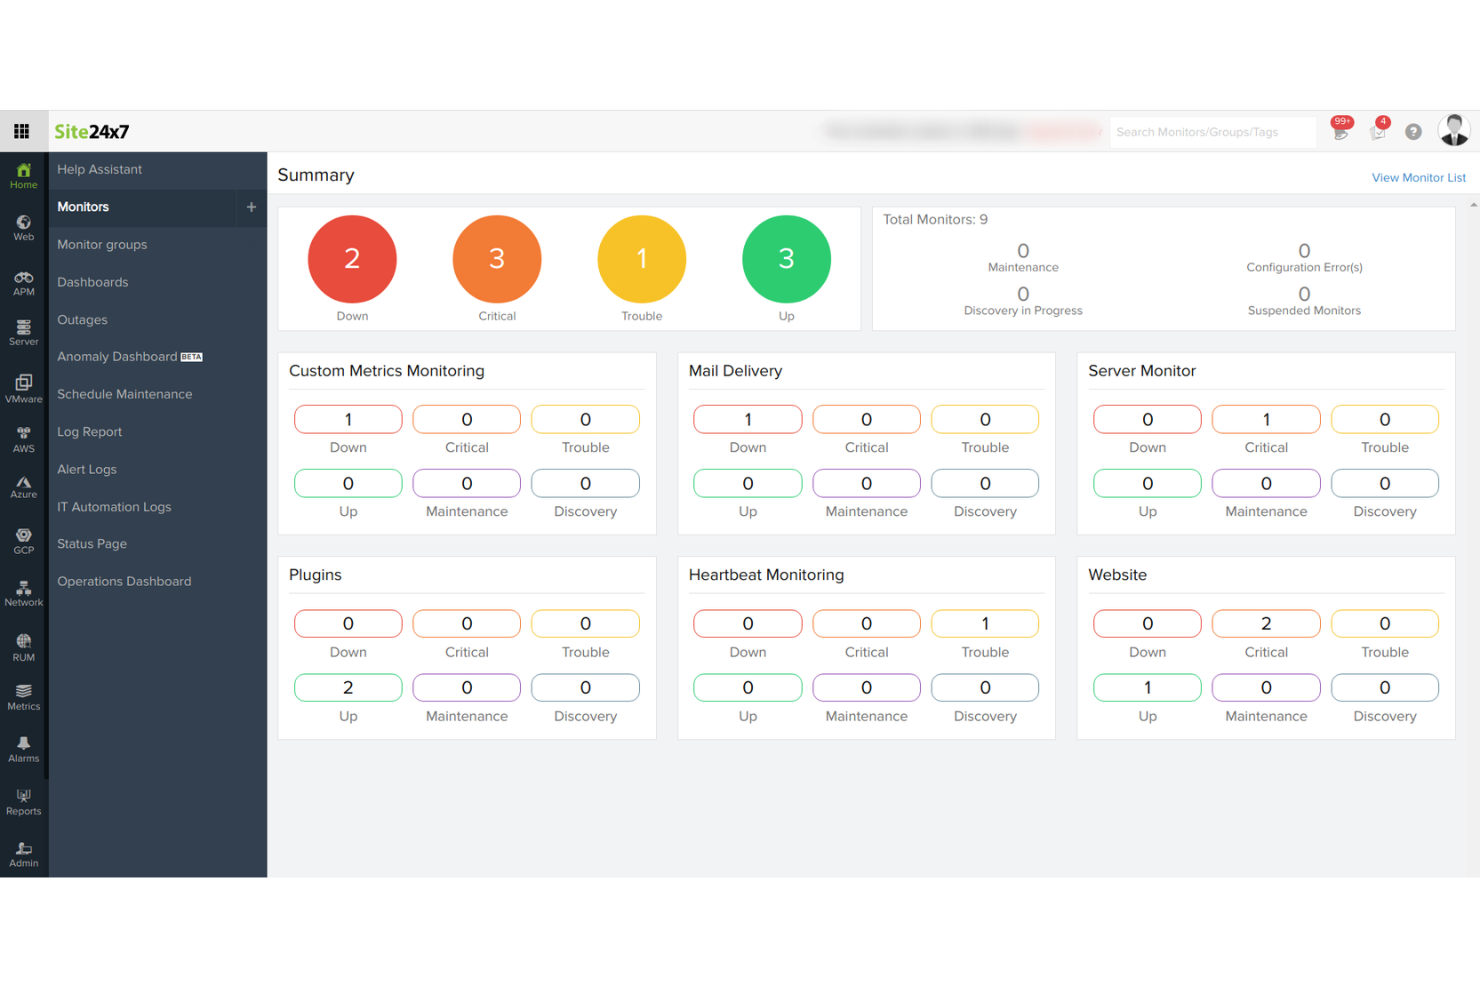
Site24x7 est un outil de surveillance de serveurs basé sur le cloud, destiné aux équipes informatiques et DevOps. Il offre une surveillance complète des sites web, des serveurs, des applications et de l'infrastructure réseau afin d'assurer des performances et une disponibilité optimales.
Pourquoi j'ai choisi Site24x7 : Il est idéal pour la surveillance dans le cloud, proposant des fonctionnalités telles que le suivi des performances en temps réel et des analyses détaillées qui aident votre équipe à maintenir la disponibilité. La fourniture cloud permet d'y accéder partout, ce qui est parfait pour les équipes distribuées. Les alertes automatisées vous informent de tout problème potentiel, assurant une réaction rapide. Site24x7 propose également la surveillance synthétique, qui permet de simuler les interactions des utilisateurs pour détecter les problèmes avant qu'ils n'impactent de vrais utilisateurs.
Fonctionnalités principales & intégrations :
Fonctionnalités : surveillance synthétique pour simuler les interactions des utilisateurs, analyses détaillées pour des informations sur les performances et suivi des performances en temps réel pour détecter rapidement les problèmes.
Intégrations : AWS, Azure, Google Cloud, Docker, Kubernetes, VMware, Slack, Microsoft Teams, PagerDuty et ServiceNow.
Pros and Cons
Pros:
- Capacités de surveillance complètes
- Alertes et notifications en temps réel
- Tableaux de bord et rapports personnalisables
Cons:
- Complexité lors de la configuration initiale pour de grands environnements
- Personnalisation limitée des mécanismes d'alerte
New Product Updates from Site24x7
Site24x7 Adds Synchronization Statuses for MSPs
Site24x7 now provides MSPs enhanced alerts and synchronization statuses in a centralized notification center to spot configuration sync issues sooner and accelerate incident response. For more information, visit Site24x7's official site.

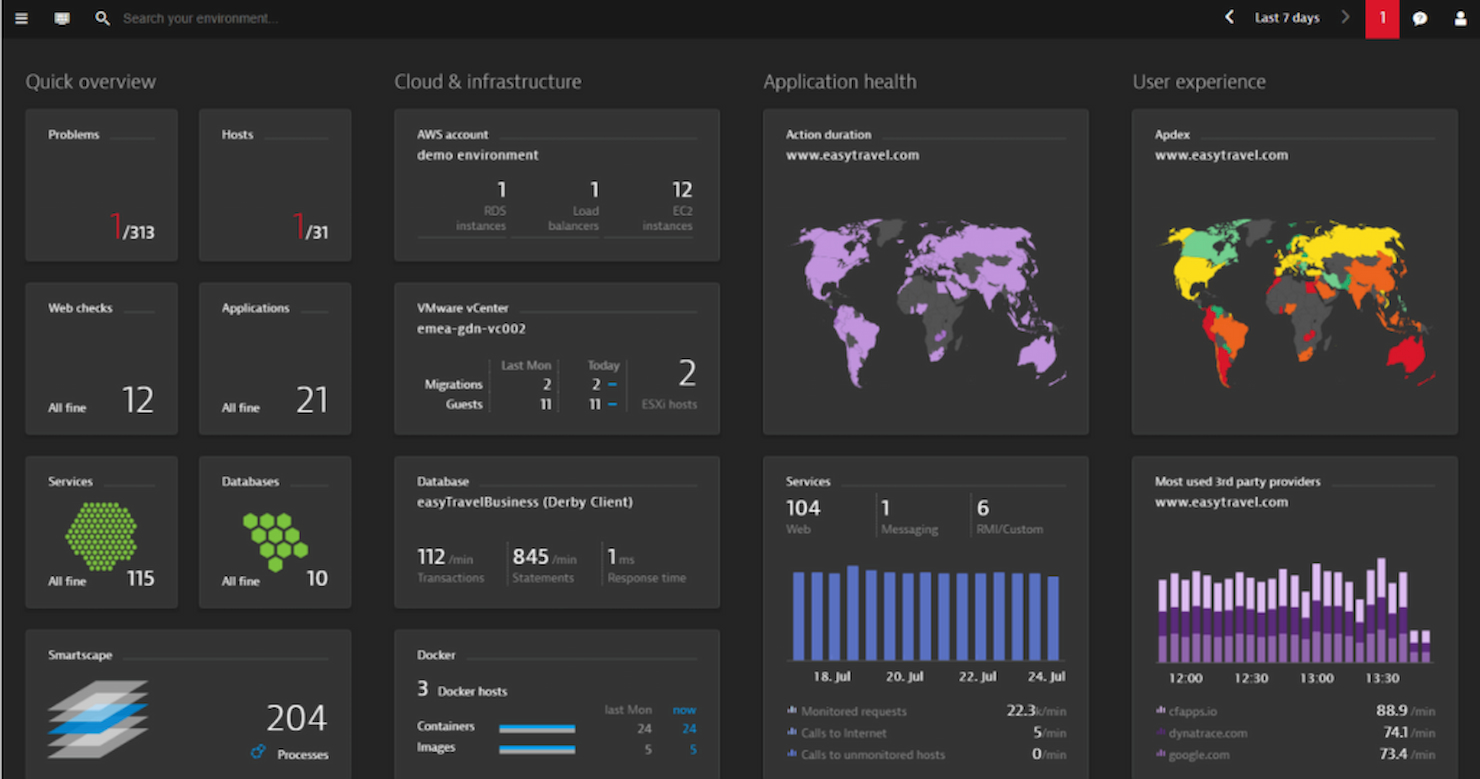
Dynatrace est un outil de surveillance des serveurs destiné aux équipes informatiques d'entreprise et aux professionnels DevOps. Il offre une visibilité de bout en bout sur les applications et l'infrastructure, aidant les entreprises à maintenir des performances optimales.
Pourquoi j'ai choisi Dynatrace : Il se distingue par ses analyses pilotées par l'IA, proposant une analyse automatique des causes profondes qui permet à votre équipe de résoudre rapidement les problèmes. Les capacités d'IA de l'outil permettent une détection précise des anomalies, garantissant de repérer les problèmes potentiels tôt. Grâce à sa surveillance complète du full-stack, vous pouvez superviser les applications, l'infrastructure et l'expérience utilisateur au même endroit. Dynatrace propose également une analyse des données en temps réel, facilitant la prise de décisions éclairées rapidement.
Fonctionnalités marquantes & intégrations :
Fonctionnalités : analyse automatique des causes profondes pour une résolution rapide des problèmes, détection précise des anomalies pour repérer les problèmes tôt, et surveillance complète du full-stack pour une visibilité totale.
Intégrations : AWS, Azure, Google Cloud, VMware, Kubernetes, Red Hat OpenShift, SAP, ServiceNow, Microsoft Teams et Slack.
Pros and Cons
Pros:
- Analyses approfondies pilotées par l'IA
- Surveillance applicative complète
- Large éventail d'intégrations
Cons:
- La complexité nécessite une formation dédiée
- La configuration peut être complexe pour les débutants
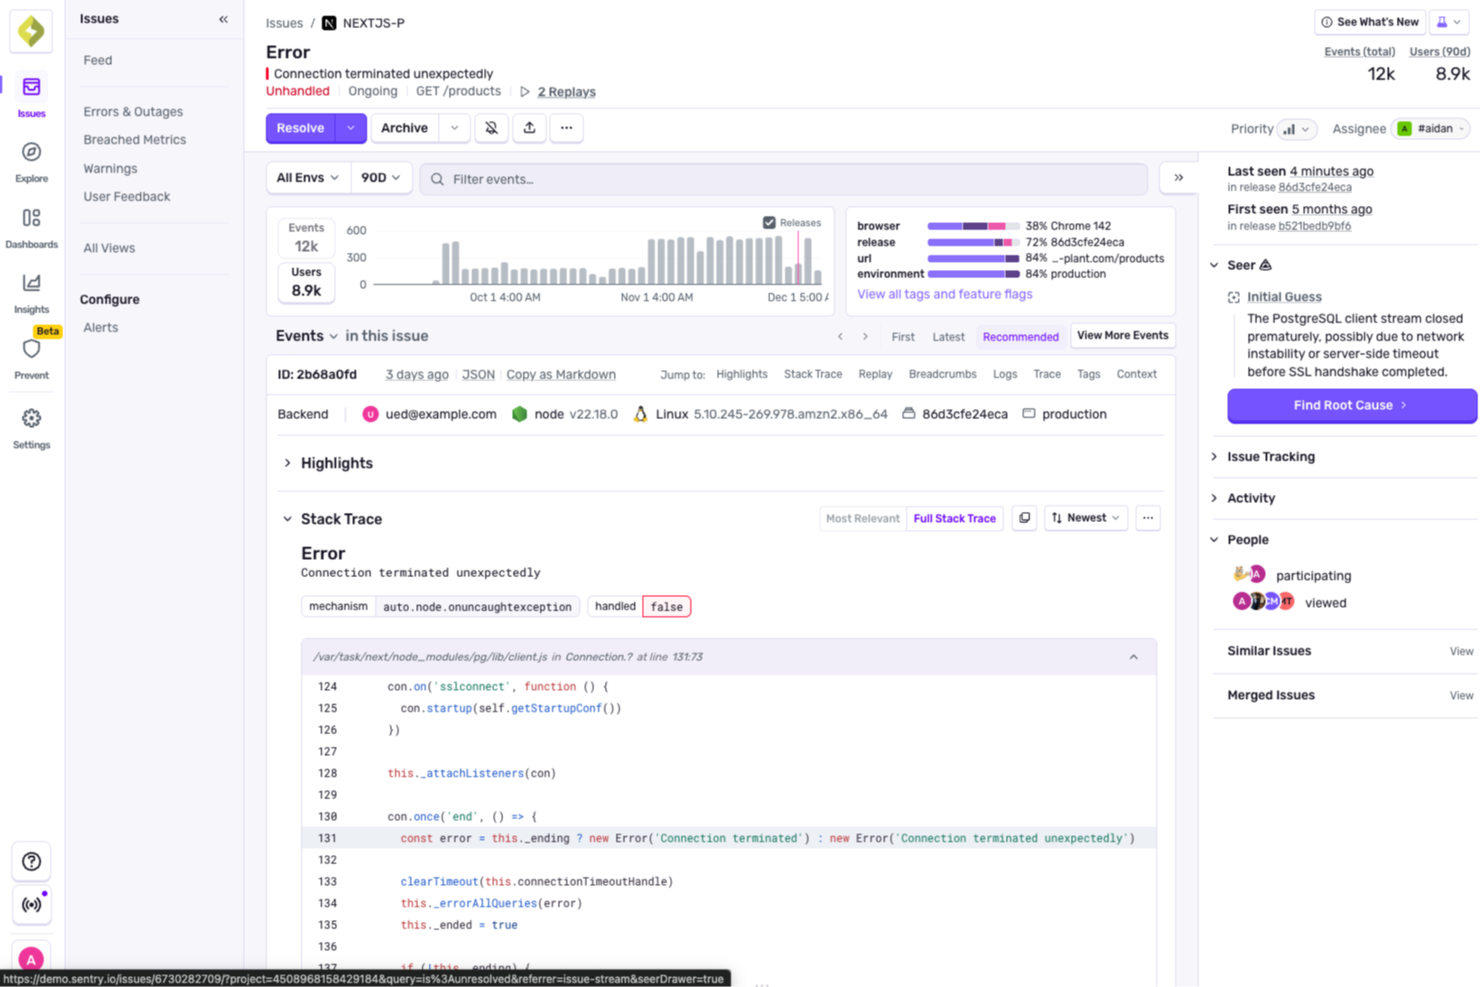
Dans un monde où la performance des serveurs est essentielle pour garantir le bon déroulement des opérations, Sentry soutient les équipes grâce au traçage distribué et au débogage des erreurs, en plus de ses fonctionnalités principales de surveillance. Conçu pour répondre aux besoins du développement web et mobile, du jeu vidéo et du commerce électronique, Sentry relève les défis liés au suivi de la santé et des performances des serveurs. En proposant des outils comme le suivi des erreurs, la relecture de sessions et la surveillance de la disponibilité, il aide les équipes à détecter et corriger les problèmes plus rapidement, assurant ainsi la stabilité et la fiabilité des applications.
Pourquoi j'ai choisi Sentry
J'ai choisi Sentry pour son traçage distribué et son débogage des erreurs, qui aident les équipes à suivre les problèmes de serveurs sur l'ensemble des services et à trouver plus rapidement les causes profondes. Son suivi des erreurs met en évidence les problèmes en temps réel, facilitant ainsi la résolution des incidents avant qu'ils n'aient un impact sur les utilisateurs. La relecture des sessions montre ce qui s'est passé lors des interactions avec les utilisateurs, tandis que la surveillance de la disponibilité alerte lorsque des services sont indisponibles afin que les équipes puissent réagir rapidement.
Fonctionnalités clés de Sentry
En plus du traçage distribué et du débogage des erreurs, Sentry propose :
- Analyse automatique des causes profondes : En associant les incidents aux versions et aux modifications du code, Sentry vous aide à identifier rapidement les causes sous-jacentes des problèmes de performance.
- Intégration dans les workflows de développement : S'intègre facilement aux plateformes populaires telles que GitHub et Slack, ce qui facilite la communication et la collaboration efficaces.
- Sécurité et conformité : Conforme aux standards du secteur pour protéger les données des utilisateurs, garantissant des applications à la fois sécurisées et conformes.
Intégrations Sentry
Les intégrations incluent GitHub, Slack, Jira, Bitbucket, GitLab, Trello, PagerDuty, Microsoft Teams, AWS Lambda et Datadog.
Pros and Cons
Pros:
- Observabilité efficace côté frontend grâce à la relecture de session
- Surveillance complète, y compris performance et rapports de crash
- Suivi des erreurs performant avec suivi des exceptions par utilisateur
Cons:
- Mise en œuvre complexe, en particulier pour des piles de plateformes variées
- Couverture réduite pour la surveillance au niveau de l'infrastructure
New Product Updates from Sentry

Sentry Snapshots Enters Open Beta for CI Screenshot Diffing
Sentry Snapshots is now in Open Beta, bringing CI screenshot diffing to help teams catch unintended visual changes across any frontend platform. For more information, visit Sentry's official site.
 .
.Datadog
Idéal pour la surveillance d'infrastructures à l'échelle du cloud
Datadog est une plateforme de surveillance et d'analyse basée sur le cloud, conçue pour les équipes IT et DevOps. Elle fournit une surveillance complète des serveurs, bases de données, outils et services afin de garantir le bon fonctionnement de vos systèmes.
Pourquoi j'ai choisi Datadog : Elle est conçue pour la surveillance à l'échelle du cloud, offrant une visibilité en temps réel sur la performance de votre infrastructure. Les tableaux de bord de l'outil sont personnalisables, vous permettant de vous concentrer sur les indicateurs les plus importants pour votre équipe. Les alertes automatisées vous aident à anticiper les problèmes et à garantir des réponses rapides. La scalabilité de Datadog en fait un excellent choix pour les entreprises en croissance devant surveiller des infrastructures en expansion.
Fonctionnalités et intégrations remarquables :
Fonctionnalités : visibilité en temps réel pour maintenir l'efficacité de vos systèmes, tableaux de bord personnalisables pour des analyses ciblées, et alertes automatisées pour vous aider à réagir rapidement aux incidents.
Intégrations : AWS, Azure, Google Cloud, Kubernetes, Docker, Slack, PagerDuty, Microsoft Teams, GitHub et Jira.
Pros and Cons
Pros:
- Adapté aux environnements cloud
- Surveillance et alertes complètes
- Large liste d'intégrations
Cons:
- Courbe d'apprentissage pour les fonctionnalités avancées
- Coûts supplémentaires pour des fonctionnalités avancées
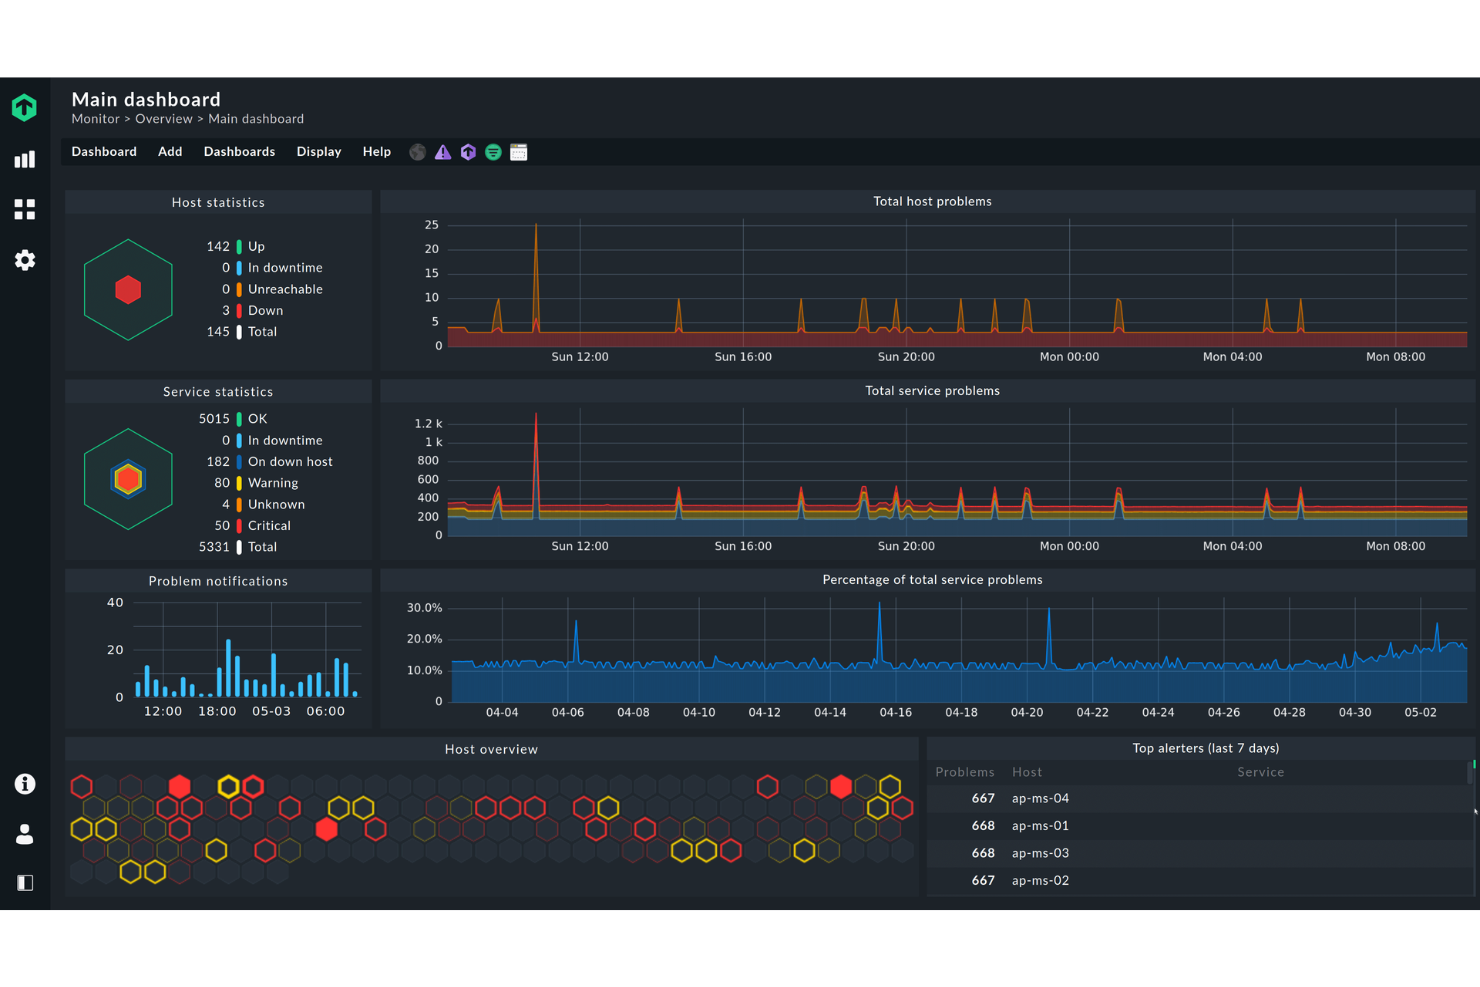
Nagios
Idéal pour la surveillance complète d'une infrastructure informatique
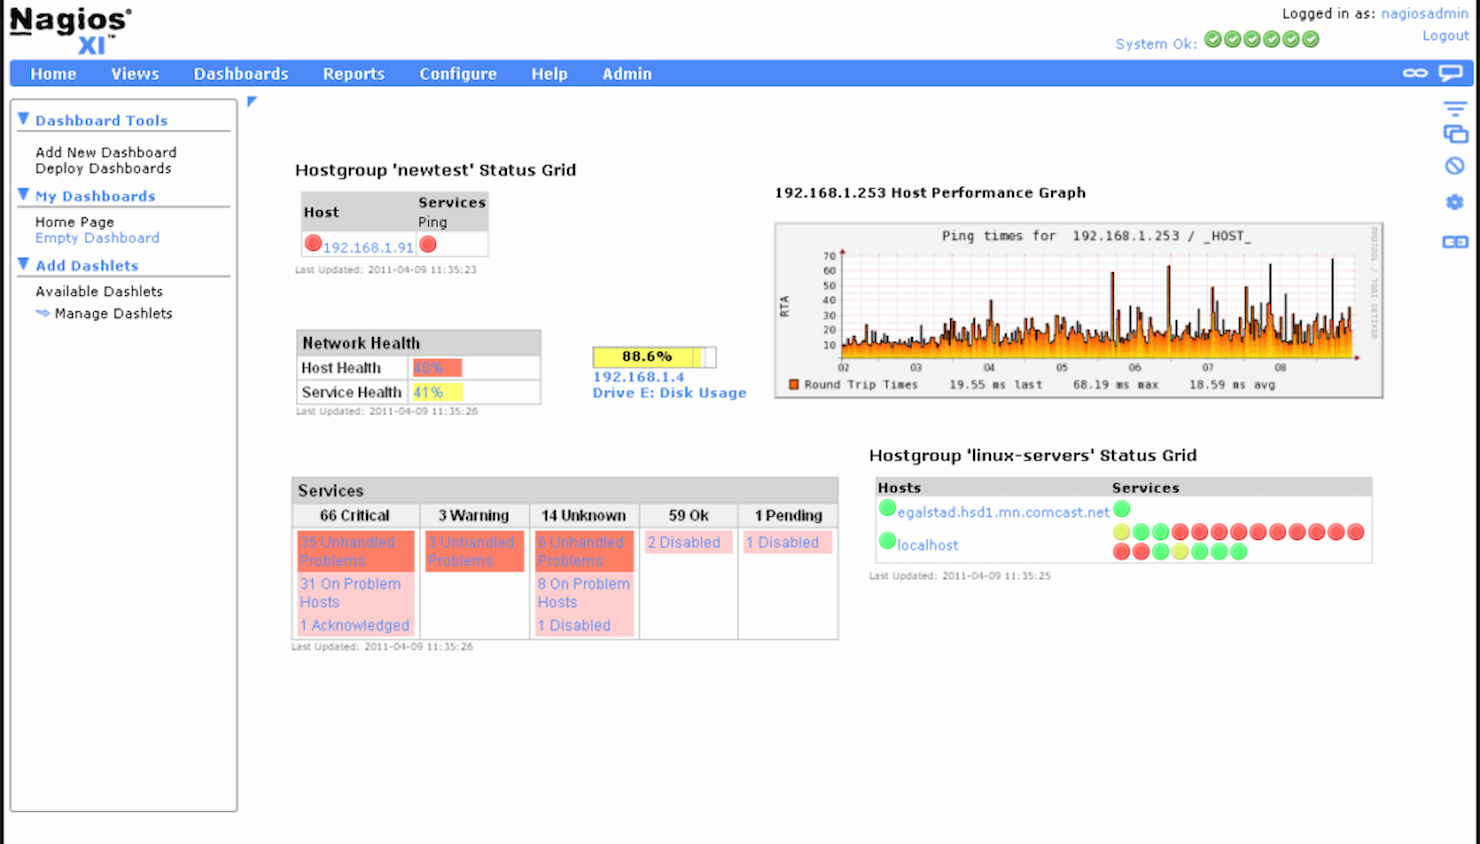
Nagios est un outil open-source de surveillance de serveurs destiné aux professionnels de l'informatique et aux administrateurs systèmes. Il offre une surveillance complète des composants d'infrastructure, garantissant que les systèmes, applications et services fonctionnent sans encombre.
Pourquoi j'ai choisi Nagios : Il propose la flexibilité de l'open source, permettant à votre équipe d'adapter l'outil à vos besoins spécifiques. Sa vaste bibliothèque de plugins permet la personnalisation, afin de pouvoir surveiller presque tout. Grâce à ses capacités d'alerte, votre équipe reste informée des problèmes potentiels. L'évolutivité de Nagios le rend adapté aussi bien aux petits qu'aux grands environnements, offrant une solution polyvalente pour des architectures informatiques variées.
Fonctionnalités et intégrations remarquables :
Fonctionnalités : système d'alertes robuste pour garder votre équipe informée, large support de plugins pour la personnalisation, et une grande évolutivité pour accompagner les environnements IT en croissance.
Intégrations : AWS, Azure, Google Cloud, VMware, Docker, Kubernetes, Slack, PagerDuty, ServiceNow et Microsoft Teams.
Pros and Cons
Pros:
- Capacités de surveillance étendues
- Tableaux de bord personnalisables
- Solides intégrations tierces
Cons:
- Le modèle de licence annuelle ne convient pas à toutes les entreprises
- L'interface peut sembler vieillotte face aux plateformes récentes
Autres outils de supervision de serveurs
Voici quelques options supplémentaires d’outils de surveillance de serveurs qui ne figurent pas dans ma sélection principale mais qui méritent tout de même votre attention :
- LogicMonitor
Idéal pour la surveillance d'infrastructures hybrides
- AppDynamics
Idéal pour le suivi des transactions métier de bout en bout
- New Relic
Idéal pour l’analytique en temps réel des applications
- Icinga
Meilleure solution open source
- Dotcom Monitor
Idéal pour simuler de vraies interactions utilisateur
- Sumo Logic
Idéal pour la gestion et l'analyse des journaux
- Atera
Idéal pour une solution intégrée de RMM et PSA
- Zabbix
Idéal pour la scalabilité dans les grands réseaux
- WhatsUp Gold
Idéal pour la surveillance et la visualisation des réseaux
- Netdata
Idéal pour le dépannage des performances en temps réel
- Prometheus
Idéal pour les capacités puissantes du langage de requête
- Sensu
Idéal pour une surveillance flexible via des plugins
- ManageEngine
Idéal pour la gestion IT intégrée


Autres avis sur les logiciels IT
Si vous ne trouvez pas ce que vous cherchez ici, consultez ces outils alternatifs que nous avons testés et évalués.
- Logiciel de supervision réseau
- Logiciel de surveillance de serveurs
- Solutions SD-WAN
- Outils de supervision d’infrastructure
- Analyseur de paquets
- Outils de surveillance applicative
Comment j’évalue les outils de surveillance de serveurs
Les outils de surveillance de serveurs sont ce qui permet à un administrateur système d’anticiper un pic de CPU à 3h du matin, aide une équipe NOC à trier les pannes en cascade sur des centaines de nœuds, et fournit aux SREs la télémétrie nécessaire pour tenir les engagements de SLA. Lorsque j’évalue les outils de ce secteur, je distingue ce que chaque candidat doit impérativement réussir pour figurer sur la liste de ce qui fait réellement la différence entre chaque solution selon les environnements et les équipes.
Fonctionnalités essentielles (les incontournables pour cette liste)
Pour les outils de surveillance de serveurs, les fonctionnalités principales que je teste et évalue sont :
- Métriques en temps réel : Je vérifie si l’outil suit le CPU, la mémoire, l’I/O disque et le débit réseau avec une granularité jusqu’au niveau du processus sur Linux et Windows.
- Moteur d’alerte : Les alertes basées sur les seuils sont un minimum. J’évalue les politiques d’escalade, la suppression des oscillations et la diffusion multicanal vers Slack, PagerDuty ou email.
- Compatibilité multi-OS : Les environnements sont rarement homogènes. Je recherche une prise en charge native de Windows Server, des principales distributions Linux et idéalement des variantes UNIX.
- Découverte automatique : Ajouter manuellement 200 serveurs est exclu. Je vérifie si l’outil peut scanner un segment réseau et commencer automatiquement à surveiller les nouveaux hôtes.
- Tableaux de bord et visualisation : Les vues d’état sur toute la flotte, les graphiques de tendances historiques et la personnalisation de la mise en page comptent. J’évalue la rapidité avec laquelle on passe de la connexion à l’identification de la cause racine.
- Vérifications de services et de disponibilité : Au-delà du simple ping, je recherche des vérifications de santé au niveau du port et du service qui confirment qu’Apache, MySQL ou Docker répondent réellement.
- Corrélation des journaux et événements : Lorsqu’un disque est plein et qu’un service plante, l’outil doit faire le lien. J’évalue la capacité à faire remonter des événements liés sur plusieurs serveurs.
Un outil doit offrir la majorité de ces fonctionnalités pour figurer sur la liste. À partir de là, j’examine ce qui distingue chaque solution.
Fonctionnalités distinctives (ce qui différencie les choix)
Je recherche une intégration cloud native qui remonte les métriques directement depuis les comptes AWS, Azure ou GCP, ce qui fait gagner des heures lors du suivi d’une infrastructure dynamique. Certains outils remarquables intègrent la détection d’anomalies et la prévision, aidant les équipes à détecter les pics de ressources avant qu’ils ne deviennent des incidents. J’évalue également l’étendue des intégrations avec les écosystèmes ITSM et DevOps, car la possibilité de relayer les alertes directement dans ServiceNow ou de déclencher des scripts correctifs via webhook peut vraiment faire la différence.
Ce que j’évalue au-delà des fonctionnalités
Le mode de déploiement compte beaucoup ici. J’analyse si l’outil est uniquement SaaS, sur site ou hybride, car les équipes dans les secteurs réglementés ont souvent besoin d’une souveraineté totale des données. La structure tarifaire est un autre critère majeur : le prix par hôte peut vite exploser à grande échelle, donc je vérifie si le modèle reste prévisible à mesure que la flotte grandit. Je prends aussi en compte la courbe d’apprentissage, car un outil qui nécessite des semaines de configuration fichier par fichier s’adresse à un public bien différent qu’un autre doté d’assistants de configuration guidée et de modèles de surveillance préconçus.
Comment choisir un outil de supervision de serveurs
Il est facile de se perdre dans de longues listes de fonctionnalités et des structures tarifaires complexes. Pour vous aider à rester concentré lors de votre processus unique de sélection logicielle, voici une liste de points à garder à l’esprit :
| Facteur | À considérer |
| Scalabilité | Assurez-vous que l’outil peut évoluer avec votre entreprise. Recherchez un logiciel de supervision d’entreprise capable de gérer une augmentation des données et des utilisateurs sans baisse de performance, surtout en cas d’expansion. |
| Intégrations | Vérifiez la compatibilité avec vos systèmes existants. L’outil doit pouvoir s’intégrer facilement à votre pile logicielle actuelle, comme AWS, Azure ou Slack, pour gagner du temps et de l’énergie. |
| Personnalisation | Privilégiez les outils qui vous permettent d’adapter tableaux de bord et rapports. Cela garantit à votre équipe d’obtenir les informations clés sans éléments superflus. |
| Facilité d’utilisation | Évaluez l’ergonomie de l’interface. Votre équipe doit pouvoir la prendre en main intuitivement, réduisant ainsi la courbe d’apprentissage et accélérant son adoption. |
| Budget | Comparez les formules tarifaires pour tenir compte de vos contraintes budgétaires. Pensez au coût total, y compris les frais cachés ou les modules complémentaires nécessaires, afin d’éviter tout dépassement. |
| Mesures de sécurité | Accordez la priorité aux outils dotés de solides dispositifs de sécurité. Vérifiez le chiffrement des données, les contrôles d’accès et la conformité aux normes du secteur pour protéger les informations sensibles. |
| Fiabilité | Choisissez des outils avec des garanties de disponibilité éprouvées. Un outil fiable assure une supervision continue sans interruptions fréquentes, maintenant ainsi la fluidité de vos opérations. |
| Options d’assistance | Considérez la disponibilité et la qualité du support client. Il est essentiel d’avoir accès à une assistance 24h/24 et 7j/7, des gestionnaires de compte dédiés et une documentation complète. |
Tendances dans les outils de supervision de serveurs
Dans le cadre de mes recherches, j’ai consulté de nombreuses mises à jour produit, communiqués de presse et journaux de versions issus de plusieurs éditeurs d’outils de supervision de serveurs. Voici quelques tendances émergentes que je surveille de près :
- Analyses pilotées par l’IA : De nombreux outils utilisent désormais l’IA pour fournir des analyses prédictives, vous aidant à anticiper les problèmes avant qu’ils ne surviennent. Cette tendance rend la supervision plus proactive, avec des éditeurs alternatifs à Nagios comme Dynatrace incorporant l’IA pour des alertes et diagnostics plus intelligents.
- Observabilité de la pile complète : Les utilisateurs souhaitent une visibilité sur l’ensemble de leur pile technologique, et pas seulement sur les serveurs. Des outils comme New Relic élargissent leur périmètre pour fournir des insights sur les applications, l’infrastructure et l’expérience utilisateur au même endroit, pour une vue globale.
- Visualisation des données en temps réel : Avec l’augmentation des données, le besoin de visualisation en temps réel devient primordial. Les éditeurs améliorent les tableaux de bord pour afficher les flux de données en direct, permettant aux équipes de réagir instantanément à tout changement.
- Surveillance cloud-native : Comme de plus en plus d’entreprises migrent vers le cloud, les outils de supervision évoluent pour prendre en charge les architectures cloud-native. Des solutions comme Datadog proposent des fonctionnalités dédiées aux environnements cloud, garantissant compatibilité et efficacité.
- Renforcement de la sécurité : La sécurité étant un enjeu majeur, les outils proposent désormais des fonctions de sécurité avancées. Les solutions de supervision intègrent la détection de menaces et des vérifications de conformité pour protéger les données, afin de répondre à la demande d’environnements plus sûrs.
Qu’est-ce qu’un outil de supervision de serveur ?
Les outils de supervision de serveurs suivent en continu la santé et la performance des serveurs—CPU, mémoire, disque, I/O, processus, services et réseau—permettant ainsi aux équipes IT et DevOps de détecter rapidement les problèmes, de résoudre les incidents plus efficacement et de maintenir les SLO (engagements de niveaux de service) dans des environnements sur site, cloud ou hybrides.
Les alertes en temps réel, les métriques de performance et les capacités de visualisation des données facilitent la supervision proactive et la résolution rapide des incidents, à l’image de ce que font les outils de supervision de sites web pour le suivi de la disponibilité et des performances.
Fonctionnalités des outils de supervision de serveurs
Lorsque vous choisissez un outil de supervision de serveurs, prêtez attention aux fonctionnalités clés suivantes :
- Surveillance en temps réel : Recevez des mises à jour instantanées sur l'état et les performances de votre serveur. La surveillance en temps réel vous permet de repérer les problèmes dès qu'ils surviennent, afin d'intervenir et de les résoudre avant qu'ils ne deviennent majeurs.
- Alertes automatisées : Recevez des notifications par e-mail, SMS ou alertes sur le tableau de bord lorsque vos serveurs atteignent les seuils fixés pour le processeur, la mémoire, l'espace disque ou d'autres métriques. Vous n'avez pas besoin de surveiller vos serveurs en permanence ; le système vous avertira lorsqu'une intervention s'impose.
- Suivi de l'utilisation des ressources : Surveillez des statistiques détaillées telles que l'utilisation du processeur, la consommation de mémoire, l'activité des disques et le trafic réseau sur l'ensemble de vos serveurs. Cela vous aide à prendre des décisions plus éclairées concernant les mises à niveau, la montée en charge ou l'équilibrage de charge.
- Données historiques et rapports : Accédez à des journaux et rapports qui retracent les performances du serveur dans le temps. L'analyse des tendances historiques vous aide à identifier les problèmes récurrents ou les périodes où vous pourriez avoir besoin de ressources supplémentaires.
- Tableaux de bord personnalisables : Personnalisez votre tableau de bord de surveillance pour afficher les informations qui vous importent le plus. Des widgets en glisser-déposer vous permettent de visualiser les métriques clés et d'obtenir un aperçu rapide adapté à votre mode de travail.
- Surveillance des processus et services : Gardez un œil sur des processus ou des services spécifiques s'exécutant sur vos serveurs. Vous saurez immédiatement si une tâche critique cesse de fonctionner, et pourrez remettre tout en ordre rapidement.
- Compatibilité multiplateforme : Surveillez les serveurs quel que soit leur système d'exploitation — que ce soit Windows, Linux ou macOS. Vous pouvez gérer des environnements mixtes sans changer d'outil.
- Intégration avec les systèmes de notification : Connectez votre outil de supervision à des applications collaboratives comme Slack ou à des systèmes de gestion de tickets. Cela vous évite les allers-retours par e-mail et permet à votre équipe d'agir plus rapidement lorsque c'est nécessaire.
- Sécurité et contrôles d'accès : Gérez qui peut voir ou modifier vos configurations de surveillance. De solides fonctionnalités de sécurité vous aident à prévenir les modifications non autorisées et à protéger les informations sensibles du serveur.
- Mise à l'échelle : Ajoutez facilement de nouveaux serveurs et services à mesure que votre entreprise se développe. Cela garantit que votre solution de surveillance s'adapte à vos besoins croissants sans perdre en efficacité.
Fonctionnalités courantes d'IA pour les outils de surveillance de serveurs
Les outils modernes de surveillance de serveurs exploitent souvent l'intelligence artificielle pour améliorer les performances et simplifier la gestion. Voici quelques fonctionnalités courantes basées sur l'IA à rechercher :
- Détection d'anomalies : Les algorithmes d'IA identifient automatiquement les schémas inhabituels ou les écarts de performance du serveur, vous aidant à repérer les problèmes avant qu'ils ne s'aggravent.
- Analyse prédictive : Les modèles d'apprentissage automatique prévoient les pannes potentielles du serveur ou les pénuries de ressources, vous permettant d'agir préventivement et de réduire les interruptions.
- Analyse automatisée des causes racines : L'IA identifie rapidement la source des problèmes de performance, réduisant le temps et les efforts consacrés au dépannage.
- Alertes intelligentes : Les systèmes intelligents réduisent les faux positifs en apprenant le comportement normal de votre serveur et ne vous notifient que lorsqu'une attention réelle est nécessaire.
- Planification de capacité : L'IA analyse les tendances d'utilisation pour recommander une allocation optimale des ressources et des stratégies de montée en charge, garantissant que vos serveurs puissent répondre aux demandes futures.
- Automatisation auto-corrective : Certains outils utilisent l'IA pour résoudre automatiquement les problèmes courants — comme redémarrer des services ou réaffecter des ressources — sans intervention humaine.
- Seuils de surveillance adaptatifs : L'IA ajuste dynamiquement les seuils d'alerte en fonction des données historiques et des schémas d'utilisation, maintenant la pertinence des notifications à mesure que votre environnement évolue.
Avantages
L'adoption d'outils de surveillance de serveurs offre de nombreux avantages pour votre équipe et votre entreprise. Voici ceux auxquels vous pouvez vous attendre :
- Résolution proactive des problèmes : Les alertes en temps réel et l'analyse prédictive permettent à votre équipe d'intervenir avant que les incidents ne prennent de l'ampleur, réduisant ainsi les interruptions.
- Performances améliorées : Le suivi des indicateurs de performance permet de maintenir un fonctionnement optimal des serveurs et d'améliorer l'efficacité globale.
- Prise de décision éclairée : Les tableaux de bord personnalisables et les rapports automatisés fournissent des insights pour orienter les choix stratégiques de votre équipe.
- Sécurité renforcée : Les fonctions de surveillance de la sécurité détectent les menaces et garantissent la conformité, protégeant vos données contre d'éventuelles violations.
- Soutien à la montée en charge : Les outils conçus pour la scalabilité grandissent avec votre entreprise et s'adaptent facilement à l'augmentation des données et du nombre d'utilisateurs.
- Visibilité complète : Une observabilité de bout en bout offre à votre équipe une vue d'ensemble complète de votre infrastructure et renforce la capacité de supervision.
Coûts et tarification
La sélection d’outils de surveillance des serveurs nécessite une compréhension des différents modèles de tarification et des plans disponibles. Les coûts varient en fonction des fonctionnalités, de la taille de l’équipe, des options supplémentaires, et plus encore. Le tableau ci-dessous résume les plans courants, leurs prix moyens et les fonctionnalités typiques incluses dans les solutions de surveillance des serveurs :
Tableau comparatif des plans pour les outils de surveillance des serveurs
| Type de plan | Prix moyen | Fonctionnalités courantes |
| Plan gratuit | $0 | Surveillance de base, tableaux de bord limités et alertes standards. |
| Plan personnel | $5-$25/utilisateur/mois | Métriques de performance, tableaux de bord personnalisables et rapports de base. |
| Plan business | $30-$75/utilisateur/mois | Analyses avancées, alertes en temps réel et capacités d’intégration. |
| Plan entreprise | $100-$300/utilisateur/mois | Observabilité complète, analyses prédictives et support dédié. |
FAQ sur les outils de surveillance des serveurs
Voici des réponses à des questions courantes sur les outils de surveillance des serveurs :
Pourquoi le suivi de l’inventaire est-il important en cybersécurité ?
Le suivi de l’inventaire est essentiel en cybersécurité car il permet d’identifier, de surveiller et de gérer chaque appareil et logiciel présent dans votre environnement informatique. Avec un inventaire complet, vous pouvez repérer les appareils non autorisés, suivre les vulnérabilités et assurer la conformité des logiciels. Un suivi précis permet de réduire les risques de violation de données en mettant en lumière les lacunes en matière de sécurité ou de gestion des correctifs, et vous offre une vision claire pour les audits et les réponses aux incidents.
Comment un logiciel de gestion d’inventaire IT peut-il aider lors des audits de conformité ?
Un logiciel de gestion d’inventaire IT facilite les audits de conformité en maintenant des enregistrements précis de tous les actifs matériels et logiciels. Vous pouvez rapidement générer des rapports, retracer l’historique des actifs et prouver les détails de licence ou de configuration à la demande. Une documentation automatisée et des journaux de modifications vous permettent d’être toujours prêt pour les audits, de réduire la paperasserie manuelle et de simplifier les vérifications réglementaires.
Quelles intégrations rechercher dans les outils de gestion d’inventaire IT ?
Recherchez des outils d’inventaire informatique qui s’intègrent à vos systèmes existants tels que les logiciels de support, les bases de données de gestion de configuration (CMDB), les logiciels de serveur applicatif, et les solutions de gestion des postes de travail. Les intégrations avec des outils de sécurité, les services d’annuaire et les fournisseurs cloud rationalisent les flux de travail et garantissent que vos données d’inventaire restent à jour dans toute votre infrastructure. Les outils de surveillance de serveurs suivent en continu la santé et la performance des serveurs — processeur, mémoire, disque, E/S, processus, services et réseau — pour que les équipes IT et DevOps puissent détecter rapidement les problèmes, résoudre les incidents plus vite et maintenir les accords de niveau de service (SLO) dans des environnements sur site, cloud ou hybrides.
Comment ces outils soutiennent-ils les environnements de travail à distance ou hybrides ?
La plupart des plateformes modernes de gestion d’inventaire informatique offrent un accès cloud, l’installation d’agents à distance et la synchronisation en temps réel. Vous pouvez surveiller les appareils partout — à domicile ou dans des bureaux distants —, suivre le matériel attribué aux collaborateurs distants et automatiser les mises à jour. Cela réduit les angles morts et permet de réagir plus rapidement aux problèmes, où que votre équipe se trouve.
Quelles fonctionnalités permettent de réduire les pertes de matériel ou le vol de dispositifs ?
De nombreux outils de gestion d’inventaire IT proposent le marquage des actifs, la géolocalisation, les journaux d’entrée/sortie et des alertes en cas d’activité inhabituelle. Ces fonctionnalités vous permettent de suivre l’attribution des appareils, d’enregistrer les déplacements et de retrouver plus rapidement le matériel perdu. Vous pouvez aussi configurer des rappels automatiques pour le retour des matériels ou la maintenance, minimisant ainsi les risques de perte ou de vol.
Comment la découverte automatisée des actifs fonctionne-t-elle dans les plateformes d’inventaire modernes ?
La découverte automatisée scanne votre réseau pour repérer tous les appareils connectés et logiciels installés. Le système met continuellement à jour l’inventaire, détecte les nouveaux actifs ou ceux non autorisés, et permet de conserver une base de données précise. Cela vous fait gagner du temps, améliore la sécurité et réduit les erreurs de suivi manuel.
Et après ?
Si vous recherchez un logiciel de surveillance de serveurs, contactez gratuitement un conseiller SoftwareSelect pour obtenir des recommandations personnalisées.
Remplissez un formulaire et planifiez un échange pour partager les besoins spécifiques à votre situation. Vous recevrez une sélection restreinte de logiciels à examiner et un accompagnement tout au long du processus d'achat, y compris lors des négociations tarifaires.