Les 10 meilleurs logiciels de surveillance réseau analysés pour 2026

Meilleure sélection de logiciels de surveillance réseau


Gérer un réseau peut s’avérer difficile. Vous gérez plusieurs appareils, sécurisez les données et veillez à ce que tout fonctionne sans accroc. Un logiciel de surveillance réseau peut vous aider à relever ces défis grâce à des analyses et des alertes, permettant à votre équipe de se concentrer sur l’essentiel.
J’ai testé et analysé de nombreux outils afin de vous offrir un aperçu objectif des meilleures solutions disponibles. Dans cet article, vous trouverez un examen détaillé des principaux logiciels de surveillance réseau adaptés aux besoins de votre équipe.
Je m’attache à proposer des informations fiables et documentées pour vous aider à prendre des décisions éclairées. Découvrons ensemble ce qui distingue ces outils et comment ils peuvent contribuer au succès de votre équipe.
Table of Contents
Pourquoi faire confiance à nos avis logiciels
Nous testons et analysons des logiciels depuis 2023. En tant que dirigeants technologiques, nous savons à quel point il est crucial et difficile de faire le bon choix lors de la sélection d’un logiciel.
Nous investissons dans des recherches approfondies pour aider notre audience à prendre de meilleures décisions d’achat de logiciels. Nous avons testé plus de 2 000 outils pour différents usages technologiques et rédigé plus de 1 000 avis complets. Découvrez comment nous restons transparents & notre méthodologie d’évaluation des logiciels.
Résumé des meilleurs logiciels de surveillance réseau
| Tool | Best For | Trial Info | Price | ||
|---|---|---|---|---|---|
| 1 | Idéal pour les représentations visuelles des réseaux | Essai gratuit de 14 jours disponible | Tarification sur demande | Website | |
| 2 | Idéal pour la prévention proactive des problèmes réseau | Essai gratuit de 30 jours | À partir de $179/mois (facturé annuellement) | Website | |
| 3 | Idéal pour la visibilité réseau et la découverte des appareils | Essai gratuit de 30 jours + démo gratuite disponible | À partir de 149$/technicien/mois (facturé annuellement) | Website | |
| 4 | Idéal pour la surveillance réseau multi-fournisseurs | Essai gratuit de 30 jours + offre gratuite disponible pour 3 appareils et 2 utilisateurs | À partir de $245 (pour 10 appareils) | Website | |
| 5 | Meilleure solution open source | Plan gratuit disponible | Tarif sur demande | Website | |
| 6 | Idéal pour une surveillance informatique évolutive | Plan gratuit + essai gratuit de 30 jours disponible | À partir de $225/mois (facturé annuellement) | Website | |
| 7 | Idéal pour la gestion MSP unifiée | Essai gratuit de 14 jours | À partir de $89/utilisateur/mois (facturation annuelle) | Website | |
| 8 | Idéal pour la sécurité DNS et la prévention des menaces | Essai gratuit + démo gratuite disponible | Tarification sur demande | Website | |
| 9 | Idéal pour une couverture complète des appareils | Démo gratuite + essai gratuit de 30 jours disponible | À partir de $9/mois (facturé annuellement) | Website | |
| 10 | Idéal pour la surveillance réseau dans des environnements complexes | Essai gratuit de 15 jours + démo personnalisée disponible | Dépend du service choisi | Website |

-

TestDevLab
Visit Website -
Site24x7
Visit WebsiteThis is an aggregated rating for this tool including ratings from Crozdesk users and ratings from other sites.4.7 -
GitHub Actions
Visit WebsiteThis is an aggregated rating for this tool including ratings from Crozdesk users and ratings from other sites.4.8


Avis sur les meilleurs logiciels de surveillance réseau
Vous trouverez ici mes choix pour les meilleurs logiciels et outils de surveillance réseau :
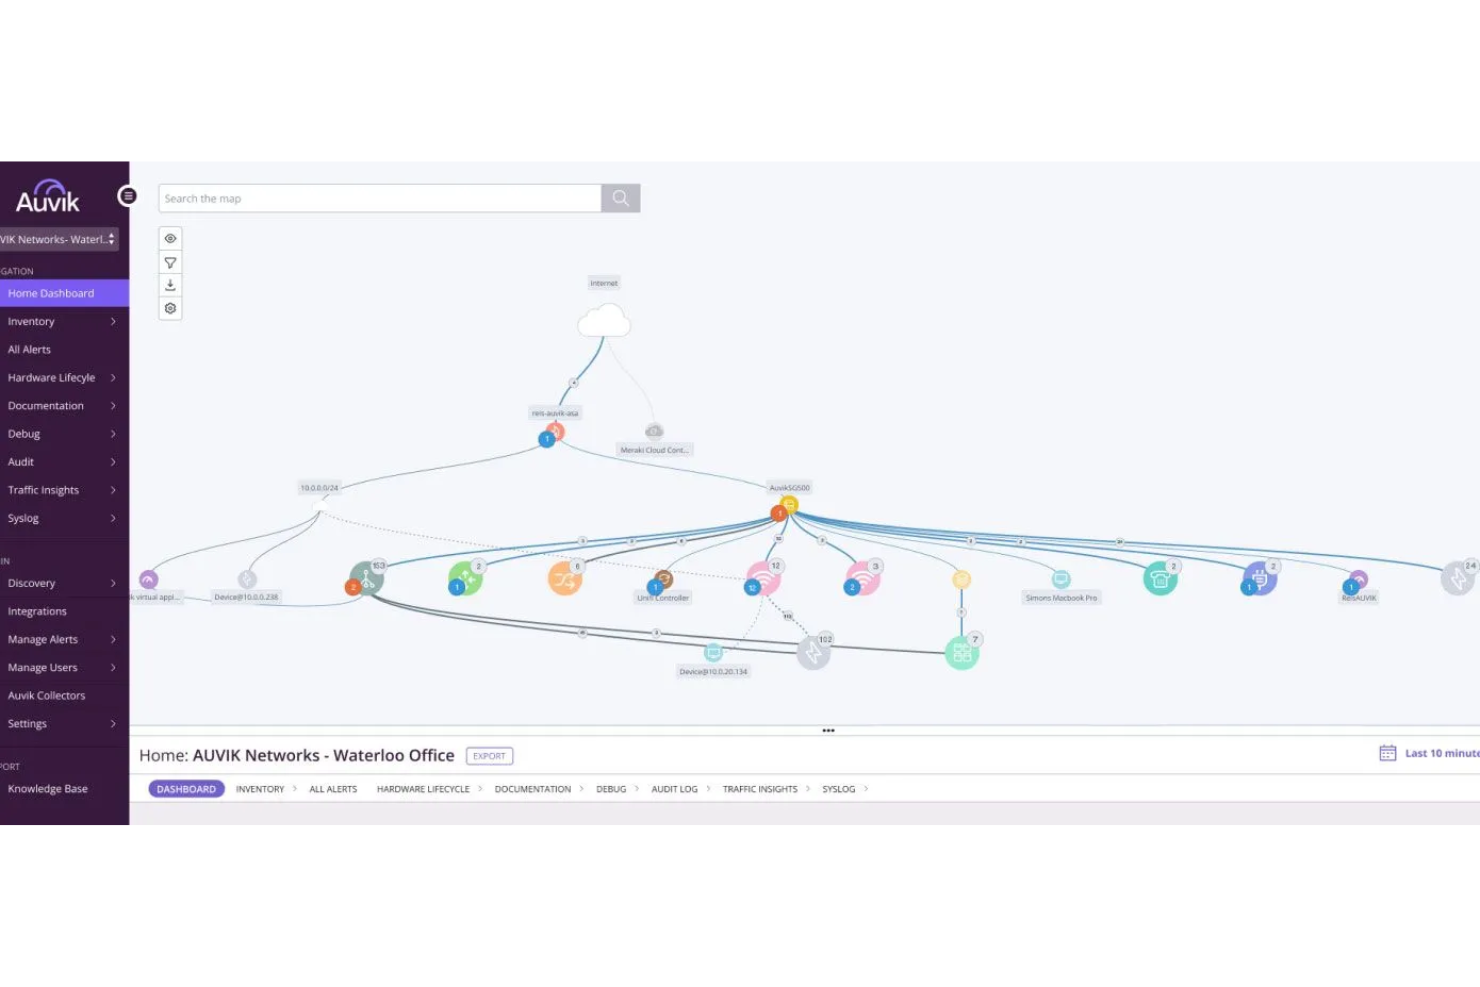
Auvik se démarque pour les équipes informatiques qui ont besoin d'une visibilité claire et en temps réel sur des environnements réseau complexes. Ses cartes réseau interactives et sa découverte automatique de topologie aident les administrateurs réseau à identifier rapidement les problèmes et à comprendre les relations entre les appareils. Si vous gérez des sites distribués ou rencontrez fréquemment des problèmes de connectivité, l’approche visuelle d’Auvik peut rendre la surveillance du réseau plus intuitive et exploitable.
Pour qui Auvik est-il le mieux adapté ?
Administrateurs réseau et responsables informatiques dans des organisations de petite à moyenne taille exerçant dans les services professionnels ou les entreprises multisites. Il convient aux équipes qui comptent sur une cartographie visuelle du réseau pour comprendre la topologie et résoudre les incidents.
Pourquoi j'ai choisi Auvik
Ce qui fait d’Auvik un excellent choix pour la surveillance réseau est son accent mis sur la visualisation en temps réel de l’infrastructure réseau. La plateforme génère automatiquement des cartes réseau interactives qui se mettent à jour à mesure que des appareils sont ajoutés ou retirés, vous offrant une vue claire de votre environnement à tout moment. J’apprécie que la découverte de topologie d’Auvik mette en évidence les relations entre les dispositifs et les chemins de circulation, ce qui aide à vite repérer les goulots d’étranglement ou les mauvaises configurations. Pour les équipes informatiques amenées à dépanner ou auditer des réseaux complexes, ces outils visuels facilitent grandement la gestion et la compréhension de ce qui se passe sur l’ensemble de vos sites.
Fonctionnalités clés d’Auvik
Parmi les autres fonctionnalités qui rendent Auvik utile pour la surveillance des réseaux :
- Sauvegardes automatiques des configurations : Capture et stocke régulièrement les configurations des dispositifs afin de faciliter leur restauration.
- Analyse du trafic : Surveille les schémas de trafic réseau et fournit des rapports détaillés d’utilisation.
- Gestion multisite : Permet de superviser et gérer plusieurs réseaux depuis un seul tableau de bord.
- Contrôle d’accès basé sur les rôles : Attribue différents niveaux d’autorisations aux utilisateurs selon leurs responsabilités.
Intégrations Auvik
Les intégrations incluent ArcusTeam, Autotask PSA, BrightGauge, Captain's Chair, Slack, Microsoft Teams, ConnectWise, Continuum, Freshdesk, Global Dash, PagerDuty, et bien d’autres.
Pros and Cons
Pros:
- Représentation graphique détaillée et visuelle des réseaux
- Supervision sur tableau de bord unique
- Système d’alerte rapide et précis
Cons:
- La personnalisation de la plateforme peut prendre du temps
- Devrait proposer davantage d’intégrations
New Product Updates from Auvik
Auvik Adds Aurora Troubleshooting Assistance
Auvik introduces Aurora Troubleshooting Assistance with AI-powered troubleshooting guidance, possible root causes, conversation downloads, and feedback tools. The open beta helps IT teams diagnose network issues faster with contextual recommendations tailored to specific devices and alerts. For more information, visit Auvik's official site.
 .
.
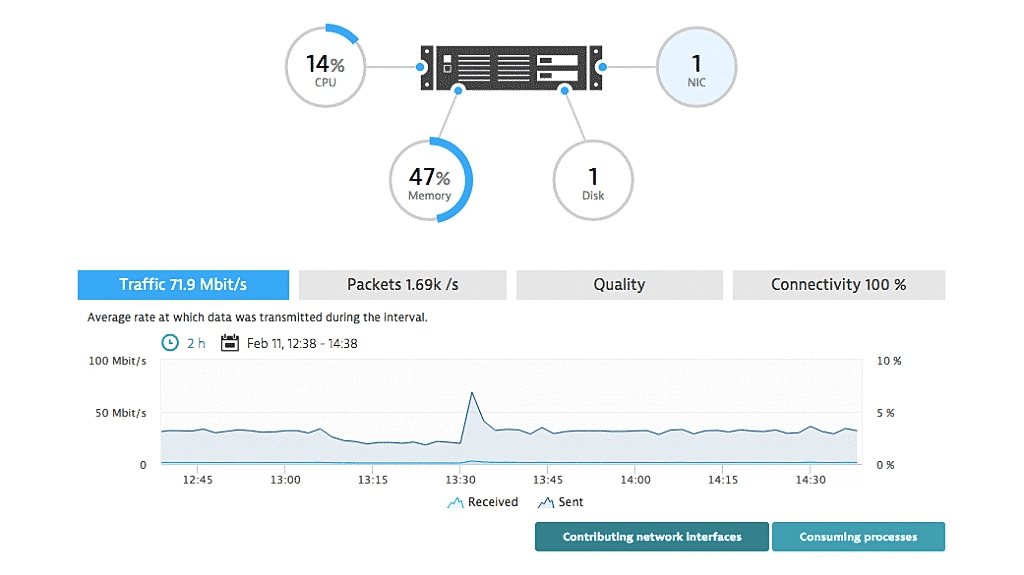
PRTG de Paessler est un outil complet de surveillance de l'infrastructure informatique qui propose des solutions adaptées aux environnements informatiques de petite, moyenne et grande taille, ainsi qu'une surveillance hébergée pour le cloud et l'informatique hybride. Il offre une surveillance et des alertes en temps réel pour les équipements réseau, l'utilisation de la bande passante et d'autres indicateurs réseau essentiels. Grâce à ses capteurs personnalisables et à l'automatisation des alertes, PRTG vous aide à identifier et à résoudre les goulets d'étranglement de performance et les pannes dès leur apparition.
À qui s'adresse PRTG ?
Aux ingénieurs réseau et aux équipes d'infrastructures IT dans des environnements de taille moyenne à grande entreprise. Il convient aux organisations qui ont besoin d'une surveillance proactive afin de détecter et résoudre rapidement les problèmes de performance et de disponibilité.
Pourquoi j'ai choisi PRTG
Ce qui distingue PRTG selon moi, c'est son orientation vers la prévention proactive des incidents réseau, essentielle pour les équipes IT qui souhaitent éviter les interruptions de service. PRTG utilise des capteurs personnalisables pour surveiller aussi bien l'utilisation de la bande passante que la santé des appareils, permettant ainsi de repérer les anomalies avant qu'elles ne deviennent problématiques. J'apprécie le fait que son système d'alerte automatique vous prévienne instantanément en cas de dépassement des seuils, ce qui permet une intervention rapide. Cette approche aide les organisations à maintenir une haute disponibilité et performance, même dans les environnements réseau les plus complexes.
Fonctionnalités clés de PRTG
Parmi les autres fonctionnalités qui font de PRTG un outil utile pour la surveillance réseau, on trouve :
- Détection automatique : Analyse votre réseau pour détecter automatiquement les équipements et configurer les capteurs.
- Créateur de cartes personnalisées : Permet de créer des cartes réseau visuelles avec des indicateurs d'état en direct.
- Applications mobiles : Propose des applications natives iOS et Android pour surveiller le réseau où que vous soyez.
- Moteur de rapports : Génère des rapports programmés ou à la demande avec des statistiques réseau détaillées.
Intégrations PRTG
Les intégrations incluent Comet Backup, BackBox Automation Platform, BrightGauge, Google Analytics, Dropbox, AlertOps, UVexplorer, AutoMonX, SMSEagle, et bien d'autres.
Pros and Cons
Pros:
- Interface conviviale
- Surveillance et alertes personnalisables
- Adapté aux réseaux de petite et grande taille
Cons:
- Coût élevé pour les déploiements importants
- Certaines fonctionnalités avancées peuvent nécessiter un temps d’apprentissage
New Product Updates from PRTG
PRTG Introduces New Monitoring Sensors In Beta
This week, PRTG introduces three BETA sensors that broaden your monitoring scope for Proxmox VE clusters and SIMATIC S7-300/400 PLCs, giving you deeper operational insights. For more information, visit PRTG’s official site.
 .
.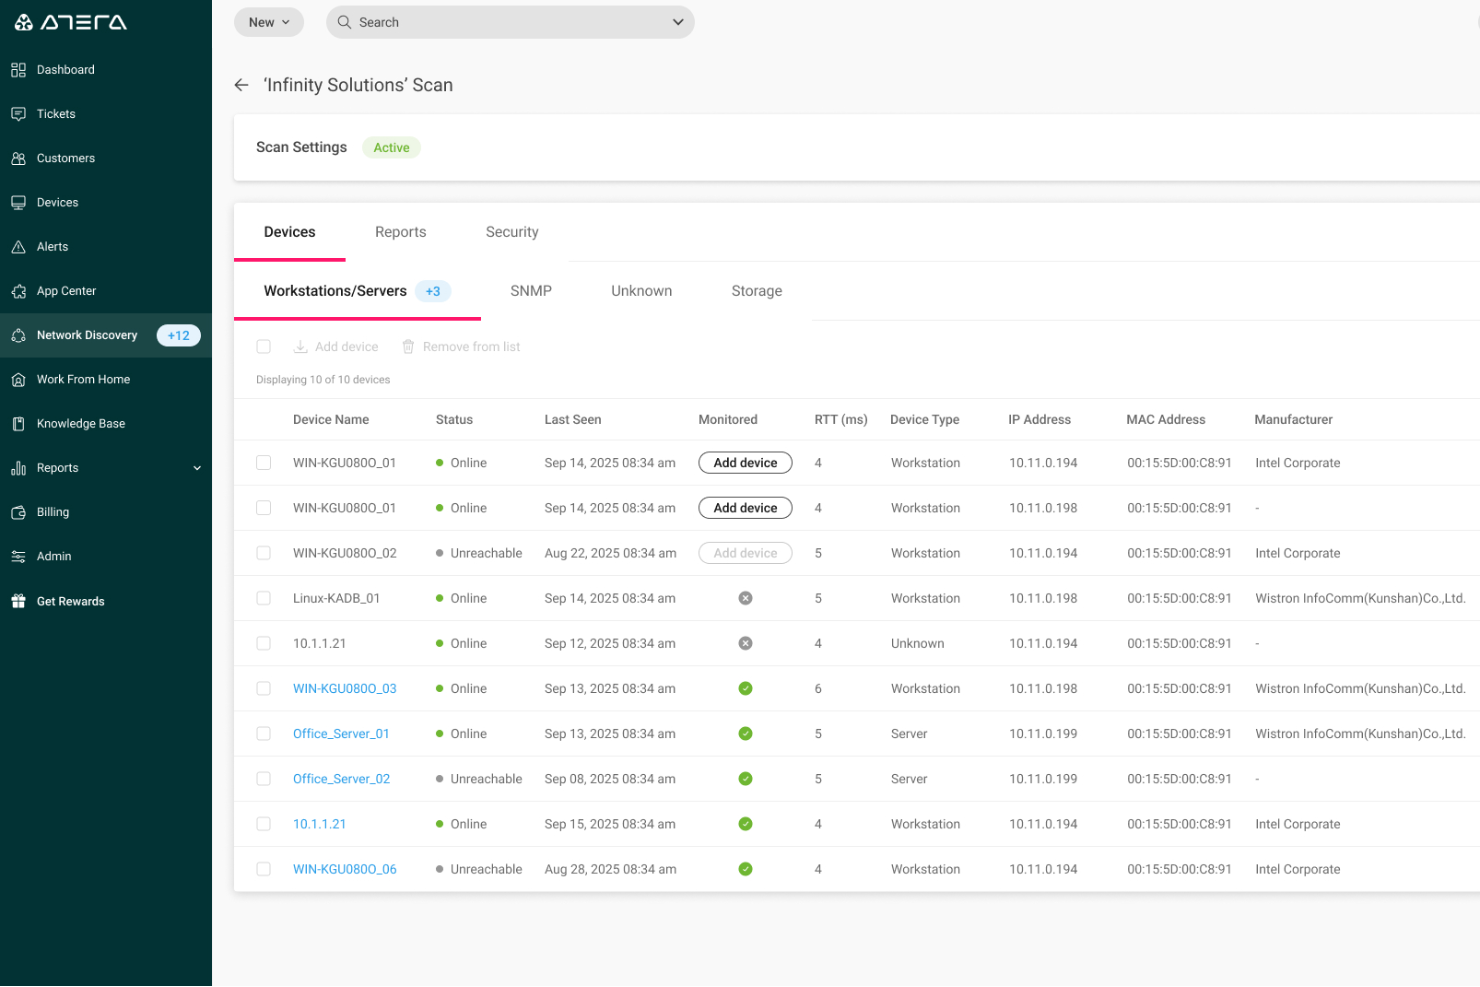
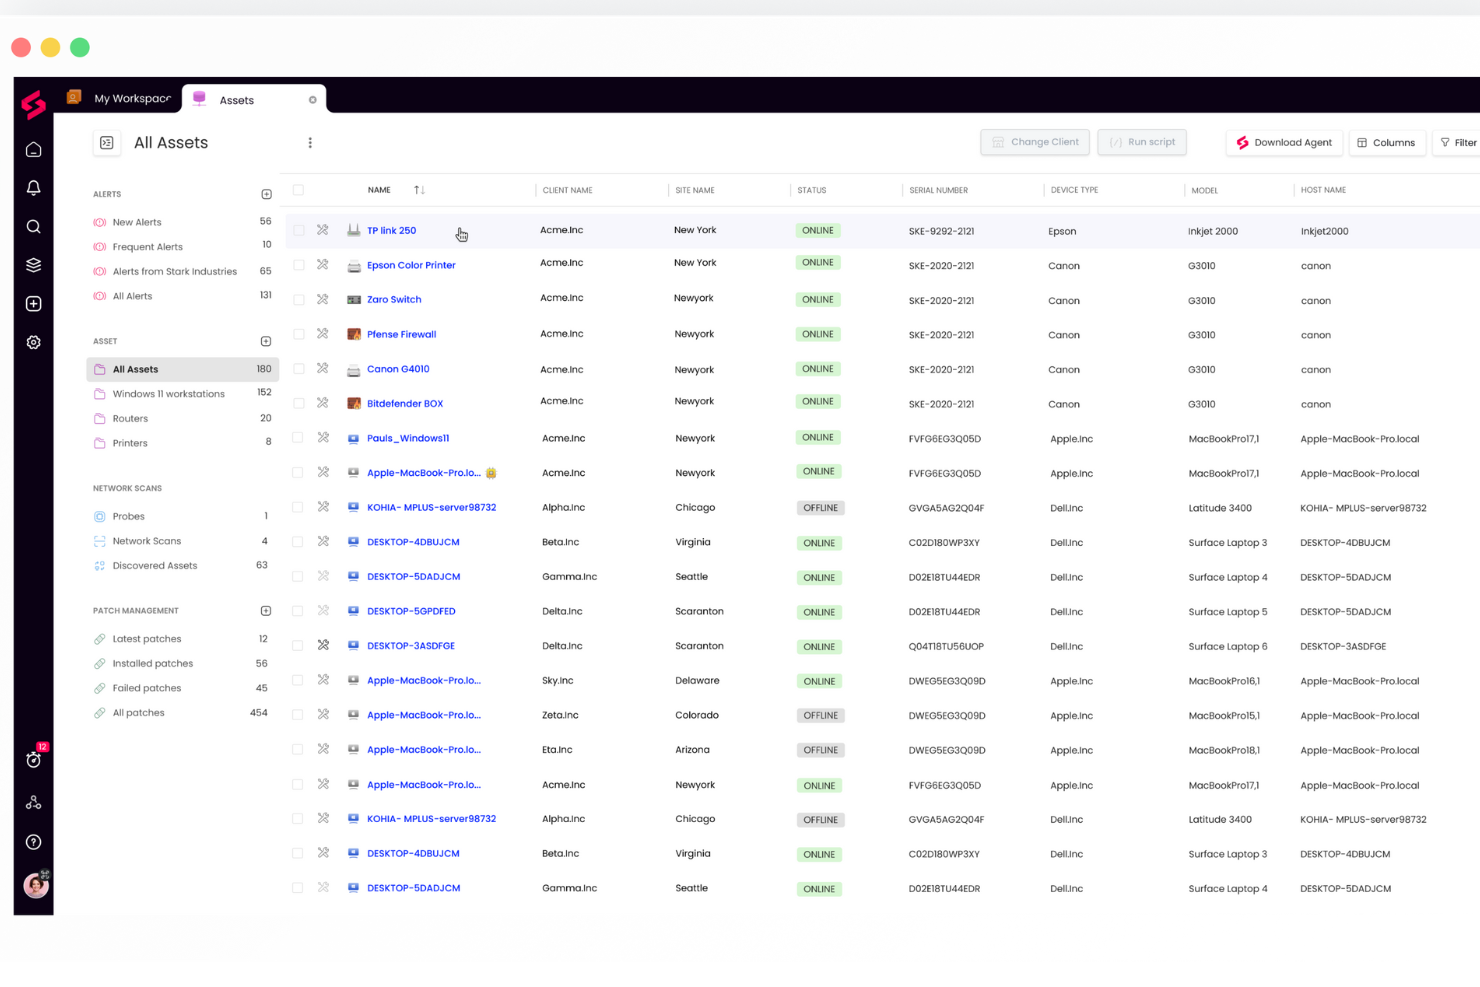
Pour les administrateurs réseau et les professionnels IT qui souhaitent surveiller et gérer leurs réseaux, Atera offre une solution complète. Elle est conçue pour les fournisseurs de services managés (MSP) et les services informatiques qui souhaitent superviser plusieurs réseaux en toute simplicité. Elle répond aux défis tels que la découverte des appareils et la visibilité du réseau, garantissant ainsi une infrastructure réseau solide.
À qui Atera convient-il le mieux ?
Aux professionnels informatiques généralistes et aux MSP des petites et moyennes entreprises desservant des clients répartis géographiquement. Elle convient aux équipes qui ont besoin d'une visibilité réseau et d'une découverte automatisée des appareils via une plateforme de gestion unifiée.
Pourquoi j'ai choisi Atera
J'ai choisi Atera pour sa visibilité réseau exceptionnelle, qui est cruciale pour tout outil de supervision réseau. La fonction de découverte réseau d'Atera se distingue en proposant une vue détaillée de tous les appareils présents sur un réseau. Cette fonctionnalité scanne et met à jour automatiquement l'inventaire du réseau, assurant ainsi des informations actualisées sur vos actifs réseau. De plus, ses capacités de surveillance continue suivent des indicateurs clés comme l'utilisation du processeur, de la mémoire vive et de la bande passante pour garantir des performances optimales.
Fonctionnalités clés d'Atera
En plus de sa visibilité réseau, Atera propose plusieurs autres fonctionnalités qui renforcent son efficacité :
- Supervision et gestion à distance (RMM) : Permet de surveiller la santé et la performance de votre réseau depuis un tableau de bord unique.
- Gestion automatisée des correctifs : Gardez vos systèmes à jour grâce à l’automatisation des mises à jour, réduisant ainsi les vulnérabilités.
- Système de helpdesk et de gestion des tickets : Rationalisez votre assistance avec un système de tickets intégré.
- Rapports et analyses : Obtenez des informations précieuses avec des rapports détaillés sur la performance et les incidents réseau.
Intégrations d'Atera
Les intégrations incluent Microsoft Teams, Slack, Acronis, Splashtop, et une API est disponible pour des intégrations personnalisées.
Pros and Cons
Pros:
- Découverte automatique des appareils
- Analyse en temps réel des vulnérabilités CVE
- Inventaire centralisé des actifs réseau
Cons:
- Les options de personnalisation peuvent sembler limitées
- Certaines fonctionnalités nécessitent des modules complémentaires séparés
New Product Updates from Atera

Atera Adds Multiple API Tokens With Access Controls
Atera now supports multiple API tokens with configurable expiration dates, IP restrictions, and permission scopes, giving teams tighter control and safer delegation of API access. For more information, visit Atera's official site.
Idéal pour la surveillance réseau multi-fournisseurs
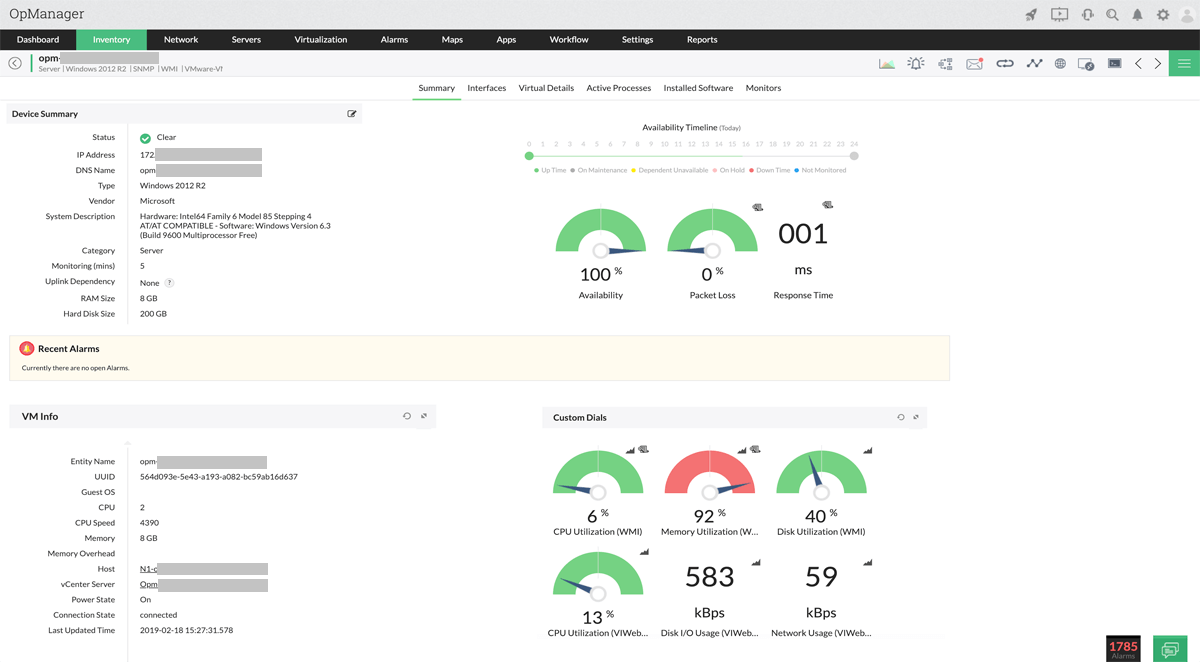
Si vous gérez un réseau composé d'appareils provenant de plusieurs fournisseurs, ManageEngine OpManager est conçu pour vous permettre de les surveiller tous depuis une plateforme unique. Cet outil s'adresse aux équipes informatiques évoluant dans des environnements matériels hétérogènes qui nécessitent une visibilité et un contrôle unifiés. Sa prise en charge multi-fournisseurs contribue à réduire les angles morts et simplifie le dépannage au sein de réseaux complexes et variés.
À qui s'adresse le mieux ManageEngine OpManager ?
Aux administrateurs réseau et aux équipes d'infrastructure informatique dans des organisations de taille moyenne à grande, notamment dans l'industrie, la santé et l'éducation. Ce logiciel convient parfaitement aux entreprises opérant dans des environnements réseau multi-fournisseurs nécessitant une surveillance centralisée des performances.
Pourquoi j'ai choisi ManageEngine OpManager
Ce qui distingue ManageEngine OpManager, c'est sa capacité à surveiller des équipements provenant d'un large éventail de fournisseurs depuis un tableau de bord unifié. Cela est particulièrement précieux pour les équipes informatiques qui gèrent des environnements complexes comprenant des commutateurs, routeurs, pare-feux et serveurs de différents fabricants. J'apprécie qu'OpManager offre une surveillance approfondie des appareils ainsi qu'une découverte automatique pour les équipements multi-fournisseurs, ce qui réduit la configuration manuelle. Son approche neutre vis-à-vis des fournisseurs en fait un choix pertinent pour les organisations souhaitant éviter la multiplication des outils tout en maintenant une visibilité homogène sur l'ensemble du réseau.
Fonctionnalités clés de ManageEngine OpManager
Parmi les autres fonctions d'OpManager susceptibles d'intéresser les administrateurs réseau :
- Cartographie réseau couche 2 : Génère automatiquement des cartes visuelles de votre topologie réseau pour faciliter le dépannage et la planification.
- Analyse du trafic NetFlow : Surveille l'utilisation de la bande passante et analyse les schémas de trafic afin d'identifier les goulets d'étranglement ou une activité inhabituelle.
- Gestion des configurations des équipements réseau : Sauvegarde, restaure et gère les configurations du matériel réseau pris en charge.
- Tableaux de bord personnalisables : Permet de créer des tableaux de bord personnalisés avec des widgets afin de suivre les indicateurs les plus importants pour votre équipe.
Intégrations de ManageEngine OpManager
Les intégrations comprennent ManageEngine ServiceDesk Plus, ServiceNow, Jira Service Management, Slack et Microsoft Teams. Des API sont également disponibles.
Pros and Cons
Pros:
- Plus de 2 000 indicateurs de performance pour la surveillance réseau
- Cartographie et visualisation de la dégradation des performances et des pannes réseau
- Indicateurs de performance des routeurs tels que la température, la tension et les statistiques de la mémoire tampon
Cons:
- Options de personnalisation limitées pour les tableaux de bord et les rapports
- Processus d'installation et de configuration complexe
New Product Updates from ManageEngine OpManager
ManageEngine OpManager Vendor Templates and NCM XML Import
ManageEngine OpManager introduces enhanced vendor template integration and device template import for the NCM module using XML files. This update helps teams improve device classification and speed up configuration workflows. For more information, visit ManageEngine OpManager’s official site.
 .
.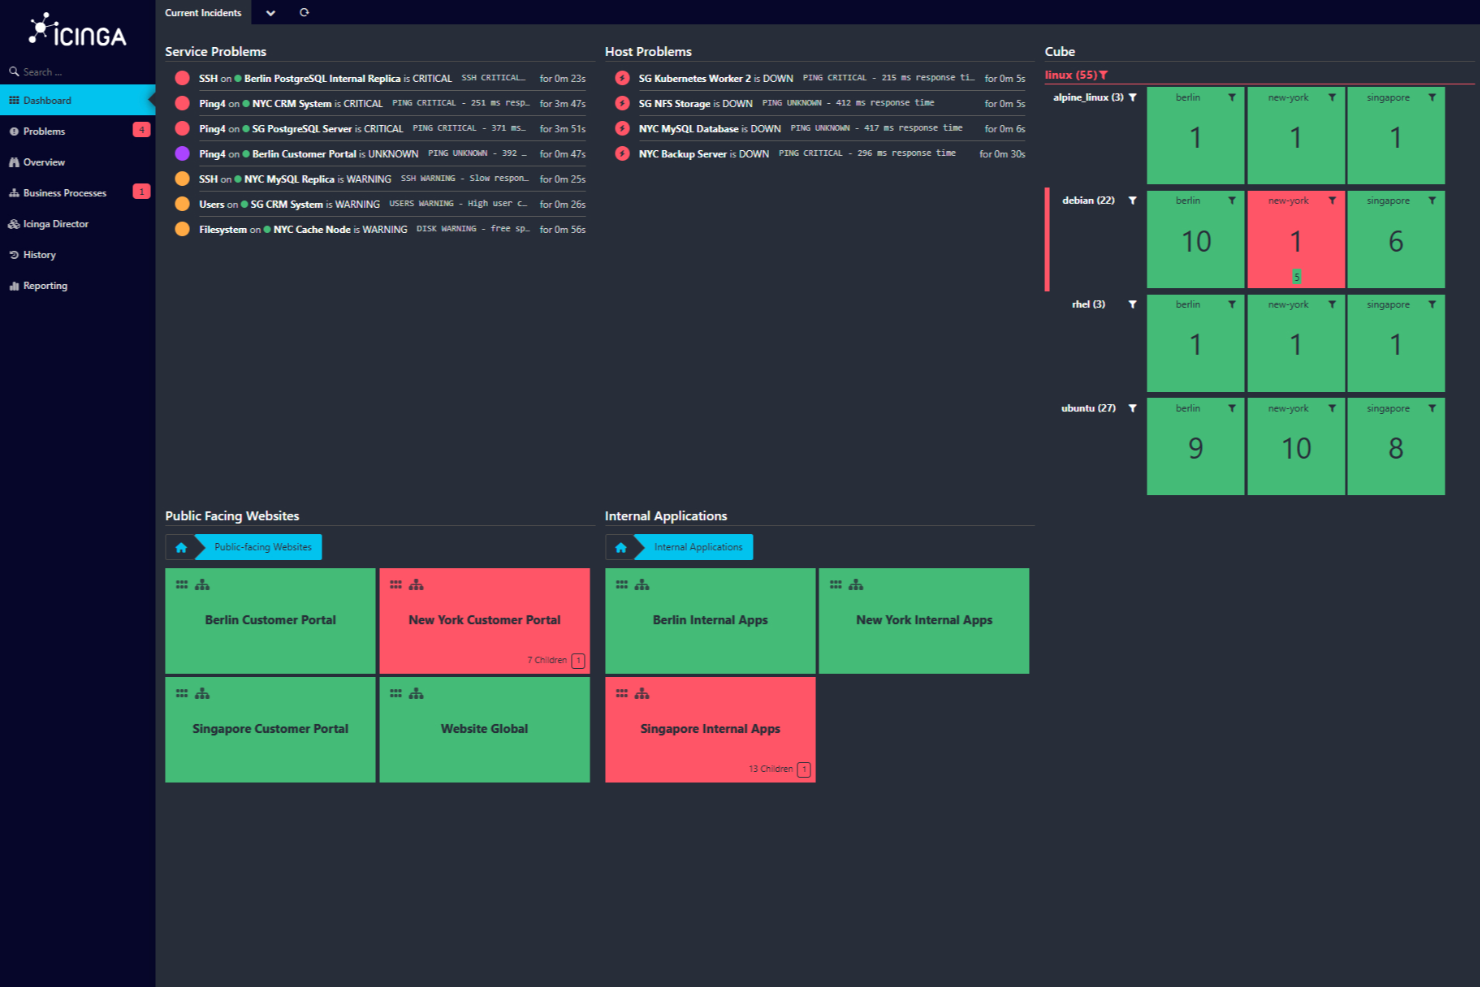
Icinga est un logiciel de supervision open source spécialement conçu pour les environnements informatiques complexes. Il convient particulièrement aux équipes IT qui souhaitent un contrôle total sur la surveillance, l’alerte et les intégrations, sans dépendance envers un fournisseur. Icinga est adapté aux organisations ayant une infrastructure complexe ou évolutive et nécessitant de personnaliser la supervision selon des besoins uniques.
À qui s’adresse Icinga ?
Aux administrateurs systèmes et équipes DevOps de moyennes ou grandes entreprises disposant d’une expertise technique en interne. Il s’adresse aux sociétés préférant une solution de supervision open source pour une gestion personnalisée de leur infrastructure.
Pourquoi j’ai choisi Icinga
Ce qui distingue Icinga, c’est sa base open source qui offre aux équipes informatiques la liberté de personnaliser et d’étendre leur environnement de supervision réseau. J’ai choisi Icinga parce qu’il permet aux utilisateurs de définir leurs propres vérifications, notifications et tableaux de bord, rendant possible la surveillance même des infrastructures les plus uniques ou complexes. Son architecture modulaire permet d’ajouter ou de retirer des composants au fur et à mesure de l’évolution des besoins, sans dépendre de la feuille de route d’un fournisseur. Pour les organisations qui privilégient la transparence et la flexibilité, l’approche open source d’Icinga est un atout majeur.
Fonctionnalités clés d’Icinga
En plus de son architecture personnalisable, j’ai également trouvé ces fonctionnalités précieuses pour la supervision réseau :
- Supervision distribuée : Prend en charge la surveillance de plusieurs sites et environnements à partir d’une seule interface.
- Système d’alerte avancé : Permet de configurer des règles d’alerte détaillées selon des seuils et dépendances.
- Collecte de données de performance : Recueille et visualise les métriques pour les équipements réseau, serveurs et applications.
- Accès API REST : Permet l’intégration à d’autres outils et l’automatisation des tâches de supervision via une API.
Intégrations Icinga
Les intégrations incluent Grafana, AWS, Azure, Puppet, Ansible, Jira, PagerDuty, ServiceNow, BigPanda et Stackstorm.
Pros and Cons
Pros:
- Gratuit à utiliser sans frais d’installation
- Évolutif pour les petits comme les grands environnements
- Hautement personnalisable pour s’adapter à différents besoins d’infrastructure IT
Cons:
- Des problèmes de performance occasionnels sont signalés lors de fortes charges
- L’installation et la configuration demandent une certaine prise en main
New Product Updates from Icinga

Icinga Adds TOTP Two-Factor Authentication to Icinga Web
Icinga added time-based one-time password (TOTP) two-factor authentication to Icinga Web, helping organizations strengthen login security with an additional verification step. For more information, visit Icinga’s official site.
 .
.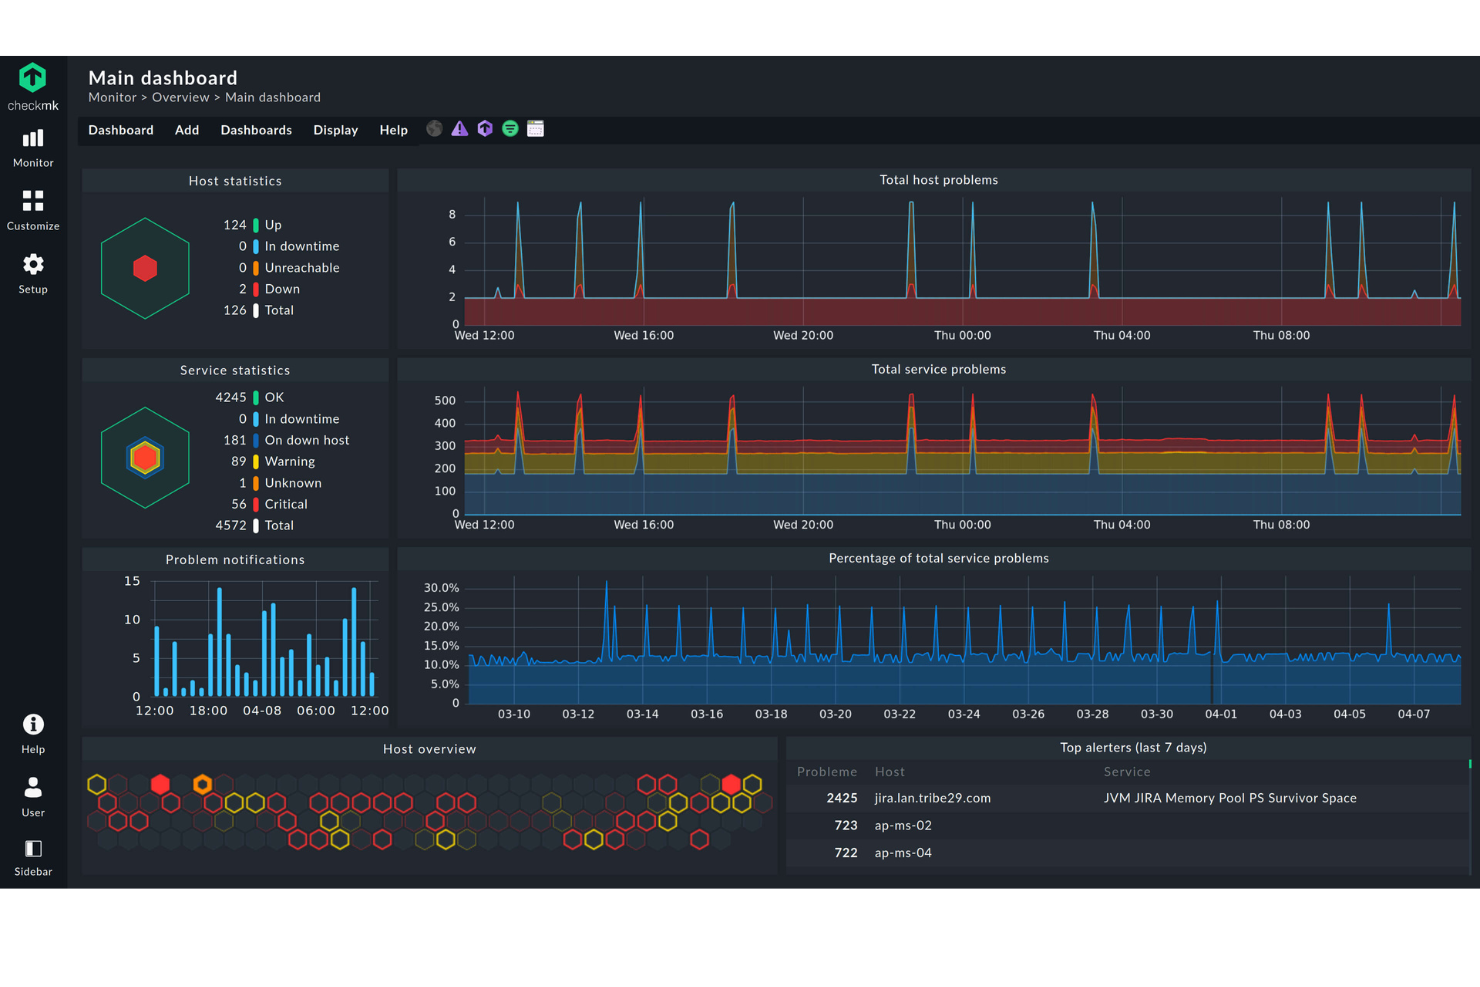
Checkmk est conçu pour les équipes informatiques qui doivent surveiller de vastes infrastructures complexes sans sacrifier la performance ou la flexibilité. Son approche modulaire vous permet de passer de quelques appareils à des milliers, ce qui en fait une solution robuste pour les grandes entreprises et les fournisseurs de services managés. Si vous gérez des environnements distribués ou une croissance rapide, Checkmk vous aide à garder une visibilité et un contrôle sur l'ensemble du système.
Pour qui Checkmk est-il le plus adapté ?
Les ingénieurs en infrastructure informatique et les équipes DevOps des entreprises de taille moyenne à grande avec des environnements complexes. Il convient parfaitement aux entreprises qui ont besoin d'une surveillance évolutive sur des infrastructures locales et hybrides.
Pourquoi j'ai choisi Checkmk
L'évolutivité est un atout clé qui distingue Checkmk dans le domaine de la surveillance réseau. La plateforme utilise une architecture de supervision distribuée, ce qui permet de contrôler des milliers d'appareils sur plusieurs sites sans goulots d'étranglement en termes de performance. J'apprécie que Checkmk prenne en charge la surveillance à la fois basée sur agent et sans agent, vous offrant ainsi une flexibilité lorsque votre environnement évolue ou change. Sa configuration basée sur des règles vous aide également à standardiser la surveillance sur de grands réseaux complexes, ce qui est essentiel pour les équipes informatiques qui gèrent une expansion rapide ou des sites distribués.
Fonctionnalités clés de Checkmk
D'autres fonctionnalités qui rendent Checkmk utile pour la surveillance réseau incluent :
- Découverte automatique des appareils réseau : Scanne et identifie les dispositifs sur votre réseau pour simplifier la configuration et la gestion continue.
- Tableaux de bord personnalisés : Permet de créer des tableaux de bord personnalisés pour visualiser les indicateurs clés et l'état du réseau.
- Système d'alertes intégré : Envoie des notifications par e-mail, SMS ou d'autres canaux lorsque des problèmes sont détectés.
- Bibliothèque de plugins étendue : Propose des centaines de plugins prêts à l'emploi pour surveiller différents matériels, applications et services.
Intégrations Checkmk
Les intégrations incluent Nagios, Grafana, Prometheus, LDAP/Active Directory, Jira, PagerDuty, ntop et Slack.
Pros and Cons
Pros:
- Grande configurabilité
- Nombreuses options d'automatisation
- Capacités de surveillance complètes
Cons:
- Surcharge potentielle pour les petits réseaux
- Courbe d'apprentissage pour les nouveaux utilisateurs
SuperOps réunit la supervision réseau, la gestion à distance et la gestion des tickets au sein d'une plateforme unique conçue pour les fournisseurs de services managés. Si vous dirigez une société MSP ou une entreprise de services informatiques, vous pouvez utiliser SuperOps pour surveiller les réseaux clients, automatiser la maintenance et gérer les demandes de support depuis un seul endroit. Cette approche unifiée aide à limiter la multiplication des outils et vous offre une meilleure visibilité sur les environnements clients.
À qui s’adresse principalement SuperOps ?
Aux fournisseurs de services managés (MSP) et aux responsables informatiques de petites et moyennes entreprises MSP. Il convient particulièrement aux organisations souhaitant intégrer la supervision réseau dans une plateforme unifiée de gestion MSP.
Pourquoi j’ai choisi SuperOps
Pour les fournisseurs de services managés désireux de centraliser leurs opérations, SuperOps se distingue en combinant la supervision réseau, la gestion à distance et la gestion des tickets sur une seule plateforme. Je l’ai choisi car cette approche unifiée aide les MSP à surveiller les réseaux clients, à résoudre les problèmes et à gérer les actifs sans avoir à jongler entre plusieurs outils. SuperOps comprend des fonctionnalités telles que la découverte automatisée des appareils et les alertes en temps réel, essentielles pour une gestion réseau proactive. Cette conception tout-en-un est particulièrement utile pour les MSP qui souhaitent gérer leurs flux de travail et conserver une visibilité sur la diversité des environnements clients.
Fonctionnalités clés de SuperOps
Parmi les autres fonctionnalités rendant SuperOps précieux pour les MSP, on retrouve :
- Politiques d’alerte personnalisables : Définissez des seuils et règles de notification spécifiques selon les clients ou les équipements.
- Gestion intégrée des correctifs : Planifiez et déployez les mises à jour logicielles sur l’ensemble des terminaux gérés depuis la même plateforme.
- Suivi de l’inventaire des actifs : Tenez à jour un inventaire en temps réel des actifs matériels et logiciels pour chaque client.
- Bibliothèque d’automatisation par script : Accédez à des scripts préconçus ou sur mesure et déployez-les pour automatiser les tâches de maintenance courantes.
Intégrations SuperOps
Les intégrations incluent Splashtop, ConnectWise Control, QuickBooks Online, Xero, Stripe, Bitdefender, Microsoft Entra ID, SentinelOne, et d’autres.
Pros and Cons
Pros:
- Plateforme unifiée intégrant la supervision réseau et le RMM, simplifiant ainsi les opérations informatiques
- Facile à utiliser avec un processus de configuration simple, réduisant la courbe d’apprentissage pour les nouveaux utilisateurs
- Propose des intégrations natives avec de nombreux logiciels tiers populaires, renforçant ainsi les fonctionnalités
Cons:
- En tant qu’acteur relativement nouveau, il peut manquer de certaines fonctionnalités avancées présentes chez les concurrents plus établis
- Peu d’informations disponibles sur les options de personnalisation pour des besoins MSP spécifiques
New Product Updates from SuperOps

SuperOps Improves Ticket Visibility, Dynamic Forms, and Dashboard Views
SuperOps introduces improvements to ticket visibility, dynamic forms, and dashboard visualizations. These updates help technicians manage customer conversations, simplify ticket creation, and keep dashboard views consistent across teams. For more information, visit SuperOps' official site.
 .
.
Lorsqu'on considère la complexité du trafic réseau et les menaces persistantes pesant sur les actifs numériques, Heimdal s'impose comme un allié précieux pour protéger l'intégrité du réseau de votre organisation. Sa suite robuste de fonctionnalités répond aux besoins de secteurs comme la santé, l'éducation et le gouvernement, en s'adaptant aux défis propres à chacun. Axé sur la sécurité DNS, la chasse aux menaces et la gestion des terminaux, Heimdal garantit la résilience de votre réseau face à l'évolution des cybermenaces, apportant sérénité et amélioration de l'efficacité opérationnelle globale.
Pour qui Heimdal est-il le mieux adapté ?
Les équipes d'opérations de sécurité et les administrateurs informatiques des petites et moyennes entreprises du secteur financier et des services professionnels. Il convient particulièrement aux entreprises qui privilégient la sécurité au niveau DNS et la prévention des menaces sur le réseau.
Pourquoi j'ai choisi Heimdal
J'ai sélectionné Heimdal pour ses capacités exceptionnelles en matière de sécurité DNS, essentielles à la surveillance du réseau. Sa technologie prédictive DNS prévient activement les menaces en analysant les flux de trafic et en bloquant les domaines malveillants avant qu'ils ne causent des dommages. De plus, le système de prévention des intrusions basé sur l’hôte (HIPS) de Heimdal offre une détection avancée des menaces, permettant à votre équipe de réagir rapidement en cas de tentative d’intrusion. Ces fonctionnalités, combinées à la détection des menaces pilotée par l’IA, répondent au besoin crucial de surveillance et de protection en temps réel, faisant de Heimdal un choix remarquable pour ceux qui souhaitent garantir des réseaux performants et sécurisés.
Fonctionnalités clés de Heimdal
Outre sa sécurité DNS et son HIPS de pointe, j'ai également relevé que Heimdal propose :
- Gestion unifiée des terminaux : Gérez facilement tous les terminaux de votre organisation pour garantir des politiques de sécurité et des mises à jour cohérentes.
- Journalisation du trafic : Surveillez et enregistrez le trafic DNS afin d’obtenir une visibilité sur l’activité réseau et les potentielles menaces de sécurité.
- Capacités DNS hybrides : Sécurisez le trafic DNS au sein des réseaux locaux, ajoutant un niveau de sécurité supplémentaire sans recourir à des intermédiaires externes.
- Cloud Access Security Brokerage (CASB) : Renforcez la protection contre les accès non autorisés au cloud et les fuites de données, tout en assurant la conformité avec les normes de gouvernance des données.
Intégrations de Heimdal
Les intégrations natives ne sont pas actuellement répertoriées par Heimdal ; toutefois, la plateforme prend en charge des intégrations personnalisées via API.
Pros and Cons
Pros:
- Automatise le déploiement des correctifs sur tous les terminaux
- Détection puissante des vulnérabilités et des menaces
- Visibilité détaillée des actifs et des licences
Cons:
- Aucune intégration native disponible
- L'interface nécessite une phase d'apprentissage
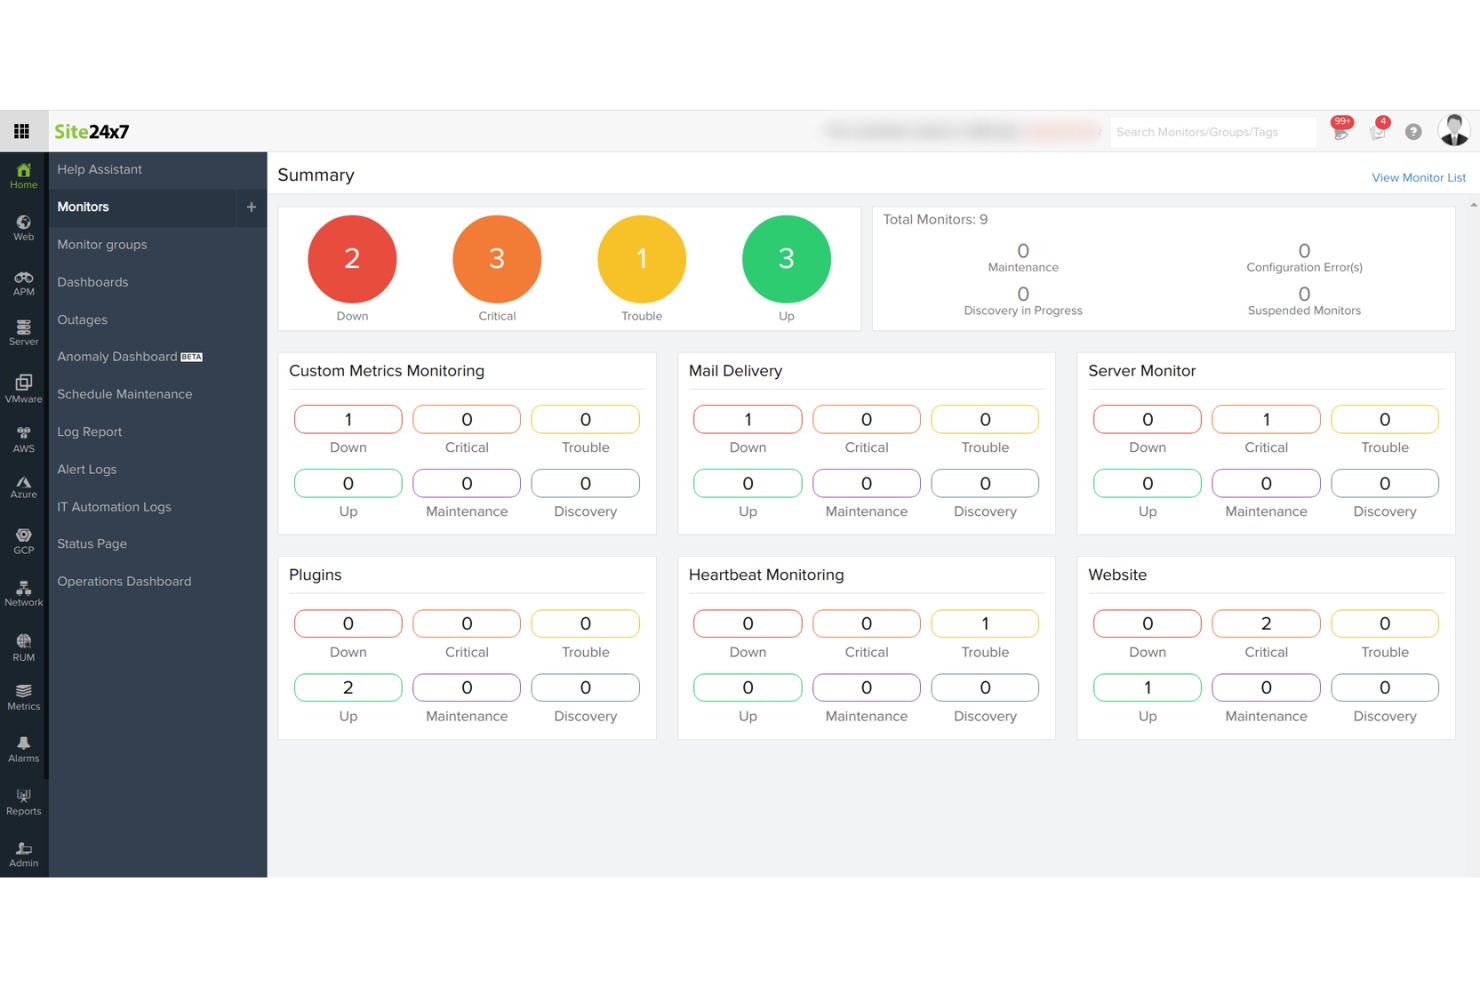
Site24x7 est une solution de surveillance tout-en-un conçue pour les équipes IT et DevOps, offrant des services tels que la surveillance de sites web, serveurs, cloud, réseau et performance des applications. Elle est particulièrement utile pour les organisations qui gèrent des réseaux hybrides, des dispositifs IoT et une infrastructure cloud en plus du matériel traditionnel. Grâce à son large support de protocoles et à ses modèles d’appareils, Site24x7 vous aide à surveiller tout, des routeurs et commutateurs aux pare-feu et machines virtuelles.
Pour qui Site24x7 est-il le mieux adapté ?
Les équipes IT et d’infrastructure cloud des petites aux grandes entreprises disposant d’environnements hybrides. Il convient aux sociétés qui ont besoin d’une large couverture des appareils et applications à travers des réseaux locaux et cloud.
Pourquoi j’ai choisi Site24x7
J’ai choisi Site24x7 car il est conçu pour gérer des environnements où la diversité des appareils est la norme. Son support de SNMP, NetFlow, et un large éventail de modèles de dispositifs signifie que vous pouvez surveiller aussi bien les commutateurs anciens que les appareils cloud modernes en un seul endroit. J’apprécie sa capacité à découvrir et classifier automatiquement les appareils, évitant la configuration manuelle à chaque nouvelle intégration. Ceci fait de Site24x7 un excellent choix pour les équipes qui doivent surveiller un mélange de ressources matérielles, virtuelles et basées dans le cloud.
Fonctionnalités clés de Site24x7
D’autres fonctionnalités qui rendent Site24x7 précieux pour la surveillance réseau incluent :
- Tableaux de bord de performance : Affichent des métriques et états en temps réel pour tous les appareils surveillés.
- Alertes personnalisables : Permettent de définir des seuils et de recevoir des notifications via plusieurs canaux.
- Analyse du trafic réseau : Fournit des informations sur l’utilisation de la bande passante et les principales sources de trafic grâce à NetFlow, sFlow et d’autres protocoles.
- Gestion de la configuration : Suit et gère les modifications de configuration des appareils à travers votre réseau.
Intégrations de Site24x7
Les intégrations incluent ServiceNow, PagerDuty, Jira, Microsoft Teams, Slack, Nagios, AWS, Azure, Google Cloud Platform, Docker, et Kubernetes.
Pros and Cons
Pros:
- Tableaux de bord et rapports personnalisables
- Alertes et notifications en temps réel
- Surveillance complète
Cons:
- Personnalisation limitée des mécanismes d’alerte
- Complexité de la configuration initiale dans les grands environnements
New Product Updates from Site24x7
Site24x7 Adds Synchronization Statuses for MSPs
Site24x7 now provides MSPs enhanced alerts and synchronization statuses in a centralized notification center to spot configuration sync issues sooner and accelerate incident response. For more information, visit Site24x7's official site.

Dynatrace
Idéal pour la surveillance réseau dans des environnements complexes
Dynatrace est conçu pour les équipes informatiques qui gèrent des environnements réseau très distribués, dynamiques ou hybrides. Il convient particulièrement aux grandes entreprises et aux prestataires de services qui ont besoin d'une visibilité approfondie sur les dépendances réseau, les microservices et les architectures cloud natives. Grâce à son analyse des causes racines basée sur l'intelligence artificielle et son observabilité full-stack, Dynatrace vous aide à détecter rapidement les problèmes dans des infrastructures complexes et multi-couches.
Pour qui Dynatrace est-il le plus adapté ?
Les responsables des opérations informatiques et les équipes d’ingénierie des plateformes dans les grandes organisations du secteur de la finance, du commerce de détail et de la technologie. Il convient aux entreprises qui gèrent des environnements hybrides complexes et qui requièrent une visibilité avancée sur les dépendances réseau et applicatives.
Pourquoi j'ai choisi Dynatrace
Ce qui m'a attiré chez Dynatrace, c'est sa conception spécialement pensée pour les organisations ayant des environnements réseau complexes et en constante évolution. Son moteur Davis, alimenté par l'IA, détecte automatiquement les anomalies et identifie les causes racines à travers les infrastructures hybrides, cloud et sur site. J’apprécie que Dynatrace offre une visibilité complète sur toute la pile, ce qui permet de remonter les incidents du réseau jusqu’aux applications et services. Cela en fait un excellent choix pour les équipes qui doivent surveiller des environnements dynamiques et à grande échelle sans passer à côté de dépendances critiques.
Fonctionnalités clés de Dynatrace
Parmi les fonctionnalités qui distinguent Dynatrace pour la surveillance réseau :
- Cartographie topologique Smartscape : Visualise en temps réel les relations entre les composants réseau, les services et leurs dépendances.
- Traçage distribué : Suivi des requêtes lorsqu'elles circulent entre microservices et couches réseau.
- Tableaux de bord personnalisés : Permet de créer des vues adaptées sur la santé réseau et les indicateurs de performance.
- Supervision synthétique : Simule des interactions utilisateur pour tester la disponibilité du réseau et des applications depuis plusieurs emplacements.
Intégrations Dynatrace
Les intégrations comprennent Active Directory, Adobe Analytics, Akka, Amazon DynamoDB, Ansible Tower, Azure Virtual Machines, Gremlin, LaunchDarkly et Zenduty.
Pros and Cons
Pros:
- Peut analyser la latence réseau et la perte de paquets
- Planification de capacité et prévisions pour les ressources réseau
- Alertes et notifications en cas de panne réseau
Cons:
- Aucune formule gratuite
- La structure tarifaire est complexe
Autres options de logiciels de surveillance réseau
Voici quelques options supplémentaires à considérer. Bien qu’elles ne figurent pas dans ma liste des 12 meilleurs, elles méritent tout de même d’être prises en compte :
- Datadog
Idéal pour les petites entreprises
- NinjaOne
Idéal pour la gestion des terminaux et la conformité des correctifs
- Netdata
Idéal pour la surveillance d'infrastructure en temps réel
- Wireshark
Idéal pour l'analyse de paquets
- Zabbix
Meilleure gamme de fonctionnalités
- LogicMonitor
Idéal pour la surveillance réseau basée sur le cloud
- SysAid
Idéal pour la surveillance réseau et la gestion des tickets ITSM
- WhatsUp Gold
Idéal pour une surveillance réseau complète
- New Relic
Idéal pour les utilisateurs avancés et experts
- Nagios XI
Idéal pour les grandes entreprises
- Prometheus
Meilleur outil gratuit de supervision réseau
- Munin Monitoring
Meilleure option gratuite
- Zenoss
Idéal pour la surveillance des infrastructures informatiques hybrides
- OPSWAT Security Score
Idéal pour les analyses de sécurité Windows
- Syncro
Idéal pour la surveillance illimitée des points de terminaison
- ManageEngine Applications Manager
Idéal pour la surveillance applicative
- Dotcom Monitor
Idéal pour les tests API & web multi-étapes


Autres tests associés
- Logiciels de surveillance réseau
- Logiciels de surveillance serveur
- Solutions SD-Wan
- Outils de surveillance d’infrastructure
- Analyseur de paquets réseau
- Outils de surveillance applicative
Comment j'évalue les logiciels de surveillance réseau
Je divise mon évaluation en deux niveaux : les capacités de base que chaque outil doit posséder—comme la découverte SNMP, l'alerte en temps réel et l'analyse de flux—et les éléments différenciateurs qui placent les meilleures options au-dessus du lot.
Fonctionnalité de base (Critères indispensables pour cette liste)
Ces capacités de base servent de critères d'acceptation pour l'inclusion dans ma liste de logiciels de surveillance réseau :
- Découverte de périphériques & du réseau : Je vérifie si un outil peut découvrir automatiquement les routeurs, commutateurs, points d'accès et serveurs sur plusieurs sous-réseaux, et cartographier leurs relations de couche 2/3 sans des heures de saisie manuelle.
- Surveillance des performances en temps réel : Les intervalles de sondage, l'étendue des métriques et la couverture des capteurs sont cruciaux ici—je recherche le suivi de la bande passante, de la latence, du CPU, de la mémoire et des interfaces à des intervalles pertinents.
- Prise en charge multi-protocole : Les outils qui ne gèrent que SNMP et ICMP laissent des lacunes. J’évalue si la plateforme prend également en charge NetFlow/sFlow/IPFIX, WMI et syslog pour une visibilité complète de la pile.
- Moteur d'alertes & de notifications : J'examine la configuration des seuils, les voies d'escalade et les options de canaux—email, SMS, Slack, PagerDuty—ainsi que la capacité des alertes à supprimer les notifications redondantes liées aux dépendances.
- Visualisation de la topologie & tableaux de bord : Je recherche une carte de topologie interactive et en temps réel qui reflète l'état réel des appareils, ainsi que des tableaux de bord personnalisables selon le rôle ou le site.
- Rapports historiques & analyses : J’évalue les politiques de conservation des données, les modèles de rapports pour le suivi des SLA, et la capacité des données historiques à orienter les décisions de planification de capacité plusieurs mois à l'avance.
Je donne à chaque fournisseur une note de 0 (ne propose pas la fonction) à 5 (excellent dans ce domaine) pour chacun des critères.
Les fournisseurs doivent obtenir un score moyen minimal pour figurer sur ma liste. Ensuite, j'examine ce qui distingue chaque plateforme.
Facteurs différenciateurs (Ce qui distingue les fournisseurs)
Une fois ma liste réalisée, voici comment je compare et analyse les différents fournisseurs de logiciels de surveillance réseau :
Fonctionnalités remarquables
La détection d'anomalies basée sur l'IA et l'inspection approfondie des paquets peuvent changer la donne pour diagnostiquer des problèmes de performance complexes que de simples sondages ne sauraient identifier. Je recherche également des capacités de surveillance hybride et cloud, particulièrement lorsque les entreprises exploitent des réseaux couvrant bureaux, datacenters et environnements cloud publics. L'architecture multi-locataire se démarque pour les MSP ou les grandes entreprises ayant besoin d'une séparation propre entre clients ou sites. La gestion de la configuration réseau devient essentielle lorsque des changements fréquents d'appareils exigent des versions faciles à suivre et des retours rapides en arrière.
Au-delà des fonctionnalités
La structure de licence compte ici—une tarification par appareil ou par capteur peut changer drastiquement le coût total avec l'évolution du réseau. J’évalue aussi la profondeur d'intégration avec les outils ITSM, puisque l'automatisation de la génération de tickets à partir des alertes génère de véritables gains de temps opérationnels. La flexibilité de déploiement est un autre facteur déterminant; certaines équipes ont besoin d'un contrôle sur site pour des réseaux isolés, tandis que d'autres profitent de solutions SaaS. Enfin, je vérifie la présence d'un RBAC, SSO et journalisation des audits pour m'assurer que la plateforme répond aux exigences des environnements réglementés.
Comment choisir un logiciel de surveillance réseau
Il est facile de se perdre dans des listes de fonctionnalités interminables et des structures tarifaires complexes. Pour vous aider à rester concentré lors de votre sélection logicielle, voici une liste de critères à garder à l’esprit :
| Critère | Que prendre en compte |
|---|---|
| Scalabilité | Le logiciel peut-il accompagner la croissance de votre entreprise ? Pensez à vos besoins futurs et vérifiez si l’outil peut gérer davantage de données et d’appareils sans perte de performance. |
| Intégrations | Vérifiez la compatibilité avec vos outils existants. Garantissez une circulation fluide des données entre les systèmes. Donnez la priorité aux logiciels qui se connectent facilement à vos plateformes clés comme votre CRM ou votre ERP. |
| Personnalisation | Optez pour une solution flexible pour les tableaux de bord et rapports. Pouvez-vous adapter le logiciel à votre façon de travailler ? Évitez les outils trop rigides qui n’évoluent pas avec vos besoins. |
| Simplicité d’utilisation | Pensez à la prise en main par vos équipes. L’interface est-elle intuitive ? Un outil nécessitant une formation lourde peut freiner l’adoption et la productivité. |
| Mise en œuvre et intégration | Évaluez le processus d’installation et les ressources nécessaires. Sous quel délai serez-vous pleinement opérationnel ? Vérifiez aussi les ressources et le support disponibles lors du déploiement. |
| Coût | Comparez les modèles de tarification. Y a-t-il des frais cachés ou des coûts supplémentaires pour certaines fonctionnalités ? Assurez-vous que l’abonnement correspond à votre budget actuel et futur. |
| Sécurité | Examinez les mesures de protection des données. Le logiciel respecte-t-il les standards du secteur ? Privilégiez le chiffrement, le contrôle d’accès et des mises à jour de sécurité régulières pour protéger vos informations sensibles. |
Qu'est-ce qu'un logiciel de surveillance réseau ?
Les logiciels de surveillance réseau sont utilisés par les professionnels de l'informatique et les administrateurs systèmes pour suivre et gérer les performances et la disponibilité des composants réseau. Ils collaborent souvent avec des éditeurs spécialisés dans l’optimisation du WAN afin de garantir un fonctionnement optimal et efficace des systèmes.
Des alertes en temps réel, l’analyse de la bande passante et des fonctions de suivi des appareils aident à identifier rapidement les problèmes, optimiser les performances et maintenir la santé du réseau. Les outils de cartographie réseau complètent ces capacités de surveillance en fournissant une visualisation de la topologie et des relations entre les dispositifs. Globalement, ces outils offrent des informations essentielles qui renforcent la fiabilité et la sécurité du réseau.
Fonctionnalités
Lors du choix d'un logiciel de surveillance réseau, veillez à prendre en compte les fonctionnalités clés suivantes :
- Surveillance réseau en temps réel : Cette fonctionnalité vous permet de visualiser en direct les données sur la performance du réseau et la santé des équipements. Vous pouvez ainsi repérer immédiatement les pannes ou lenteurs soudaines et agir rapidement, sans être pris au dépourvu.
- Alertes personnalisables : Créez des notifications adaptées selon les seuils de performance ou incidents spécifiques. Ces alertes vous aident à réagir avant que les problèmes ne s’aggravent.
- Rapports complets : Obtenez des rapports détaillés résumant l’activité réseau, les tendances de performance et l’état des appareils. Utilisez ces informations pour cibler les zones à risque et démontrer les améliorations auprès de votre équipe (ou de votre direction !).
- Découverte et cartographie des appareils : Le logiciel analyse et identifie automatiquement les dispositifs connectés à votre réseau. Cette cartographie facilite le suivi des nouveaux appareils ou non-autorisés et renforce la sécurité réseau.
- Analyse de l’utilisation de la bande passante : Surveillez quels appareils ou applications consomment le plus de bande passante. Ceci vous aide à résoudre les problèmes de congestion et à appliquer des politiques d’utilisation équitables pour la satisfaction de tous.
- Conservation des données historiques : Consultez les indicateurs de performance passés du réseau pour repérer les problèmes récurrents ou les tendances à long terme. Grâce à ces données, vous planifiez mieux les mises à jour et pouvez prévenir de futures pannes.
- Compatibilité multi-éditeurs : Un support matériel et logiciel de multiples fournisseurs vous permet de monitorer l’ensemble de votre réseau, même si vos équipements sont issus de différents constructeurs.
- Surveillance à distance : Accédez à votre tableau de bord de surveillance de réseau en toute sécurité, où que vous soyez. Ainsi, vous gardez le contrôle que vous soyez au bureau ou en télétravail.
- Outils de dépannage automatisé : Profitez de diagnostics intégrés qui recommandent, voire réalisent, des corrections de base. Ceci vous fait gagner du temps et résout les problèmes courants sans intervention approfondie.
Avantages
L’implémentation d’un logiciel de surveillance réseau procure de nombreux avantages à votre équipe et à votre entreprise. Voici quelques bénéfices :
- Évolutivité : La cartographie automatisée du réseau et des fonctionnalités flexibles accompagnent la croissance de l’entreprise en s’adaptant à l’augmentation des besoins. Ceci contribue de manière significative aux objectifs stratégiques de l’organisation.
- Fiabilité accrue du réseau : Les alertes en temps réel et l’analyse prédictive aident à éviter les interruptions en traitant les problèmes avant leur aggravation.
- Sécurité renforcée : La détection des anomalies et le suivi des dispositifs permettent d’identifier les menaces potentielles et les vulnérabilités, assurant la protection de votre réseau.
- Performance optimisée : L’analyse de la bande passante garantit une utilisation optimale des ressources et un fonctionnement plus fluide du réseau.
- Prise de décisions éclairée : Des tableaux de bord personnalisables fournissent des informations adaptées à vos besoins, facilitant la planification stratégique et la gestion.
- Réduction des coûts opérationnels : Un suivi proactif limite le recours aux interventions d’urgence et réduit le risque de pannes coûteuses.
- Meilleure expérience utilisateur : Le monitoring synthétique garantit la disponibilité et la performance des services pour des utilisateurs satisfaits.
Coûts et tarification
Le choix d’un logiciel de surveillance réseau requiert une bonne compréhension des différents modèles tarifaires et des offres proposées. Les coûts varient en fonction des fonctionnalités, de la taille de l’équipe, des modules additionnels et d’autres critères. Le tableau ci-dessous récapitule les plans courants, leurs prix moyens, ainsi que les fonctionnalités typiquement incluses dans les solutions de surveillance réseau :
Tableau comparatif des plans pour logiciels de surveillance réseau
| Type de forfait | Prix moyen | Fonctionnalités courantes |
|---|---|---|
| Forfait gratuit | $0 | Fonctionnalités de surveillance de base, alertes limitées et support communautaire. |
| Forfait personnel | $5-$25/utilisateur/mois | Alertes en temps réel, tableaux de bord personnalisables et rapports de base. |
| Forfait business | $30-$75/utilisateur/mois | Analyses avancées, fonctionnalités de sécurité renforcées et options d'intégration. |
| Forfait entreprise | $100-$250/utilisateur/mois | Surveillance complète, support prioritaire, analyses prédictives et nombreuses options de personnalisation. |
FAQ sur les logiciels de surveillance réseau
Vous trouverez ici des réponses aux questions courantes sur la surveillance réseau et les outils de surveillance réseau.
Que surveille réellement un logiciel de surveillance réseau ?
Comment la surveillance du réseau améliore-t-elle la sécurité ?
Peut-elle surveiller à la fois les réseaux sur site et dans le cloud ?
Quels sont les avantages des alertes automatiques en surveillance réseau ?
À quelle fréquence faut-il analyser les performances du réseau ?
Prochaine étape :
Si vous êtes en train de rechercher un logiciel de surveillance réseau, contactez gratuitement un conseiller SoftwareSelect pour des recommandations personnalisées.
Vous remplissez un formulaire et échangez rapidement avec un expert qui prend en compte vos besoins spécifiques. Vous recevrez ensuite une liste restreinte de logiciels à examiner. Ils vous accompagnent même tout au long du processus d'achat, y compris dans la négociation des prix.