Die 10 besten Serverüberwachungstools im Test 2026

Beste Server-Überwachungstools Übersicht


Die beste Server-Überwachungssoftware hilft Teams, Leistungsprobleme frühzeitig zu erkennen, Ausfallzeiten zu reduzieren, die Ressourcennutzung zu verfolgen und wichtige Systeme zuverlässig am Laufen zu halten. Diese Tools geben IT- und Betriebsteams die notwendige Transparenz, um zu verstehen, wie sich Server unter Belastung verhalten, und ermöglichen es, zu reagieren, bevor Benutzer betroffen sind.
Teams suchen oft nach Server-Überwachungslösungen, wenn Fehlkonfigurationen zu Ausfällen führen, manuelle Überprüfungen Warnzeichen übersehen lassen oder Sicherheitslücken in zentraler Infrastruktur unentdeckt bleiben. Diese Probleme verursachen Verlangsamungen, unerwartete Ausfälle und stellen Teams vor Herausforderungen bei der Koordination der Fehlerbehebung in komplexen Umgebungen.
Mit über 20 Jahren Branchenerfahrung als Chief Technology Officer habe ich Dutzende Server-Überwachungsplattformen in realen Umgebungen getestet und bewertet – insbesondere hinsichtlich Genauigkeit, Integrationsmöglichkeiten und Benutzerfreundlichkeit. Dieser Leitfaden stellt die führenden Server-Überwachungssoftwares vor, die die Systemzuverlässigkeit verbessern, eine schnellere Reaktion bei Vorfällen ermöglichen und Teams helfen, eine vorhersehbare Performance aufrechtzuerhalten. Jede Bewertung behandelt Funktionen, Vor- und Nachteile sowie die besten Einsatzbereiche, um die Auswahl des passenden Tools zu erleichtern.
Warum Sie unseren Software-Bewertungen vertrauen können
Wir testen und bewerten seit 2023 Software. Als Technologie-Führungskräfte wissen wir, wie kritisch und herausfordernd es ist, die richtige Entscheidung bei der Softwareauswahl zu treffen.
Wir investieren viel in gründliche Recherche, um unserer Zielgruppe zu helfen, bessere Kaufentscheidungen zu treffen. Wir haben über 2.000 Tools für verschiedene Technikanwendungsfälle getestet und mehr als 1.000 umfassende Softwarebewertungen geschrieben. Erfahren Sie wie wir transparent bleiben und unsere Methodik der Softwarebewertung.
Zusammenfassung der besten Server-Überwachungstools
Diese Vergleichstabelle fasst die Preisinformationen meiner Top-Auswahl an Server-Überwachungstools zusammen, um Ihnen zu helfen, das passende für Ihr Budget und Ihre geschäftlichen Anforderungen zu finden.
| Tool | Best For | Trial Info | Price | ||
|---|---|---|---|---|---|
| 1 | Am besten für Endpunktverwaltung und Patch-Compliance | 14-tägige kostenlose Testversion verfügbar | Preis auf Anfrage | Website | |
| 2 | Am besten geeignet für die Überwachung von Servern in Echtzeit | 30-tägige kostenlose Testversion | Ab $179/Monat (jährlich abgerechnet) | Website | |
| 3 | Am besten für agentenloses Windows-Server-Monitoring geeignet | 14-tägige kostenlose Testversion verfügbar | Preise auf Anfrage | Website | |
| 4 | Beste Open-Source-Lösung | Kostenloser Tarif verfügbar | Preis auf Anfrage | Website | |
| 5 | Am besten geeignet für kontinuierliche Serverüberwachung | Kostenlose Demo verfügbar | Ab $245/25 Geräte | Website | |
| 6 | Am besten für großflächige Serverüberwachung geeignet | Kostenloser Tarif + 30-tägige kostenlose Testphase verfügbar | Ab $225/Monat (jährlich abgerechnet) | Website | |
| 7 | Am besten geeignet für umfangreiches Server-Metrik-Tracking | Kostenlose Demo + 30-tägige kostenlose Testphase verfügbar | Ab $9/Monat (jährlich abgerechnet) | Website | |
| 8 | Am besten für KI-gestützte Anwendungsleistung | 15-tägige kostenlose Testversion | Ab $7/Monat | Website | |
| 9 | Am besten geeignet für verteiltes Tracing und Fehlerbehebung | Kostenloser Tarif + gratis Demo verfügbar | Ab $26/Monat (jährliche Abrechnung) | Website | |
| 10 | Am besten geeignet für cloudbasierte Infrastrukturüberwachung | 14-tägige kostenlose Testphase + kostenloser Tarif verfügbar | Ab $15/Host/Monat (jährlich abgerechnet) | Website |
-

TestDevLab
Visit Website -
Site24x7
Visit WebsiteThis is an aggregated rating for this tool including ratings from Crozdesk users and ratings from other sites.4.7 -
GitHub Actions
Visit WebsiteThis is an aggregated rating for this tool including ratings from Crozdesk users and ratings from other sites.4.8


Bewertungen der besten Server-Überwachungstools
Im Folgenden finden Sie meine ausführlichen Zusammenfassungen der Server-Überwachungstools, die es auf meine Shortlist geschafft haben. Meine Reviews geben einen detaillierten Einblick in die wichtigsten Funktionen, Vor- & Nachteile, Integrationen und idealen Anwendungsfälle jedes Tools, damit Sie das passende finden.
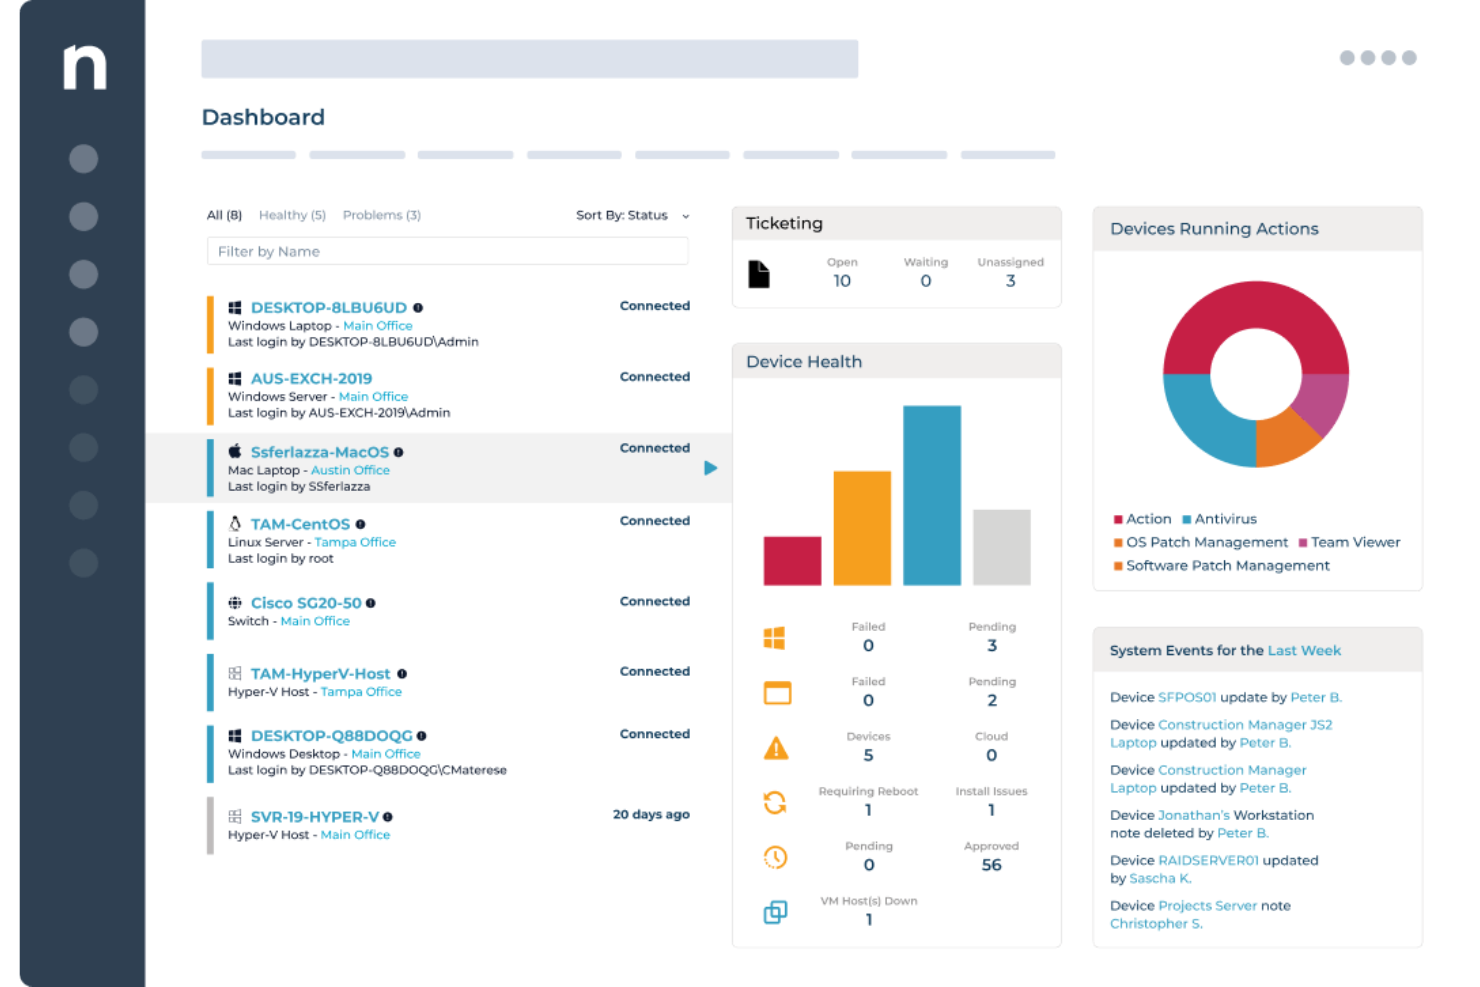
NinjaOne bietet IT-Teams und Managed Service Providern eine einheitliche Plattform zur Überwachung von Servern, zur Automatisierung von Patch-Prozessen und zur Verwaltung von Endpunkten in verteilten Umgebungen. Dadurch wird die Ausfallzeit reduziert und die Infrastrukturüberwachung vereinfacht.
Für wen ist NinjaOne am besten geeignet?
NinjaOne ist besonders geeignet für MSPs und interne IT-Teams, die eine große Anzahl von Servern und Endpunkten über mehrere Standorte oder Kundenumgebungen hinweg verwalten.
Warum ich NinjaOne ausgewählt habe
Ich habe NinjaOne ausgewählt, weil sein Patch-Management den gesamten Compliance-Lebenszyklus abdeckt und nicht nur die Bereitstellung. Die Patch Intelligence-Funktion analysiert Telemetrie- und Bereitstellungssignale, um instabile Updates automatisch zu kennzeichnen und riskante Patches zu pausieren, bevor sie die Umgebung beeinträchtigen. Sie können Patch-Richtlinien basierend auf der Geräte-Rolle definieren, sodass Server mit unterschiedlichen Workloads nach verschiedenen Zeitplänen – ganz ohne manuelles Eingreifen – gepatcht werden. Darüber hinaus bietet das Compliance-Reporting einen klaren, bedarfsgerechten Überblick darüber, was gepatcht wurde, was noch aussteht und wo Schwachstellen an jedem Endpunkt bestehen.
Wichtige Funktionen von NinjaOne
- Echtzeitüberwachung von Endpunkten: Überwachen Sie den Gerätezustand, die Konfigurationen und den Compliance-Status aller Endpunkte zentral über eine cloud-native Konsole.
- Automatisierte Endpunkt-Fehlerbehebung: Nutzen Sie bedingungsbasierte Skripte, um Endpunkt-Probleme automatisch – ohne manuellen Eingriff durch Techniker – zu erkennen und zu beheben.
- Software- und Betriebssystem-Bereitstellung: Rollen Sie Windows-Software, Updates und Konfigurationen mittels wiederholbarer, automatisierter Workflows auf Endpunkte aus.
- Hardware- und Software-Inventarisierung: Verschaffen Sie sich einen Echtzeit-Überblick über jedes Gerät in Ihrer Umgebung, inklusive Hardware-Spezifikationen, installierter Software und Garantie-Status.
NinjaOne Integrationen
NinjaOne bietet native Integrationen mit ConnectWise, Autotask, Zendesk, Webroot, Bitdefender, TeamViewer, Splashtop, Acronis und mit dem Microsoft-Ökosystem, einschließlich Microsoft 365 und Azure. Eine API für individuelle Integrationen steht zur Verfügung.
Pros and Cons
Pros:
- Umfassende API-Dokumentation
- Flexibles Reporting mit benutzerdefinierten Metriken
- Automatische Endpunkterkennung
Cons:
- Gelegentliche Verzögerungen bei der Bereitstellung von Patches
- Komplexes Einrichten von Benachrichtigungen für nicht standardisierte Ereignisse
New Product Updates from NinjaOne
NinjaOne Adds Windows Agent Deployment to Network Discovery
NinjaOne adds Windows agent deployment directly from Network Discovery. This update helps IT teams move from discovering unmanaged Windows devices to monitoring, patching, and managing them faster. For more information, visit NinjaOne’s official site.
 .
.Am besten geeignet für die Überwachung von Servern in Echtzeit
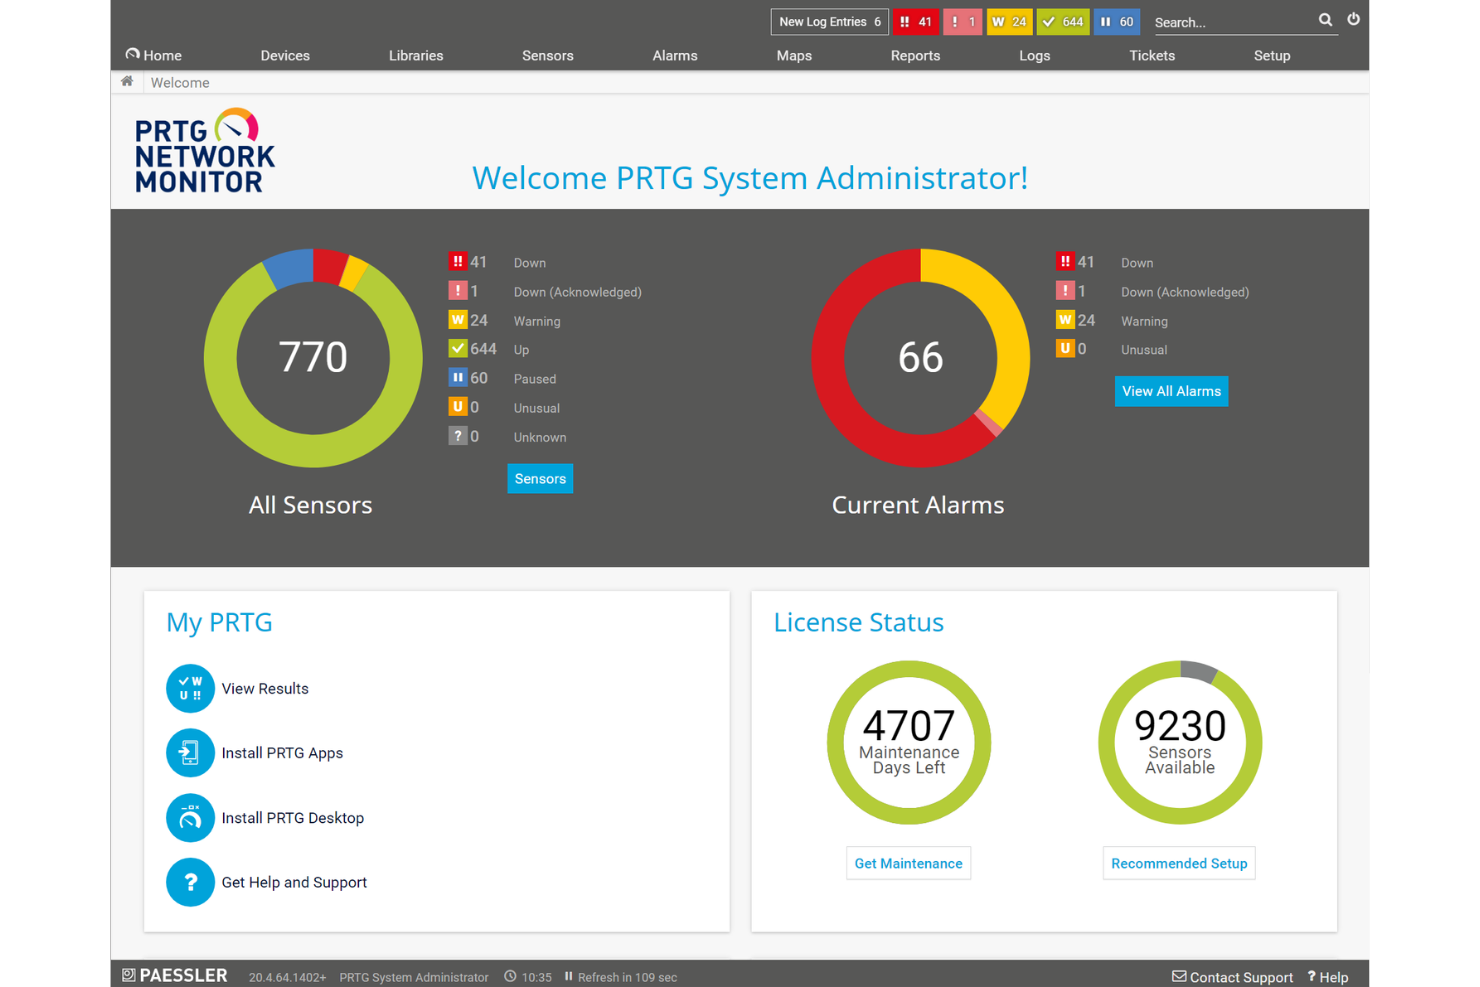
PRTG ist ein vielseitiges Server-Überwachungstool, das für kleine bis mittelgroße Netzwerke entwickelt wurde. Es hilft IT-Teams, ihre gesamte Infrastruktur zu überwachen, einschließlich Mail-, Web-, Datenbank-, Datei-, virtuellen und Cloud-Servern.
Warum ich PRTG ausgewählt habe: Dieses Tool ist aufgrund seiner Anpassungsfähigkeit und Benutzerfreundlichkeit ideal für kleine bis mittelgroße Netzwerke. Mit über 250 vorkonfigurierten Sensortypen kann Ihr Team sofort mit der Echtzeitüberwachung beginnen. Benachrichtigungen per E-Mail und SMS halten Sie über Probleme auf dem Laufenden und ermöglichen schnelles Troubleshooting. PRTG bietet außerdem eine dynamische Anpassung an Serverumgebungen, was perfekt für wachsende oder sich verändernde Netzwerke ist.
Herausragende Funktionen & Integrationen:
Funktionen beinhalten Echtzeit-Benachrichtigungen, die Sie stets informieren, anpassbare Berichte für detaillierte Einblicke sowie eine dynamische Anpassung an sich entwickelnde Serverlandschaften.
Integrationen umfassen AWS, Azure, VMware, Citrix XenServer, HPE ProLiant, Dell PowerEdge, Cisco UCS und verschiedene IT-Partner.
Pros and Cons
Pros:
- Für eine Vielzahl von Netzwerkgrößen skalierbar
- Anpassbare Überwachung und Benachrichtigungen
- Benutzerfreundliche visuelle Oberfläche
Cons:
- Hohe Kosten bei größeren Implementierungen
- Für fortgeschrittene Funktionen besteht möglicherweise eine gewisse Lernkurve
New Product Updates from Paessler PRTG
PRTG Introduces New Monitoring Sensors In Beta
This week, PRTG introduces three BETA sensors that broaden your monitoring scope for Proxmox VE clusters and SIMATIC S7-300/400 PLCs, giving you deeper operational insights. For more information, visit PRTG’s official site.
 .
.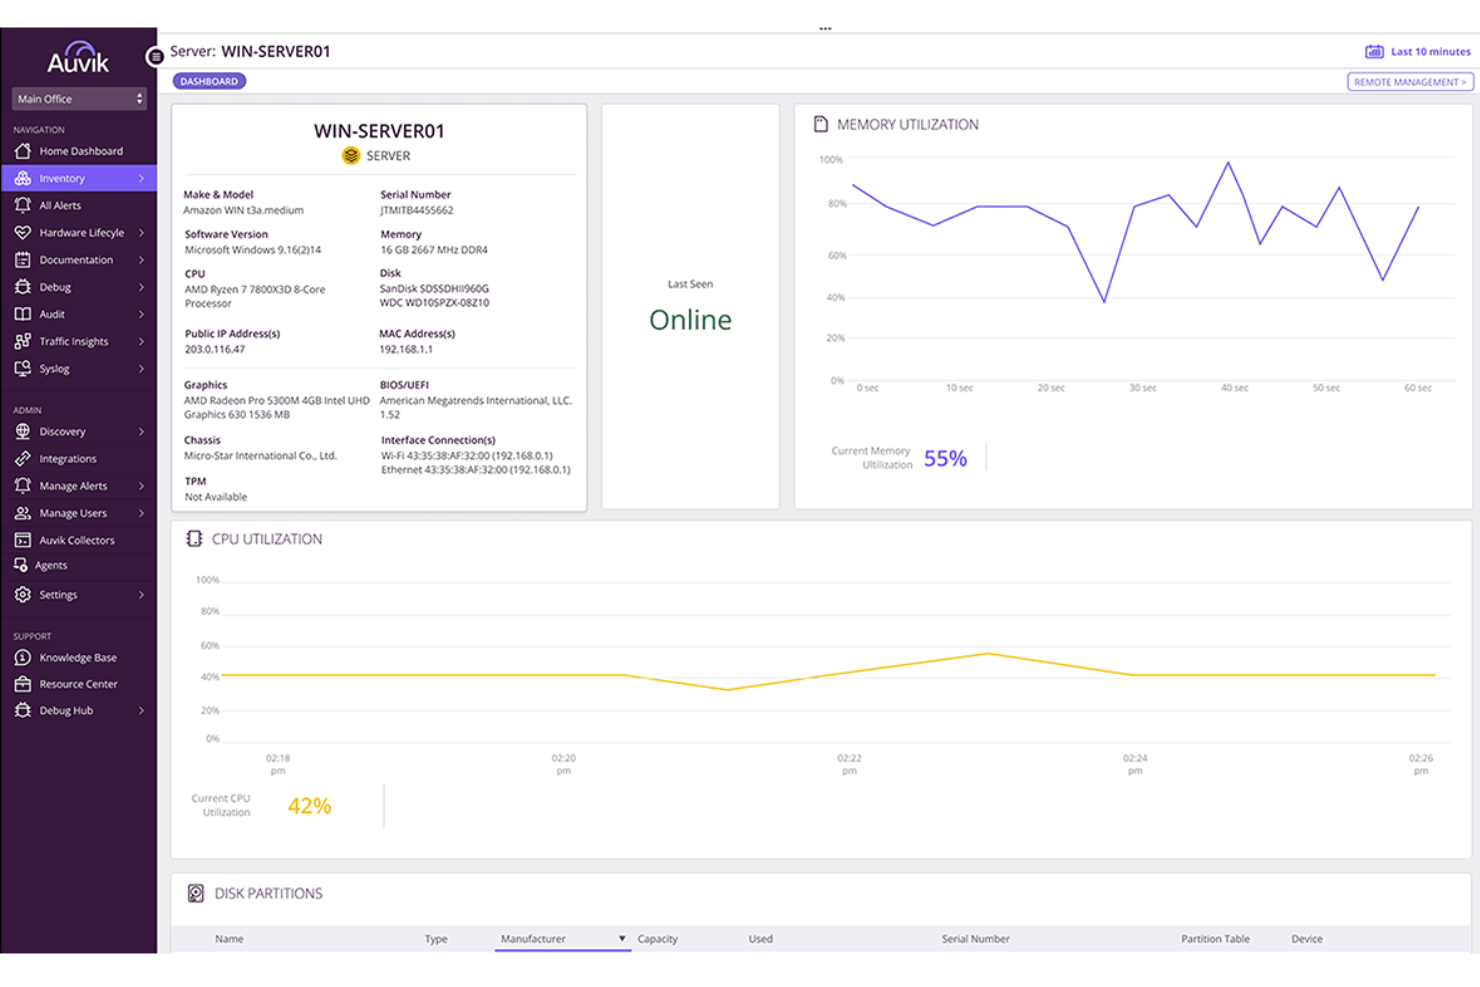
Auvik ist für IT-Teams und MSPs entwickelt, die zuverlässige, unkomplizierte Transparenz für Windows-Server benötigen, ohne Agenten zu installieren oder komplexe Setups zu verwalten. Es kartiert automatisch Ihre Umgebung, überwacht die Servergesundheit in Echtzeit und warnt Sie, bevor Leistungsprobleme Benutzer beeinträchtigen.
Warum ich Auvik ausgewählt habe
Ich habe mich für Auvik entschieden, weil seine agentenlose Erkennung und Überwachung es ermöglicht, die Windows-Server-Gesundheit sofort zu überwachen, ohne jede Maschine einzeln anfassen zu müssen. Sie beugen Ausfallzeiten mit Echtzeit-Benachrichtigungen für CPU-, Speicher- und Diensteschwellenwerte vor, sodass Ihr Team Zeit hat, zu reagieren, bevor die Leistung sinkt. Die Kapazitätsplanung wird dank Trenddaten und historischer Vergleichswerte einfacher, da sie helfen, erste Warnsignale von Ressourcenengpässen zu erkennen. Sie verbessern auch das Troubleshooting mit Netzwerk- und Server-Kontext auf einer einheitlichen Topologiekarte, was die Ursachenanalyse beschleunigt. Und da Auvik Konfigurations-Backups und -Wiederherstellung übernimmt, gewinnt Ihr Team eine zusätzliche Absicherung gegen Fehlkonfigurationen oder fehlgeschlagene Updates.
Auvik Hauptfunktionen
Basierend auf seinen Stärken im Echtzeitmonitoring helfen diese Funktionen Teams, stabile Serverumgebungen zu erhalten.
- Inventarverwaltung: Erfasst automatisch detaillierte Server- und Geräteinformationen zur Prüfung.
- Netzwerkverkehrsanalyse: Zeigt, welche Anwendungen und Endpunkte Ressourcen verbrauchen.
- Topologie-Visualisierung: Stellt Gerätebeziehungen dar, um eine schnellere Fehlersuche zu unterstützen.
- Bandbreitennutzungs-Tracking: Hebt Spitzen und Nutzungsmuster hervor, die die Serverleistung beeinflussen.
Auvik Integrationen
Integrationen umfassen ConnectWise, Kaseya, N-able, Cisco, Juniper, Meraki, HPE und Palo Alto Networks.
Pros and Cons
Pros:
- Automatisierte Konfigurations-Backups schützen vor fehlerhaften Änderungen
- Echtzeit-Benachrichtigungen helfen Teams, zu reagieren, bevor die Leistung nachlässt
- Agentenloses Monitoring ermöglicht einen schnellen Einstieg für Windows-Server
Cons:
- Erweiterte Funktionen können zusätzliche Einrichtung und Anpassung erfordern
- Begrenzte Unterstützung für Linux und andere Nicht-Windows-Server
New Product Updates from Auvik
Auvik Adds Aurora Troubleshooting Assistance
Auvik introduces Aurora Troubleshooting Assistance with AI-powered troubleshooting guidance, possible root causes, conversation downloads, and feedback tools. The open beta helps IT teams diagnose network issues faster with contextual recommendations tailored to specific devices and alerts. For more information, visit Auvik's official site.
 .
.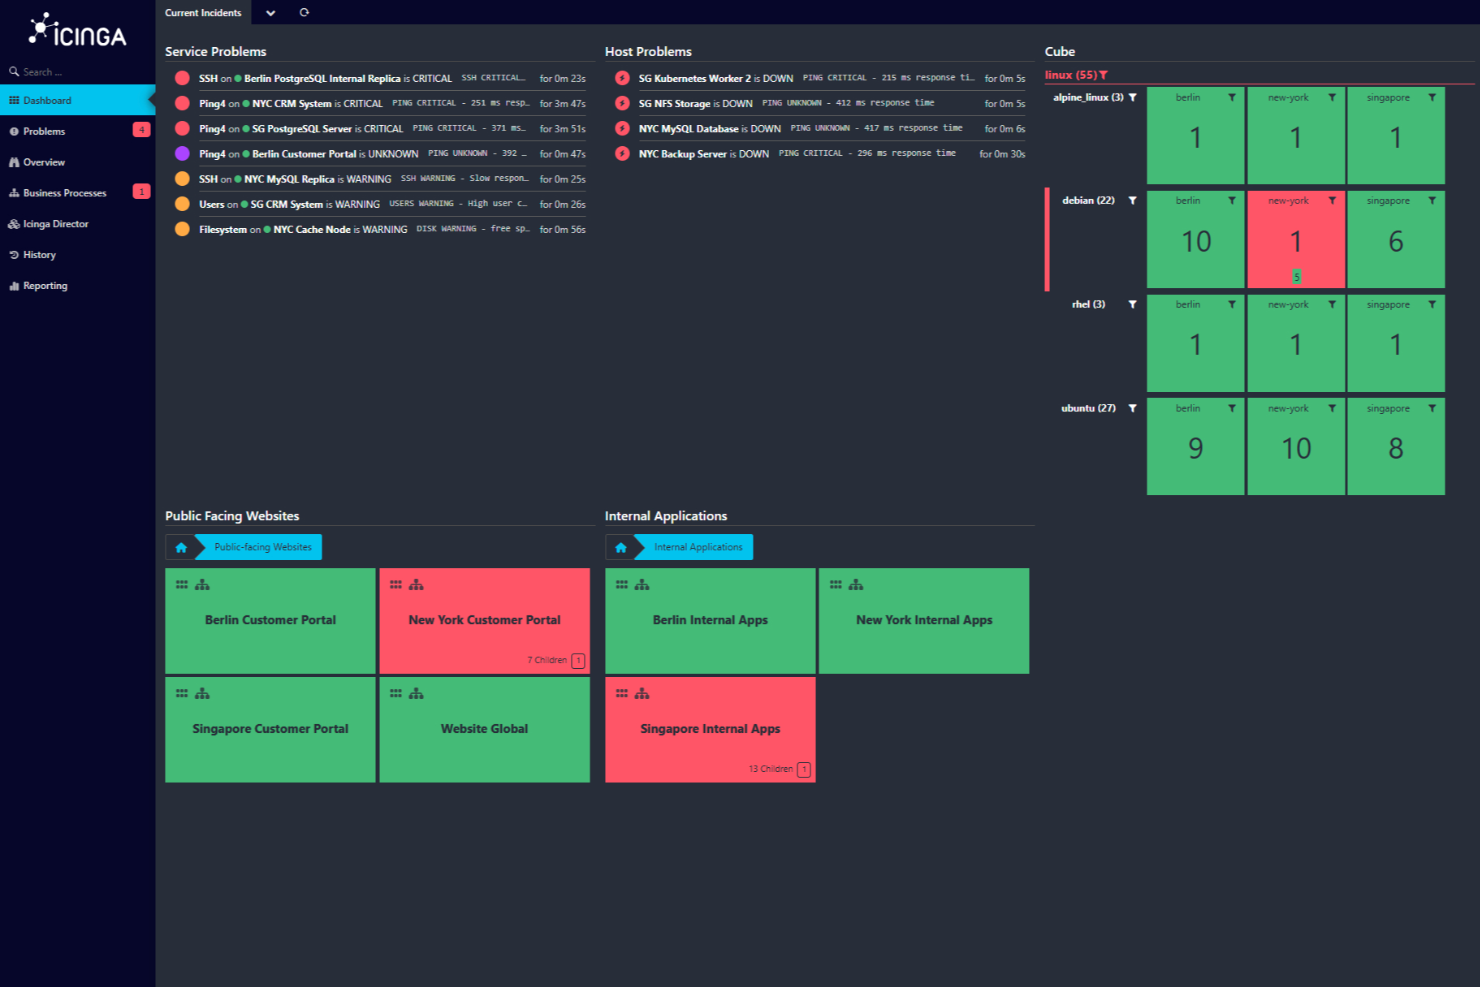
Icinga ist eine Open-Source-Überwachungslösung, die für komplexe IT-Umgebungen entwickelt wurde. Sie bietet eine Vielzahl von Produkten und Lösungen zur Überwachung von Servern, Netzwerken, Clouds und Anwendungen.
Warum ich Icinga gewählt habe: Ich habe Icinga gewählt, weil es von Haus aus umfangreiche Konnektivitätsprüfungen bietet. Es überwacht grundlegende Verbindungen wie Ping, SSH, TCP, UDP und RDP, sodass Sie sofort sehen, wenn ein Server nicht mehr erreichbar ist. Darüber hinaus kann es Systemressourcen wie CPU, Festplatte, Arbeitsspeicher, Serverlast, Betriebszeit, Protokolle, Updates, Anwendungszustand, Container und mehr mittels Agent oder SSH erfassen. Die Plattform bietet zudem Flexibilität bei Datenspeicherung und Visualisierung. Icinga kann seine Leistungsdaten in jede beliebige Zeitreihendatenbank übertragen – darunter Graphite, InfluxDB, OpenTSDB und weitere.
Hervorstechende Funktionen & Integrationen:
Funktionen umfassen automatisches Clustering für hohe Verfügbarkeit, bei dem der Icinga-Agent über TLS durch einen einzelnen, firewallfreundlichen Port zu Parent-Knoten oder Satelliten kommuniziert. Dadurch lässt sich die Überwachung einfach und ohne Firewall-Probleme auf verschiedene Zonen verteilen. Die Lösung unterstützt außerdem die Überwachung von SSL-Zertifikaten – einschließlich Scans und Benachrichtigungen bei Ablauf von Zertifikaten oder dem Erstellen benutzerdefinierter Trust Stores.
Integrationen gibt es unter anderem für Grafana, AWS, Azure, Puppet, Ansible, Chef, Terraform, Jira, PagerDuty, ServiceNow, BigPanda und Stackstorm.
Pros and Cons
Pros:
- Kostenlos nutzbar, keine Einrichtungsgebühren
- Skalierbar für kleine und große Umgebungen
- Hochgradig anpassbar für verschiedene IT-Infrastruktur-Bedürfnisse
Cons:
- Vereinzelt werden Performance-Probleme bei hoher Last gemeldet
- Einrichtung und Konfiguration erfordern Einarbeitung
New Product Updates from Icinga

Icinga Adds TOTP Two-Factor Authentication to Icinga Web
Icinga added time-based one-time password (TOTP) two-factor authentication to Icinga Web, helping organizations strengthen login security with an additional verification step. For more information, visit Icinga’s official site.
 .
.Am besten geeignet für kontinuierliche Serverüberwachung
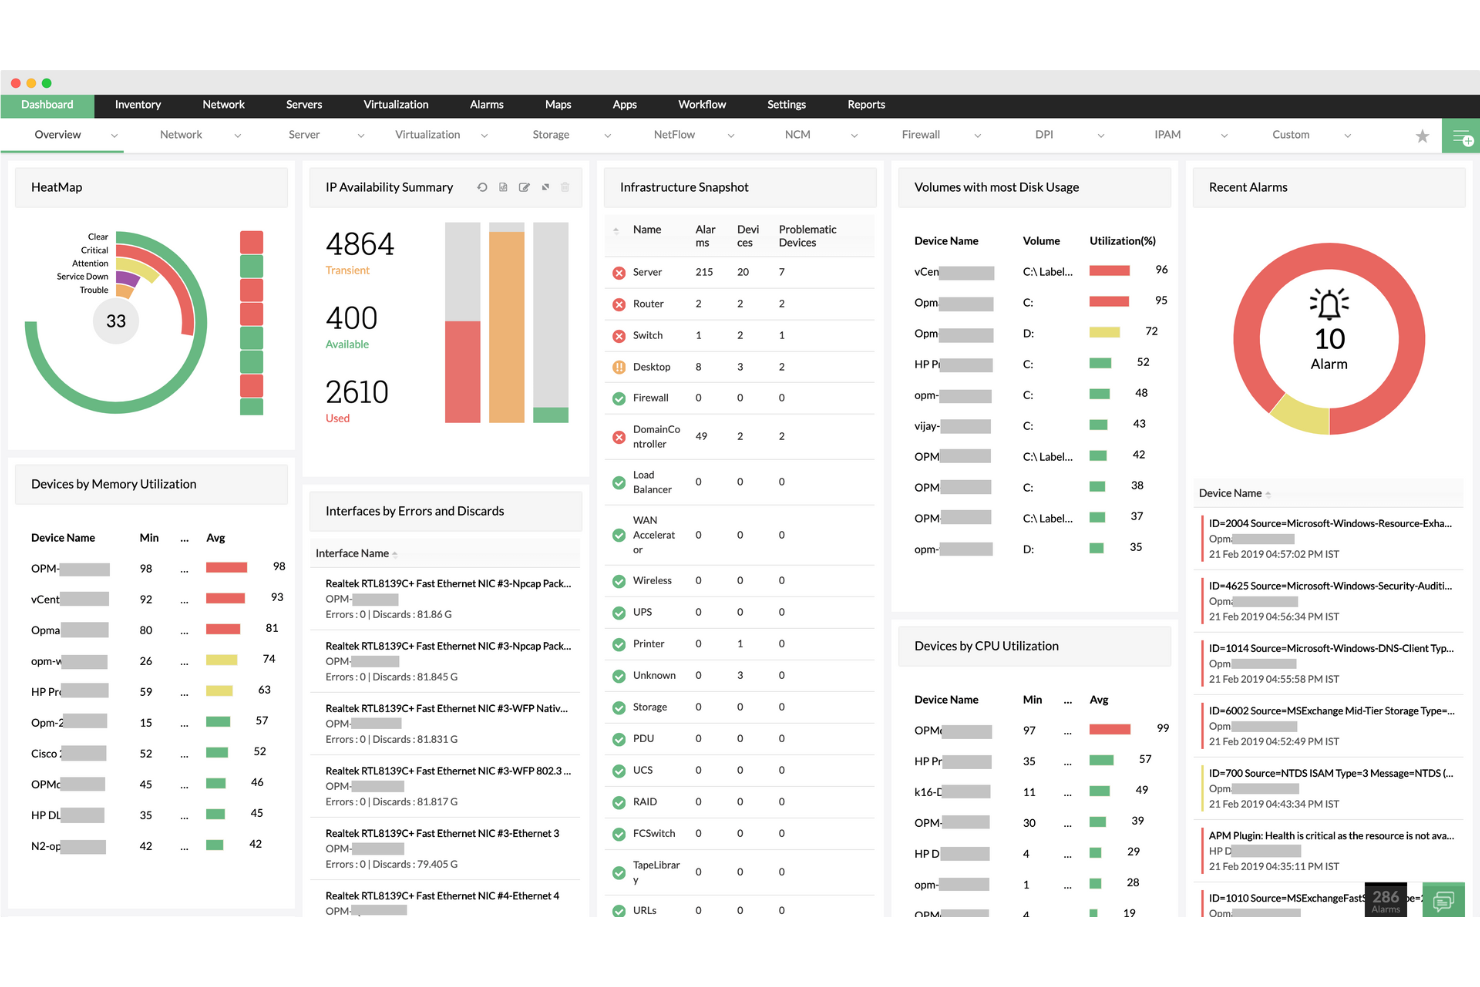
ManageEngine OpManager ist ein Server-Überwachungstool, das Ihnen hilft, Ihre Netzwerkteilnehmer und Server mit Echtzeitüberwachung, Alarmierung und Berichterstattung im Blick zu behalten, um potenzielle Probleme zu lösen, bevor sie Ihr Unternehmen beeinträchtigen. Cameron Rimington, Gründer und CEO von IronPDF, bemerkte: „Mit der Netzwerkkartierung können wir sehen, wie Daten über unsere Server und Stacks fließen. Sie zeigte sofort, wo Anfragen hängen blieben, und half uns so, gelegentliche Verlangsamungen ohne Rätselraten zu diagnostizieren.“
Warum ich ManageEngine OpManager ausgewählt habe: OpManager bietet eine kontinuierliche Überwachung der Serverleistung, Betriebszeit und Gesundheit, sodass Ihre Server durch ständige Abfragen über Protokolle wie ICMP, SNMP, WMI und TCP betriebsbereit bleiben. Mit dieser Echtzeitüberwachung können Sie schnell auf I/O-Anfragen reagieren und eine nahtlose Konnektivität für Endbenutzer gewährleisten. Zusätzlich überwacht OpManager Paketverlust und Antwortzeiten, um Latenzprobleme, die vom Server ausgehen, zu erkennen und zu beheben.
Herausragende Funktionen & Integrationen:
Funktionen umfassen Überwachung der Serververfügbarkeit, Dienst- und Prozessmanagement, anpassbare Dashboards, Echtzeit-Benachrichtigungen, Überwachung von Sicherheitsprotokollen, Einstellung von Leistungsschwellenwerten, automatisierte Workflows, Remote-Prozessdiagnostik, Nachverfolgung von Paketverlusten, Überwachung von Antwortzeiten, Hochverfügbarkeitsüberwachung und Unterstützung für benutzerdefinierte Dienste.
Integrationen umfassen ServiceDesk Plus, ServiceNow, Jira, Slack, Microsoft Teams, Analytics Plus, AlarmsOne, REST API und Webhook-Integrationen.
Pros and Cons
Pros:
- Umfassende Überwachungsfunktionen
- Echtzeit-Benachrichtigungen
- Skalierbarkeit für wachsende Netzwerke
Cons:
- Komplexe Ersteinrichtung
- Gelegentliche Update-Probleme
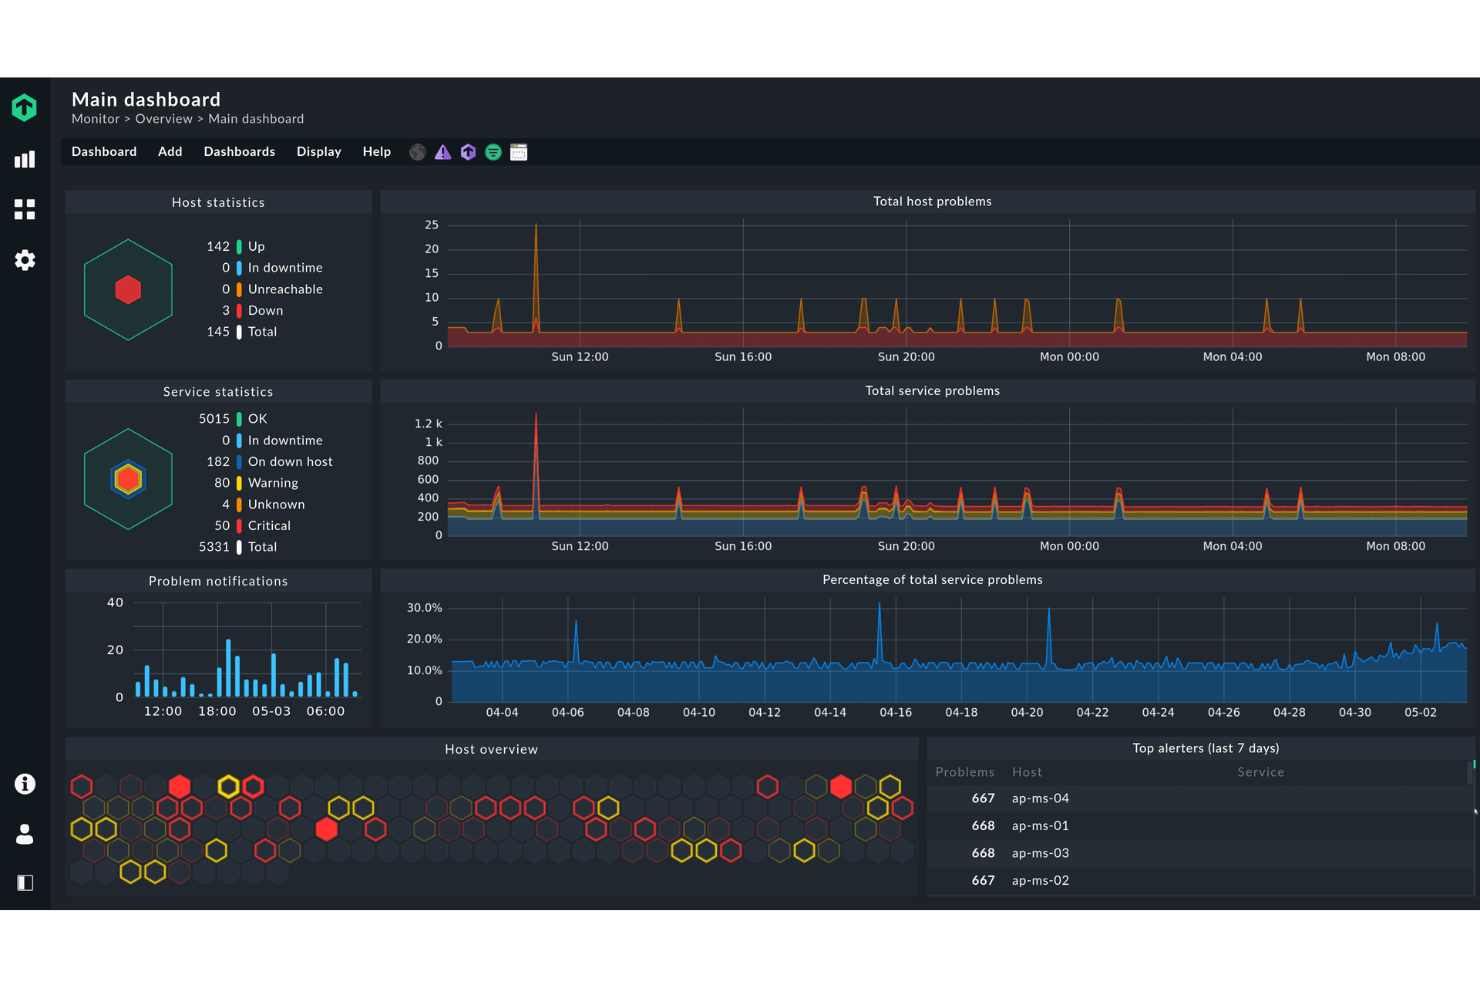
Checkmk ist ein Serverüberwachungstool, das für IT-Administratoren und Fachleute entwickelt wurde, die Echtzeitmetriken benötigen. Es verfolgt effizient verschiedene Infrastrukturelemente, um optimale Leistung und schnelle Problemlösung sicherzustellen.
Warum ich Checkmk ausgewählt habe: Es ist ideal für alle, die Echtzeitmetriken benötigen und bietet umfassende Dashboards, die sich innerhalb von Sekunden aktualisieren. Das Tool bietet leistungsstarke Visualisierungsmöglichkeiten, damit Ihr Team Probleme sofort erkennt. Außerdem verfügt es über ein flexibles Benachrichtigungssystem, mit dem Sie die Benachrichtigungen nach Ihren Bedürfnissen anpassen können. Die umfangreichen Überwachungsfähigkeiten von Checkmk decken alles ab – von Servern bis zu Anwendungen – und machen es dadurch zu einer vielseitigen Option.
Herausragende Funktionen & Integrationen:
Funktionen umfassen die automatische Erkennung von Netzwerkgeräten, anpassbare Dashboards für personalisierte Ansichten sowie ein leistungsstarkes Alarmsystem, das Ihr Team über kritische Probleme informiert hält.
Integrationen umfassen AWS, Azure, Docker, Kubernetes, VMware, Cisco, Dell, HP, Microsoft und SAP.
Pros and Cons
Pros:
- Skalierbare Überwachung
- Anpassbare Dashboards
- REST API für die Integration mit Drittanbieter-Tools
Cons:
- Komplexe Einrichtung
- Mögliche Lernkurve für Einsteiger
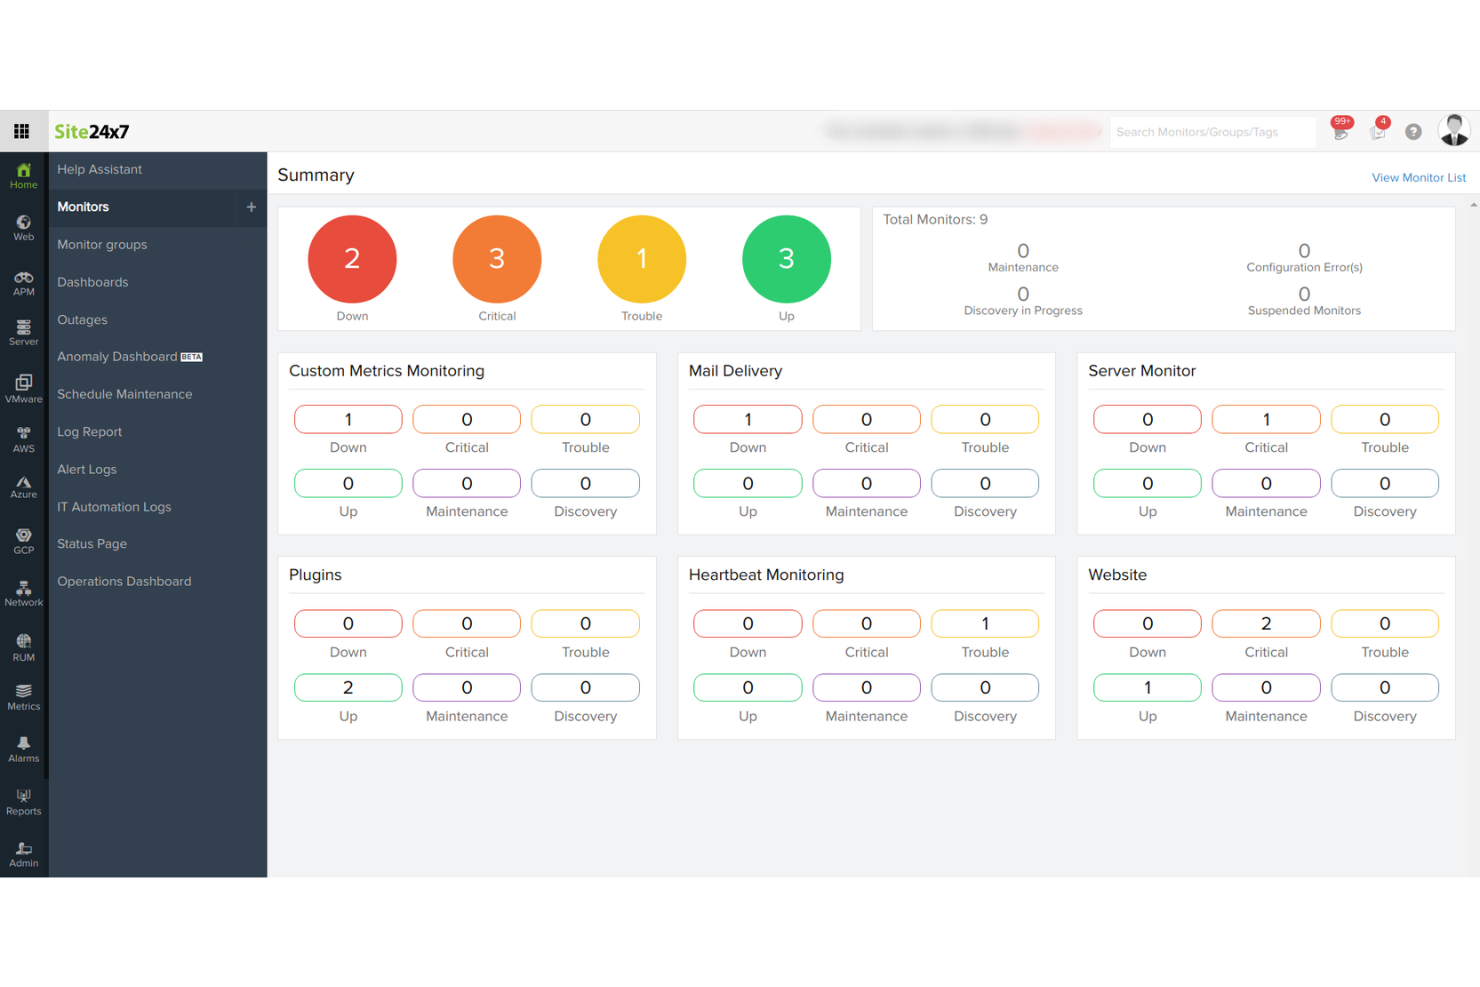
Site24x7 ist ein cloudbasiertes Server-Überwachungstool, das sich an IT-Betriebs- und DevOps-Teams richtet. Es bietet umfassendes Monitoring für Websites, Server, Anwendungen und Netzwerk-Infrastrukturen, um eine optimale Leistung und Verfügbarkeit sicherzustellen.
Warum ich Site24x7 ausgewählt habe: Es ist ideal für cloudbasiertes Monitoring und bietet Funktionen wie Echtzeit-Leistungsüberwachung und detaillierte Analysen, die Ihrem Team helfen, die Verfügbarkeit aufrechtzuerhalten. Dank der Bereitstellung über die Cloud können Sie von überall darauf zugreifen, was besonders für verteilte Teams praktisch ist. Automatisierte Benachrichtigungen informieren Sie über potenzielle Probleme, sodass Sie schnell reagieren können. Site24x7 bietet außerdem synthetisches Monitoring, mit dem Sie Benutzerinteraktionen simulieren und Probleme erkennen können, bevor sie reale Nutzer beeinträchtigen.
Herausragende Funktionen & Integrationen:
Funktionen beinhalten synthetisches Monitoring zur Simulation von Benutzerinteraktionen, detaillierte Analysen für Leistungseinblicke und Echtzeit-Leistungsüberwachung, um Probleme schnell zu erkennen.
Integrationen umfassen AWS, Azure, Google Cloud, Docker, Kubernetes, VMware, Slack, Microsoft Teams, PagerDuty und ServiceNow.
Pros and Cons
Pros:
- Umfassende Überwachungsmöglichkeiten
- Echtzeit-Benachrichtigungen und Warnungen
- Anpassbare Dashboards und Berichte
Cons:
- Komplexität bei der Ersteinrichtung in großen Umgebungen
- Eingeschränkte Anpassungsmöglichkeiten bei Warnmechanismen
New Product Updates from Site24x7

Site24x7 Adds Discovery Issues for AWS Monitoring
Site24x7 added Discovery Issues for AWS monitoring, helping teams identify why resources are not being discovered across services and regions. The feature surfaces permission gaps, policy restrictions, and blocked API actions to support faster troubleshooting. For more information, visit Site24x7’s official site.
 .
.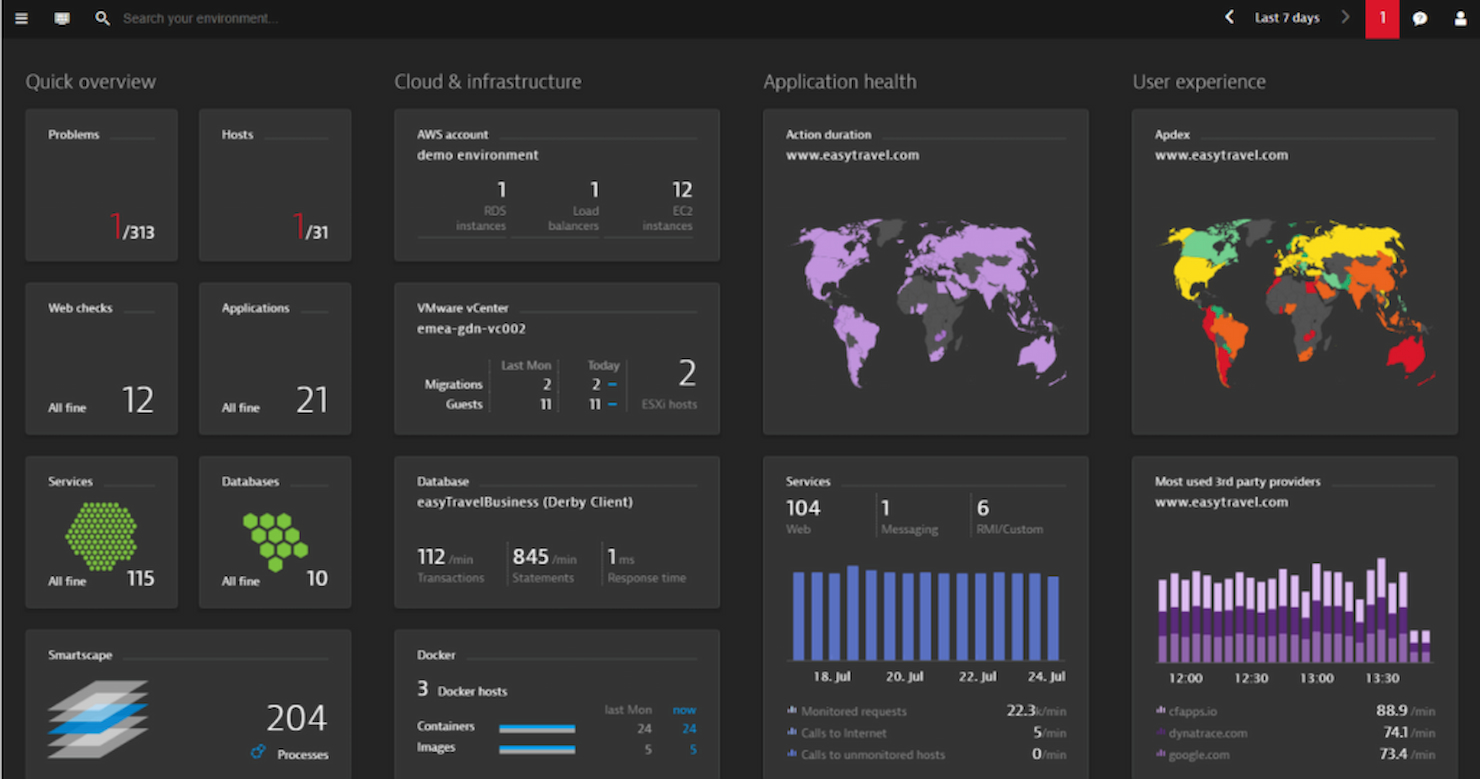
Dynatrace ist ein Server-Überwachungstool, das sich an IT-Teams in Unternehmen und DevOps-Fachleute richtet. Es bietet End-to-End-Transparenz für Anwendungen und Infrastruktur und unterstützt Unternehmen dabei, eine optimale Leistung aufrechtzuerhalten.
Warum ich Dynatrace gewählt habe: Es überzeugt durch KI-gestützte Einblicke und bietet eine automatische Ursachenanalyse, mit der Ihr Team Probleme schnell beheben kann. Die KI-Funktionen des Tools ermöglichen eine präzise Anomalieerkennung, sodass potenzielle Probleme frühzeitig erkannt werden. Mit dem umfassenden Full-Stack-Monitoring können Sie Anwendungen, Infrastruktur und Benutzererfahrung an einem Ort überwachen. Dynatrace bietet zudem eine Echtzeitanalyse der Daten, die schnelle und fundierte Entscheidungen ermöglicht.
Herausragende Funktionen & Integrationen:
Funktionen umfassen automatische Ursachenanalyse für eine schnelle Problemlösung, präzise Anomalieerkennung für die frühzeitige Erkennung von Problemen sowie umfassendes Full-Stack-Monitoring für vollständige Transparenz.
Integrationen umfassen AWS, Azure, Google Cloud, VMware, Kubernetes, Red Hat OpenShift, SAP, ServiceNow, Microsoft Teams und Slack.
Pros and Cons
Pros:
- Tiefgehende KI-gestützte Einblicke
- Umfassendes Anwendungsmonitoring
- Große Auswahl an Integrationen
Cons:
- Die Komplexität erfordert eine gezielte Schulung
- Die Einrichtung kann für Einsteiger herausfordernd sein
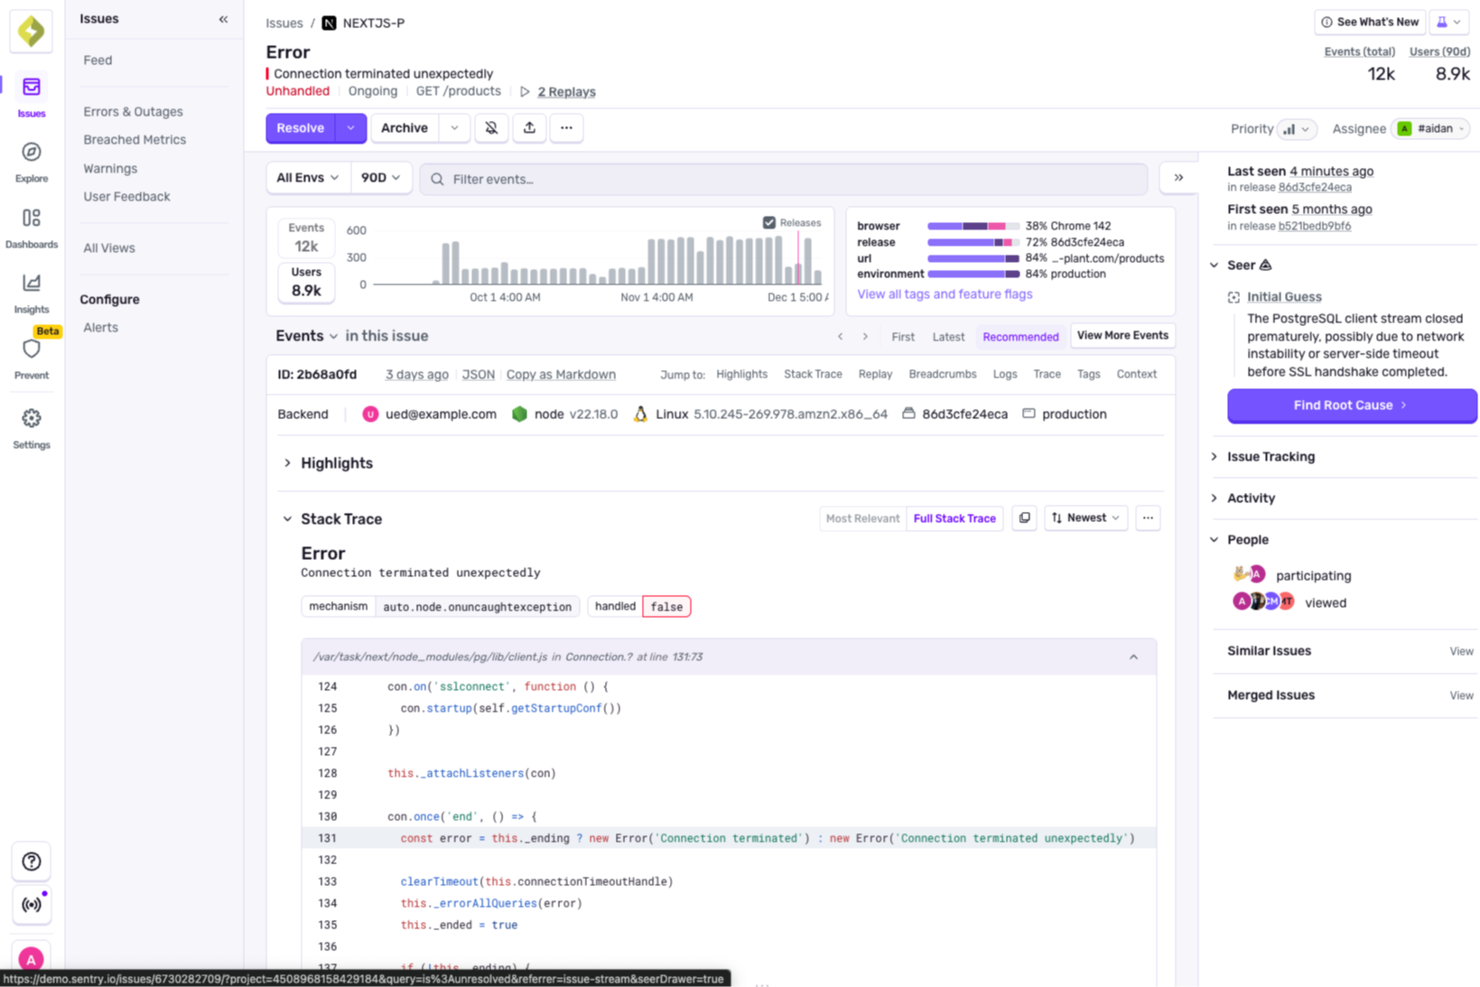
In einer Welt, in der Serverleistung entscheidend für reibungslose Abläufe ist, unterstützt Sentry Teams mit verteiltem Tracing und Fehlerbehebung neben den Kernfunktionen zur Überwachung. Sentry wurde entwickelt, um Web- und Mobile-Entwicklung, Gaming und E-Commerce zu bedienen und adressiert die Herausforderungen bei der Überwachung von Server-Gesundheit und Performance. Mit Tools wie Fehlerverfolgung, Sitzungswiedergabe und Uptime-Monitoring hilft es Teams, Probleme schneller zu finden und zu beheben, damit Anwendungen stabil und zuverlässig bleiben.
Warum ich Sentry ausgewählt habe
Ich habe Sentry wegen seines verteilten Tracings und der Fehlerbehebung ausgewählt, da diese Funktionen Teams dabei helfen, Serverprobleme dienstübergreifend nachzuverfolgen und Ursachen schneller zu finden. Die Fehlerverfolgung hebt Probleme in Echtzeit hervor und erleichtert es, Ausfälle zu beheben, bevor sie Benutzer betreffen. Die Sitzungswiedergabe zeigt, was während der Benutzerinteraktionen passiert ist, während das Uptime-Monitoring Teams alarmiert, wenn Dienste ausfallen, damit schnell reagiert werden kann.
Wichtige Funktionen von Sentry
Neben verteiltem Tracing und Fehlerbehebung bietet Sentry:
- Automatische Ursachenanalyse: Durch die Zuordnung von Vorfällen zu Releases und Codeänderungen hilft Sentry, die zugrundeliegenden Ursachen von Performance-Problemen schnell zu identifizieren.
- Integration mit Entwicklungs-Workflows: Lässt sich nahtlos mit beliebten Plattformen wie GitHub und Slack integrieren und fördert so effiziente Kommunikation und Zusammenarbeit.
- Sicherheit und Compliance: Hält branchenspezifische Standards zum Schutz von Nutzerdaten ein und sorgt dafür, dass Ihre Anwendungen sicher und konform bleiben.
Sentry-Integrationen
Integrationen umfassen GitHub, Slack, Jira, Bitbucket, GitLab, Trello, PagerDuty, Microsoft Teams, AWS Lambda und Datadog.
Pros and Cons
Pros:
- Effektive Frontend-Überwachung durch Sitzungswiedergabe
- Umfassendes Monitoring, inklusive Performance- und Crash-Berichtserstattung
- Starkes Fehler-Tracking mit Ausnahmenerfassung pro Nutzer
Cons:
- Komplexe Implementierung besonders für diverse Plattform-Stacks
- Geringere Abdeckung für Infrastrukturebene-Monitoring
New Product Updates from Sentry

Sentry Adds GitLab Support and gRPC Instrumentation
Sentry adds GitLab support for Seer and gRPC instrumentation for Dart and Flutter to improve root cause analysis, code tracing, and debugging workflows. For more information, visit Sentry’s official site.
 .
.Datadog
Am besten geeignet für cloudbasierte Infrastrukturüberwachung
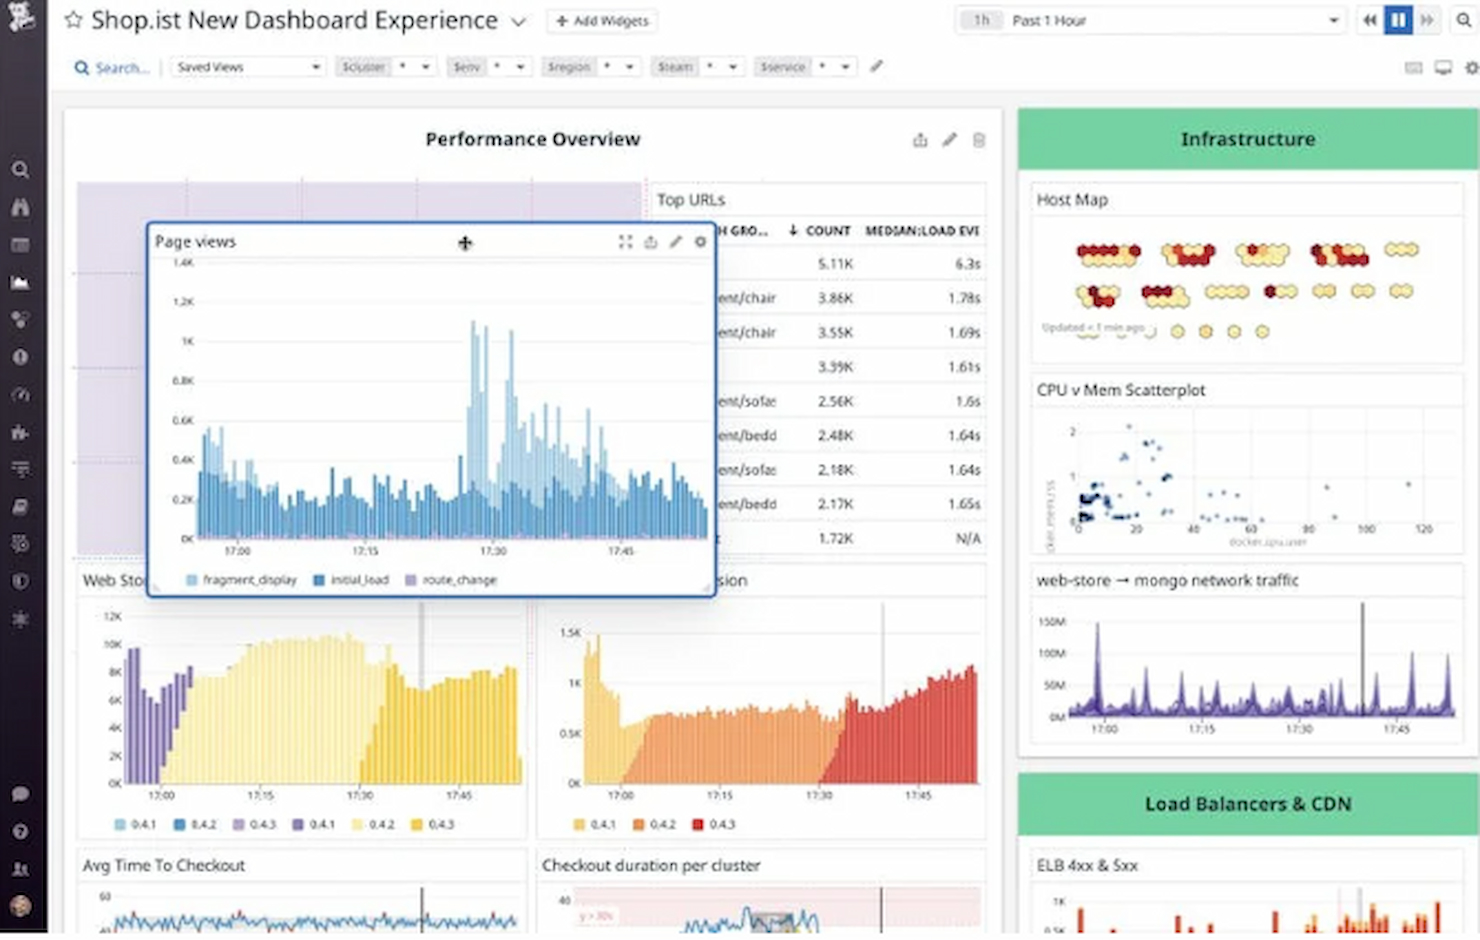
Datadog ist eine cloudbasierte Überwachungs- und Analyseplattform, die für IT- und DevOps-Teams entwickelt wurde. Sie bietet umfassendes Monitoring für Server, Datenbanken, Tools und Dienste, um sicherzustellen, dass Ihre Systeme effizient laufen.
Warum ich Datadog gewählt habe: Es ist speziell für das Monitoring in Cloud-Umgebungen ausgelegt und bietet Echtzeit-Transparenz über die Leistung Ihrer Infrastruktur. Die Dashboards sind anpassbar, sodass Sie sich auf die Metriken konzentrieren können, die für Ihr Team am wichtigsten sind. Automatisierte Warnmeldungen helfen Ihnen, Problemen proaktiv zu begegnen und eine schnelle Reaktion zu gewährleisten. Dank der Skalierbarkeit eignet sich Datadog besonders gut für wachsende Unternehmen, die ihre Infrastruktur zunehmend überwachen müssen.
Hervorstechende Funktionen & Integrationen:
Funktionen umfassen Echtzeit-Transparenz für eine effiziente Systemüberwachung, anpassbare Dashboards für gezielte Einblicke und automatisierte Warnmeldungen, um schnell auf Probleme zu reagieren.
Integrationen sind AWS, Azure, Google Cloud, Kubernetes, Docker, Slack, PagerDuty, Microsoft Teams, GitHub und Jira.
Pros and Cons
Pros:
- Speziell für Cloud-Umgebungen entwickelt
- Umfassendes Monitoring und Alerting
- Umfangreiche Integrationsliste
Cons:
- Einarbeitungszeit für fortgeschrittene Funktionen
- Zusätzliche Kosten für Extra-Features
Weitere Server-Überwachungstools
Hier sind einige zusätzliche Optionen für Server-Überwachungstools, die es zwar nicht auf meine Shortlist geschafft haben, aber dennoch einen Blick wert sind:
- Nagios
Am besten für umfassende Überwachung der IT-Infrastruktur
- LogicMonitor
Am besten geeignet für hybrides Infrastruktur-Monitoring
- AppDynamics
Am besten geeignet für die End-to-End-Verfolgung von Geschäftsprozessen
- New Relic
Am besten geeignet für Echtzeit-Analyse von Anwendungen
- Dotcom Monitor
Am besten für die Simulation realer Benutzerinteraktionen
- Sumo Logic
Gut geeignet für Protokollverwaltung und -analyse
- Atera
Ideal für integrierte RMM- und PSA-Lösungen
- Zabbix
Am besten geeignet für Skalierbarkeit bei großen Netzwerken
- WhatsUp Gold
Gut für Netzwerküberwachung und -visualisierung
- Netdata
Geeignet für die Echtzeit-Fehlerbehebung bei der Leistung
- Prometheus
Am besten für leistungsstarke Abfragefunktionen
- Sensu
Gut geeignet für flexible Überwachung über Plugins
- ManageEngine
Am besten für integriertes IT-Management


Wie ich Serverüberwachungstools bewerte
Serverüberwachungstools sind das, was einen Systemadministrator einem CPU-Peak um 3 Uhr morgens voraus sein lässt, einem NOC-Team hilft, kaskadierende Ausfälle über Hunderte von Knoten zu priorisieren, und SREs die Telemetriedaten liefert, die sie benötigen, um SLA-Zusagen einzuhalten. Wenn ich Tools in diesem Bereich bewerte, unterscheide ich zwischen den Mindestanforderungen, die jeder Kandidat erfüllen muss, um überhaupt auf die Liste zu kommen, und den Besonderheiten, die einzelne Tools für bestimmte Umgebungen und Teams auszeichnen.
Kernfunktionen (Grundvoraussetzungen für diese Liste)
Für Serverüberwachungstools teste und bewerte ich folgende Kernfunktionen:
- Echtzeit-Metriken: Ich prüfe, ob das Tool CPU, Speicher, Festplatten-I/O und Netzwerkdurchsatz mit einer Granularität bis auf Prozessebene unter Linux und Windows überwacht.
- Alarmierungs-Engine: Schwellenwertbasierte Alarme sind das Mindestmaß. Ich bewerte Eskalationsrichtlinien, Unterdrückung flatternder Alarme und Multikanal-Zustellung an Slack, PagerDuty oder E-Mail.
- Multi-OS-Unterstützung: Ihre Umgebung ist selten homogen. Ich achte auf native Unterstützung für Windows Server, wichtige Linux-Distributionen und idealerweise UNIX-Varianten.
- Auto-Erkennung: 200 Server manuell hinzuzufügen ist keine Option. Ich prüfe, ob das Tool ein Netzwerksegment scannen und neue Hosts automatisch überwachen kann.
- Dashboards & Visualisierung: Flottenweiter Statusüberblick, historische Trenddiagramme und anpassbare Layouts sind wichtig. Ich beurteile, wie schnell man vom Login zur Ursachenanalyse gelangt.
- Dienst- & Verfügbarkeitsprüfungen: Über das einfache Ping hinaus suche ich nach Prüfungen auf Port- und Dienstebene, die sicherstellen, dass Apache, MySQL oder Docker tatsächlich reagieren.
- Protokoll- & Ereigniskorrelation: Wenn eine Festplatte voll läuft und ein Dienst abstürzt, sollte das Tool diese Zusammenhänge erkennen. Ich bewerte, wie gut es verwandte Ereignisse über mehrere Server hinweg sichtbar macht.
Ein Tool muss die meisten dieser Funktionen bieten, um einen Platz auf der Liste zu bekommen. Anschließend schaue ich mir an, was die einzelnen Tools voneinander unterscheidet.
Herausragende Merkmale (Was die Kandidaten unterscheidet)
Ich achte auf native Cloud-Integration, die Metriken direkt aus AWS-, Azure- oder GCP-Konten zieht – das spart Stunden bei der Überwachung dynamischer Infrastrukturen. Einige herausragende Tools bieten eingebaute Anomalieerkennung und Prognosen, damit Teams Ressourcenspitzen erkennen, bevor sie zu Störungen führen. Ich prüfe außerdem die Bandbreite an Integrationen mit ITSM- und DevOps-Ökosystemen, da Benachrichtigungen, die direkt ins ServiceNow gelangen, oder die Möglichkeit, mit einem Webhook Remediations-Skripte auszulösen, einen großen Unterschied machen können.
Was für mich über die Features hinaus zählt
Das Bereitstellungsmodell ist hier sehr wichtig. Ich bewerte, ob ein Tool ausschließlich als SaaS, On-Premises oder beides angeboten wird, da Teams in regulierten Branchen oft vollständige Datenhoheit benötigen. Die Preisstruktur ist ein weiterer wichtiger Faktor: Kosten pro Host können bei großem Maßstab schnell ausufern, also prüfe ich, ob das Preismodell bei wachsender Serverlandschaft berechenbar bleibt. Außerdem betrachte ich, wie steil die Lernkurve ist, denn ein Tool, das Wochen an Konfigurationsdateibearbeitung erfordert, richtet sich an andere Käufer als eine Lösung mit geführten Einrichtungsassistenten und vordefinierten Monitoring-Vorlagen.
So wählen Sie Server-Überwachungstools aus
Es ist leicht, sich von langen Funktionslisten und komplexen Preisstrukturen überwältigen zu lassen. Damit Sie während Ihres individuellen Auswahlprozesses den Fokus behalten, finden Sie hier eine Checkliste mit wichtigen Entscheidungskriterien:
| Faktor | Worauf zu achten ist |
| Skalierbarkeit | Stellen Sie sicher, dass das Tool mit Ihrem Unternehmen mitwachsen kann. Suchen Sie nach Enterprise-Monitoring-Software, die eine steigende Datenmenge und Zuwachs an Nutzern ohne Leistungseinbußen bewältigen kann – besonders, wenn Sie expandieren. |
| Integrationen | Überprüfen Sie die Kompatibilität mit bestehenden Systemen. Das Tool sollte problemlos in Ihre aktuelle Softwarelandschaft integrierbar sein, etwa AWS, Azure oder Slack, um Zeit und Aufwand zu sparen. |
| Anpassbarkeit | Wählen Sie Tools, die es erlauben, Dashboards und Berichte individuell anzupassen. So erhält Ihr Team gezielt die benötigten Einblicke ohne unnötigen Ballast. |
| Benutzerfreundlichkeit | Bewerten Sie die Benutzeroberfläche auf ihre Intuitivität. Ihr Team sollte sich mühelos zurechtfinden, um die Einarbeitungszeit zu verkürzen und die Akzeptanz zu fördern. |
| Budget | Vergleichen Sie Preispläne, die zu Ihren finanziellen Rahmenbedingungen passen. Berücksichtigen Sie die Gesamtkosten inklusive versteckter Gebühren oder notwendiger Zusatzmodule, um Budgetüberschreitungen zu vermeiden. |
| Sicherheitsvorkehrungen | Setzen Sie Priorität auf Tools mit starken Sicherheitsmaßnahmen. Achten Sie auf Datenverschlüsselung, Zugriffskontrollen und die Einhaltung von Branchenstandards, um sensible Informationen zu schützen. |
| Zuverlässigkeit | Suchen Sie nach nachgewiesenen Verfügbarkeitsgarantien. Ein zuverlässiges Tool ermöglicht eine durchgehende Überwachung ohne häufige Ausfälle und sorgt so für reibungslose Abläufe. |
| Support-Optionen | Prüfen Sie Verfügbarkeit und Qualität des Kundensupports. Zugang zu 24/7-Support, dedizierten Account Managern und umfassenden Hilferessourcen ist entscheidend. |
Trends bei Server-Monitoring-Tools
Für meine Recherchen habe ich zahlreiche Produktaktualisierungen, Pressemitteilungen und Release Notes verschiedener Anbieter für Server-Monitoring-Tools ausgewertet. Hier sind einige der neuen Trends, die ich im Auge behalte:
- KI-gestützte Erkenntnisse: Viele Tools verwenden inzwischen KI, um prädiktive Analysen bereitzustellen. So können Sie Probleme vorhersehen, bevor sie entstehen. Dieser Trend macht das Monitoring proaktiver; Anbieter von Nagios-Alternativen wie Dynatrace setzen bereits KI für intelligentere Warnmeldungen und Diagnosen ein.
- Full-Stack-Transparenz: Nutzer möchten Einblick in den gesamten Technologie-Stack, nicht nur auf Server-Ebene. Tools wie New Relic erweitern daher ihre Lösungen und bieten Einblicke in Anwendungen, Infrastruktur und Nutzererfahrung – alles an einer Stelle für eine ganzheitliche Sicht.
- Echtzeit-Datenvisualisierung: Mit zunehmender Datenmenge wird die Echtzeit-Visualisierung immer wichtiger. Anbieter verbessern Dashboards so, dass Live-Datenströme dargestellt werden und Teams auf Änderungen in ihrer Umgebung sofort reagieren können.
- Cloud-natives Monitoring: Da immer mehr Unternehmen in die Cloud wechseln, entwickeln sich Monitoring-Tools weiter, um cloud-native Architekturen zu unterstützen. Lösungen wie Datadog bieten spezielle Funktionen für Cloud-Umgebungen und sorgen so für Kompatibilität und Effizienz.
- Verbessertes Sicherheitsmonitoring: Sicherheit ist ein wachsendes Thema. Tools integrieren fortschrittlichere Sicherheitsfunktionen, zum Beispiel Bedrohungserkennung und Compliance-Prüfungen, um Daten zu schützen und dem Bedürfnis nach sichereren Systemen nachzukommen.
Was sind Server-Monitoring-Tools?
Server-Monitoring-Tools überwachen kontinuierlich den Zustand und die Leistung von Servern – einschließlich CPU, Arbeitsspeicher, Festplatte, I/O, Prozesse, Dienste und Netzwerk –, damit IT- und DevOps-Teams frühzeitig Probleme erkennen, Vorfälle schneller beheben und SLOs in On-Premises-, Cloud- und hybriden Umgebungen einhalten können.
Echtzeit-Alarme, Leistungsmetriken und Visualisierungsfunktionen unterstützen eine proaktive Überwachung und schnelle Problemlösung – so wie Website-Monitoring-Tools die Verfügbarkeit und Performance von Webseiten überwachen.
Funktionen von Server-Monitoring-Tools
Achten Sie bei der Auswahl von Server-Monitoring-Tools auf die folgenden wichtigen Funktionen:
- Echtzeitüberwachung: Erhalten Sie sofortige Updates über den Zustand und die Leistung Ihres Servers. Die Echtzeitüberwachung ermöglicht es Ihnen, Probleme zu erkennen, sobald sie auftreten, sodass Sie eingreifen und Fehler beheben können, bevor sie zu größeren Problemen werden.
- Automatisierte Warnmeldungen: Erhalten Sie Benachrichtigungen per E-Mail, SMS oder Dashboard, wenn Ihre Server festgelegte Schwellenwerte für CPU, Arbeitsspeicher, Festplattenspeicher oder andere Kennzahlen erreichen. Sie müssen Ihre Server nicht mehr ständig überwachen; das System informiert Sie, wenn Handlungsbedarf besteht.
- Verfolgung der Ressourcennutzung: Überwachen Sie detaillierte Statistiken wie CPU-Auslastung, Arbeitsspeicherverbrauch, Festplattenaktivität und Netzwerkverkehr über all Ihre Server hinweg. Dies unterstützt Sie bei intelligenten Entscheidungen zu Upgrades, Skalierung oder Lastverteilung.
- Historische Daten und Berichte: Greifen Sie auf Protokolle und Berichte zu, die die Serverleistung über einen bestimmten Zeitraum verfolgen. Die Auswertung historischer Trends hilft Ihnen, wiederkehrende Probleme oder Zeiträume mit erhöhtem Ressourcenbedarf zu erkennen.
- Anpassbare Dashboards: Personalisieren Sie Ihr Überwachungsdashboard so, dass die für Sie wichtigsten Informationen angezeigt werden. Mit Drag-and-Drop-Widgets visualisieren Sie zentrale Kennzahlen und erhalten einen Überblick, der zu Ihrem Arbeitsstil passt.
- Überwachung von Prozessen und Diensten: Behalten Sie bestimmte Prozesse oder Dienste auf Ihren Servern im Blick. Sie erfahren sofort, falls eine kritische Aufgabe ausfällt, und können rasch wieder für Ordnung sorgen.
- Plattformübergreifende Unterstützung: Überwachen Sie Server unabhängig vom Betriebssystem – egal ob Windows, Linux oder macOS. So verwalten Sie gemischte Umgebungen, ohne das Werkzeug wechseln zu müssen.
- Integration mit Benachrichtigungssystemen: Verbinden Sie Ihr Überwachungstool mit Kollaborations-Apps wie Slack oder Ticket-Systemen. Dies spart endlose E-Mails und ermöglicht Ihrem Team, schnell zu reagieren, wenn Handlungsbedarf besteht.
- Sicherheits- und Zugriffskontrollen: Steuern Sie, wer Ihre Überwachungskonfigurationen einsehen oder ändern darf. Starke Sicherheitsfunktionen verhindern unbefugte Anpassungen und schützen vertrauliche Serverinformationen.
- Skalierbarkeit: Fügen Sie problemlos neue Server und Dienste hinzu, während Ihr Unternehmen wächst. So bleibt Ihre Überwachungslösung mit Ihren steigenden Anforderungen immer auf dem neuesten Stand.
Häufige KI-Funktionen für Serverüberwachungstools
Moderne Tools zur Serverüberwachung setzen häufig künstliche Intelligenz ein, um Leistung zu steigern und Verwaltung zu vereinfachen. Hier sind einige gängige KI-basierte Funktionen, auf die Sie achten sollten:
- Anomalieerkennung: KI-Algorithmen erkennen automatisch ungewöhnliche Muster oder Abweichungen in der Serverleistung und helfen Ihnen, Probleme frühzeitig zu entdecken.
- Vorausschauende Analysen: Maschinelles Lernen sagt mögliche Serverausfälle oder Ressourcenengpässe voraus, sodass Sie vorbeugend handeln und Ausfallzeiten minimieren können.
- Automatisierte Ursachenanalyse: KI identifiziert schnell die Ursache von Leistungsproblemen, wodurch Sie weniger Zeit und Aufwand für die Fehlersuche aufbringen müssen.
- Intelligente Benachrichtigungen: Smarte Systeme verringern Fehlalarme, indem sie sich das normale Verhalten Ihrer Server "merken" und Sie nur informieren, wenn tatsächlich Handlungsbedarf besteht.
- Kapazitätsplanung: KI analysiert Nutzungstrends und empfiehlt optimale Ressourcenzuteilung und Skalierungsstrategien, damit Ihre Server zukünftige Anforderungen bewältigen können.
- Selbstheilende Automatisierung: Manche Tools nutzen KI, um häufige Probleme wie das Neustarten von Diensten oder die Neuverteilung von Ressourcen automatisch – ohne menschliches Eingreifen – zu beheben.
- Adaptive Überwachungsschwellen: KI passt Alarm-Schwellenwerte dynamisch anhand historischer Daten und Nutzungsmuster an, sodass Benachrichtigungen auch bei wachsenden Umgebungen stets relevant bleiben.
Vorteile
Die Einführung von Tools zur Serverüberwachung bringt zahlreiche Vorteile für Ihr Team und Ihr Unternehmen. Auf diese positiven Effekte können Sie sich freuen:
- Proaktives Beheben von Problemen: Echtzeitwarnungen und vorausschauende Analysen ermöglichen es Ihrem Team, Probleme zu erkennen und zu beheben, bevor sie sich ausweiten. So reduzieren Sie Ausfallzeiten.
- Verbesserte Leistung: Die Überwachung von Leistungskennzahlen stellt einen optimalen Serverbetrieb sicher und steigert insgesamt die Effizienz.
- Fundierte Entscheidungen: Anpassen von Dashboards und automatisierte Berichte liefern Einblicke, mit denen Sie die strategischen Entscheidungen Ihres Teams gezielt steuern können.
- Mehr Sicherheit: Überwachungsfunktionen für die Sicherheit erkennen Bedrohungen und gewährleisten die Einhaltung von Vorschriften. So bleibt Ihre Daten vor potenziellen Angriffen geschützt.
- Skalierungsfähigkeit: Für Skalierbarkeit ausgelegte Tools wachsen mit Ihrem Unternehmen und bewältigen nahtlos steigende Daten- und Nutzerzahlen.
- Umfassende Transparenz: Die volle Übersicht über Ihre gesamte Infrastruktur verschafft Ihrem Team tiefe Einblicke und verbessert die Überwachungsfähigkeiten.
Kosten und Preise
Die Auswahl von Serverüberwachungstools erfordert ein Verständnis der verschiedenen verfügbaren Preismodelle und Tarife. Die Kosten variieren je nach Funktionsumfang, Teamgröße, Zusatzoptionen und mehr. Die folgende Tabelle fasst gängige Tarife, deren Durchschnittspreise und übliche enthaltene Funktionen von Lösungen zur Serverüberwachung zusammen:
Tarifvergleichstabelle für Serverüberwachungstools
| Tarifart | Durchschnittspreis | Übliche Funktionen |
| Kostenloser Tarif | $0 | Grundlegende Überwachung, eingeschränkte Dashboards und Standardbenachrichtigungen. |
| Persönlicher Tarif | $5-$25/user/month | Leistungsmetriken, anpassbare Dashboards und grundlegende Berichte. |
| Business-Tarif | $30-$75/user/month | Erweiterte Analysen, Echtzeitbenachrichtigungen und Integrationsmöglichkeiten. |
| Enterprise-Tarif | $100-$300/user/month | Umfassende Systemüberwachung, prädiktive Analysen und dedizierter Support. |
FAQ zu Server-Überwachungstools
Hier finden Sie Antworten auf häufig gestellte Fragen zu Server-Überwachungstools:
Warum ist Bestandsverfolgung in der Cybersicherheit wichtig?
Die Bestandsverfolgung ist für die Cybersicherheit unerlässlich, da Sie damit jedes Gerät und jede Software in Ihrer IT-Umgebung identifizieren, überwachen und verwalten können. Mit einem vollständigen Inventar können Sie unautorisierte Geräte erkennen, Schwachstellen verfolgen und die Einhaltung von Software-Richtlinien sicherstellen. Präzise Nachverfolgung hilft, Datenlecks zu vermeiden, indem Sicherheits- oder Patch-Management-Lücken sichtbar werden, und verschafft Ihnen eine klare Übersicht für Audits und bei Sicherheitsvorfällen.
Wie hilft eine IT-Inventarverwaltung bei Compliance-Audits?
IT-Inventarverwaltungssoftware unterstützt Compliance-Audits, indem sie genaue Nachweise über sämtliche Hard- und Software liefert. Sie können Berichte schnell erstellen, Gerätehistorien nachvollziehen und bei Bedarf Lizenz- oder Konfigurationsdaten belegen. Automatische Dokumentation und Änderungsprotokolle vereinfachen Audits, reduzieren manuellen Aufwand und vereinfachen behördliche Kontrollen.
Welche Integrationen sollte eine IT-Inventarverwaltungslösung bieten?
Achten Sie auf Inventar-Tools, die sich in Ihre vorhandenen Systeme integrieren lassen, etwa Helpdesk-Software, Configuration Management Databases (CMDBs), Anwendungsserver-Software und Lösungen für Endpunktverwaltung. Integrationen mit Sicherheitstools, Verzeichnisdiensten und Cloud-Anbietern sorgen für reibungslose Abläufe und dafür, dass alle Inventardaten über Ihre gesamte IT-Landschaft hinweg aktuell bleiben. Server-Überwachungstools überwachen kontinuierlich Serverzustand und Leistung – CPU, Speicher, Festplatte, I/O, Prozesse, Dienste und Netzwerk –, sodass IT- und DevOps-Teams frühzeitig Probleme erkennen, Vorfälle schneller beheben und SLOs in lokalen, Cloud- und Hybridumgebungen einhalten können.
Wie unterstützen diese Tools Remote- oder Hybrid-Arbeitsmodelle?
Die meisten modernen IT-Inventar-Managementplattformen bieten Cloud-Zugriff, Remote-Agent-Installation und Echtzeit-Synchronisierung. Sie können Geräte überall überwachen – egal ob im Homeoffice oder in verschiedenen Niederlassungen –, Hardware für Remote-Mitarbeiter nachverfolgen und Updates automatisieren. So lassen sich blinde Flecken vermeiden und Sie können ortsunabhängig schneller auf Probleme reagieren.
Welche Funktionen helfen, Hardwareverlust oder Gerätediebstahl zu verringern?
Viele IT-Bestandsmanagement-Tools bieten Asset-Tagging, Geolokalisierung, Ein-/Ausgabeprotokolle und Warnungen bei ungewöhnlichen Aktivitäten. So können Sie Gerätezuweisungen verfolgen, Bewegungen dokumentieren und verlorene Hardware schneller wiederfinden. Außerdem sind automatische Erinnerungen für Geräte-Rückgaben oder Wartungen möglich, was das Risiko von Verlust oder Diebstahl verringert.
Wie funktioniert die automatische Asset Discovery moderner Inventarverwaltungsplattformen?
Die automatische Asset Discovery scannt Ihr Netzwerk, um alle angeschlossenen Geräte sowie installierte Software zu erkennen. Das System aktualisiert Ihr Inventar fortlaufend, erkennt neue oder nicht autorisierte Geräte und hilft Ihnen, eine präzise Geräteübersicht zu behalten. Damit sparen Sie Zeit, erhöhen die Sicherheit und vermeiden Fehler bei der manuellen Nachverfolgung.
Wie geht es weiter?
Wenn Sie sich über Server-Überwachungssoftware informieren, kontaktieren Sie einen SoftwareSelect-Berater für kostenlose Empfehlungen.
Füllen Sie ein Formular aus und vereinbaren Sie einen Gesprächstermin, um Ihre Anforderungen zu besprechen. Sie erhalten eine Software-Shortlist als Entscheidungshilfe und Unterstützung im gesamten Kaufprozess, einschließlich Preisverhandlungen.