Die 10 besten Tools zur Anwendungsüberwachung 2026

10 Die besten Tools zur Anwendungsüberwachung – Kurzliste


Die schiere Menge an Überwachungstools, die alle als die besten bezeichnet werden, kann einen schnell überfordern. Genau hier komme ich ins Spiel. Ich habe diese Tools unabhängig getestet und bewertet, um Ihnen eine fundierte Entscheidungsgrundlage zu bieten.
Tools zur Anwendungsüberwachung können den Stress durch unerwartete Ausfälle und Performance-Probleme reduzieren, sodass Sie sich auf das Wesentliche konzentrieren können – nämlich Ihr Unternehmen weiterzuentwickeln.
In diesem Artikel teile ich meine Favoriten mit Ihnen, gebe Ihnen objektive Einblicke und praktische Ratschläge. Sie erfahren, welche Tools sich am besten für die individuellen Anforderungen Ihres Teams eignen und wie sie Ihre Arbeitsabläufe effizienter gestalten können.
Warum Sie unseren Software-Bewertungen vertrauen können
Wir testen und bewerten seit 2023 Software. Als Technologie-Führungskräfte wissen wir, wie kritisch und herausfordernd es ist, die richtige Entscheidung bei der Softwareauswahl zu treffen.
Wir investieren viel in gründliche Recherche, um unserer Zielgruppe zu helfen, bessere Kaufentscheidungen zu treffen. Wir haben über 2.000 Tools für verschiedene Technikanwendungsfälle getestet und mehr als 1.000 umfassende Softwarebewertungen geschrieben. Erfahren Sie wie wir transparent bleiben und unsere Methodik der Softwarebewertung.
Zusammenfassung der besten Tools zur Anwendungsüberwachung
| Tool | Best For | Trial Info | Price | ||
|---|---|---|---|---|---|
| 1 | Am besten für Unternehmen aus dem Finanzwesen | 15-tägige kostenlose Testversion | Ab $0.08/Stunde | Website | |
| 2 | Am besten für Echtzeit-Fehlerüberwachung | Kostenloser Tarif + kostenlose Demo verfügbar | Ab $26/Monat (jährlich abgerechnet) | Website | |
| 3 | Beste einheitliche Monitoring-Plattform | 14-tägige kostenlose Testversion | Ab $31/Host/Monat (jährliche Abrechnung) | Website | |
| 4 | Am besten geeignet für Einblicke auf Code-Ebene | 30-tägige kostenlose Testversion + kostenlose Demo + kostenloser Plan verfügbar | Ab $199/Jahr | Website | |
| 5 | Am besten für Bildungseinrichtungen geeignet | 30-tägige kostenlose Testversion | Ab $35/Monat (jährlich abgerechnet) | Website | |
| 6 | Beste Funktionen für Fehlerverfolgung | Kostenloser Plan verfügbar | Ab $0.30/GB | Website | |
| 7 | Am besten für Online-Spiele | Kostenloser Plan verfügbar | Ab $130/Monat | Website | |
| 8 | Beste Incident-Management-Funktionen | 14-tägige kostenlose Testversion | Ab $75/Host/Monat | Website | |
| 9 | Bestes APM für AWS | Kostenloser Plan verfügbar | Ab $0,50/GB | Website | |
| 10 | Beste Open-Source-Option | Kostenloser Plan verfügbar | Ab $29/Monat | Website |
-

TestDevLab
Visit Website -
Site24x7
Visit WebsiteThis is an aggregated rating for this tool including ratings from Crozdesk users and ratings from other sites.4.7 -
GitHub Actions
Visit WebsiteThis is an aggregated rating for this tool including ratings from Crozdesk users and ratings from other sites.4.8


Bewertungen der besten Tools zur Anwendungsüberwachung
Hier sind meine bevorzugten Lösungen zur Anwendungsüberwachung, mit kurzen, aber umfassenden Übersichten zu Stärken, Schwächen und Preisangaben:
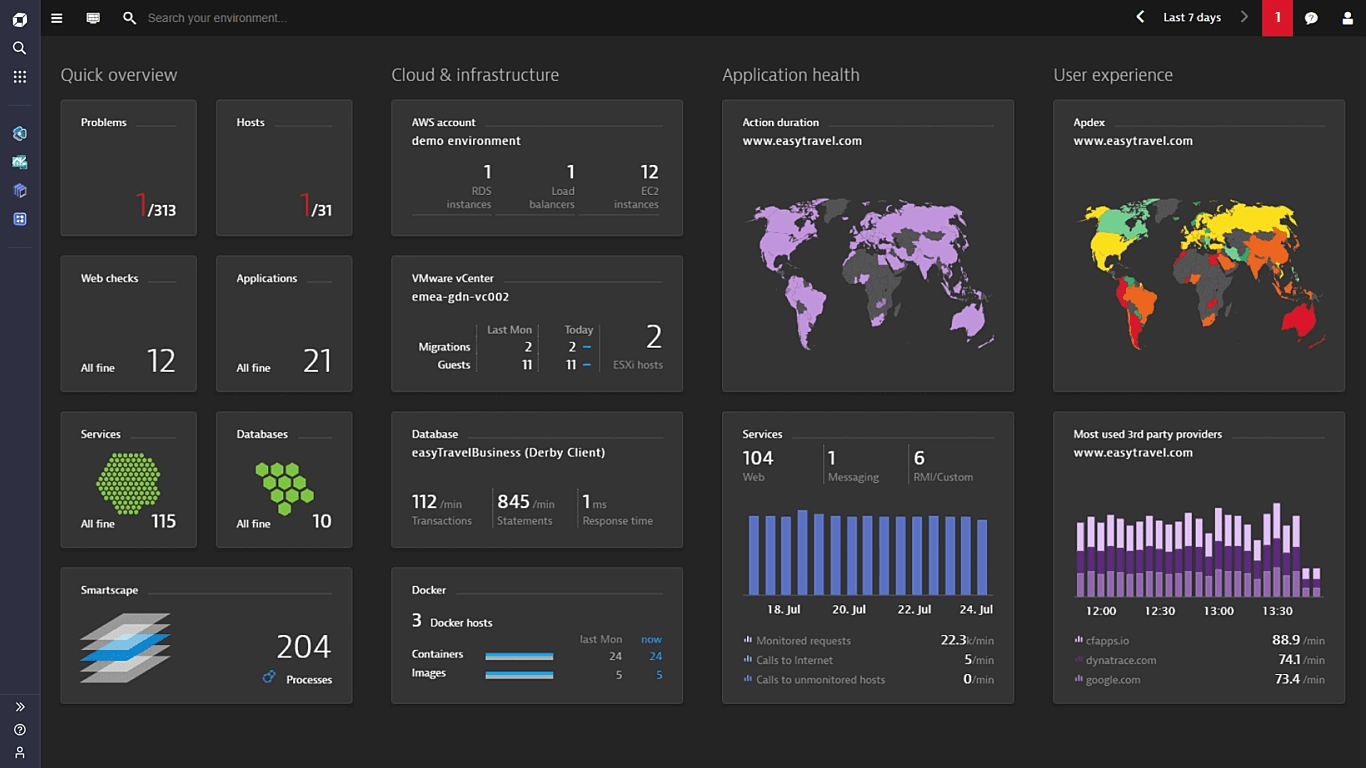
Dynatrace ist eine einheitliche Observability-Plattform, deren Lösungen Module für Anwendungsüberwachung und -sicherheit, digitale Nutzererfahrung, Infrastrukturüberwachung, Automatisierung und Geschäftseinblicke umfassen.
Warum ich Dynatrace ausgewählt habe: Ich habe Dynatrace wegen Grail ausgewählt, einem zentralen Observability- und Analysetool. Es sammelt kausale Daten in großem Umfang und liefert KI-gestützte Erkenntnisse mit vollständigem Kontext, die bei Geschäftsentscheidungen helfen – besonders nützlich für Fintech-Unternehmen, wie ich finde. Mir gefiel auch die Möglichkeit, eigene Parameter zu definieren, die ungewöhnliches Verhalten kennzeichnen.
Herausragende Funktionen und Integrationen von Dynatrace:
Funktionen, die Dynatrace aus meiner Sicht ideal für Finanz-Apps machen, sind die Unterstützung von BizDevOps mit integrierten BI-Tools, die es ermöglichen, Geschäftsteams in den Entwicklungsprozess einzubeziehen.
Gut fand ich auch, dass sich gezielte Benachrichtigungen einrichten lassen, sodass im Falle eines Problems die am besten qualifizierten Mitarbeitenden informiert werden. Beispielsweise kann ein Hinweis auf möglichen Betrug direkt an das Finanzteam gehen, statt an das Entwicklungsteam.
Integrationen sind vorkonfiguriert für Jenkins, GitLab, JFrog, Microsoft Teams, Mulesoft, LaunchDarkly, ServiceNow, Jira, Prometheus und Grafana.
Pros and Cons
Pros:
- Kausale Datenverarbeitung in großem Umfang
- Unterstützt BizDevOps mit BI-Tools
- Gezielte Benachrichtigungen
Cons:
- Support ist Glückssache
- Starke Lernkurve
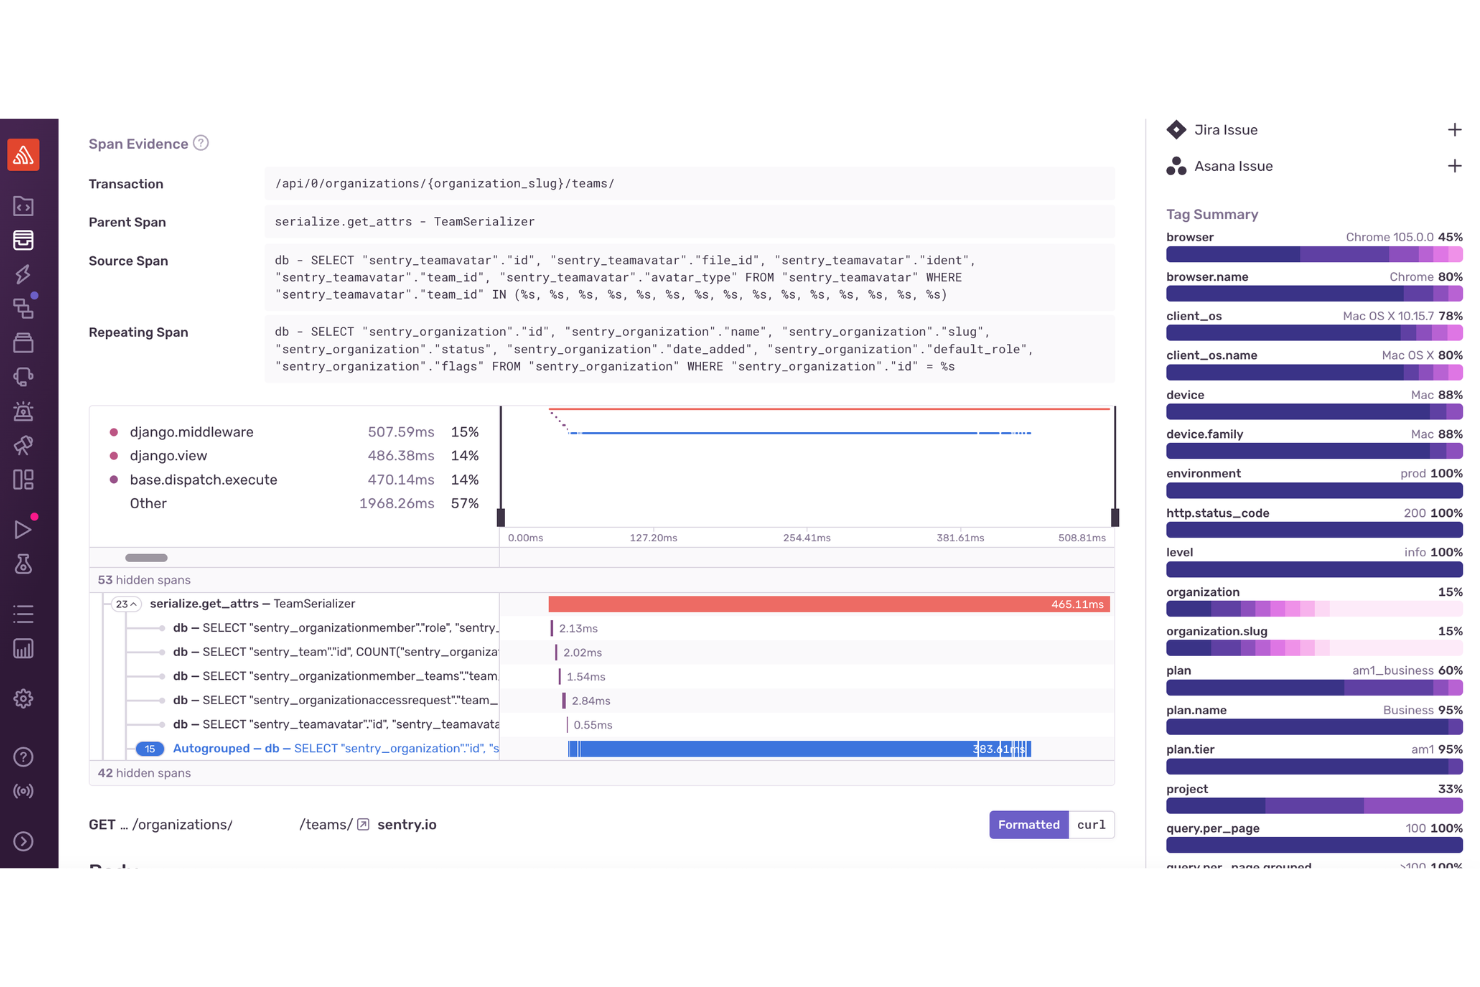
Sentry hilft Ihrem Entwicklungsteam, Fehler und Leistungsprobleme in Ihren Anwendungen zu erkennen und zu verstehen, indem es in Echtzeit aufzeigt, was in Ihrem Code schief läuft und warum. Es richtet sich an Softwareteams, die tiefergehende Einblicke in Ausnahmen, Leistungsengpässe und Release-Stabilität über Web-, Mobil- und Backend-Systeme hinweg erhalten möchten – und liefert so mehr Kontext als reine Protokollierung.
Warum ich Sentry ausgewählt habe
Ich habe Sentry ausgewählt, weil es detailliertes Echtzeit-Fehlermonitoring mit Code-nahen Performance-Einblicken auf einer Plattform vereint und Ihrem Team so eine präzise Problemdiagnose ermöglicht. Sentrys Fehlerverfolgung erfasst unbehandelte Ausnahmen und gruppiert ähnliche Probleme, damit Sie sich auf das Wesentliche konzentrieren können. Durch die Verknüpfung mit Commits können Sie Fehlern bis zu bestimmten Änderungen nachspüren. Das verteilte Tracing und Performance-Monitoring liefern transaktionsgenaue Einblicke, sodass Sie langsame Endpunkte oder Engpässe aufspüren können, ohne mühsam Protokolle durchsuchen zu müssen.
Sentry Hauptfunktionen
Neben den herausragenden Features bietet Sentry weitere Funktionen, die die Anwendungsüberwachung verbessern:
- Session Replay: Diese Funktion ermöglicht es, Nutzersitzungen abzuspielen, um den Kontext hinter Fehlern zu verstehen und das Nutzererlebnis zu optimieren.
- Release-Tracking: Verknüpft Fehler und Leistungsänderungen mit bestimmten Releases, damit Sie beobachten können, wie sich neue Versionen langfristig auf die Stabilität auswirken.
- Uptime-Monitoring: Stellt die konstante Erreichbarkeit Ihrer Anwendung sicher, indem die Verfügbarkeit überwacht und bei Ausfällen benachrichtigt wird.
- Profiling: Bietet detaillierte Einblicke in Leistungsprobleme durch Analyse des Laufzeitverhaltens, um die Geschwindigkeit der Anwendung zu optimieren.
Sentry-Integrationen
Zu den Integrationen gehören GitHub, Slack, Jira, Bitbucket, GitLab, Trello, PagerDuty, Azure DevOps, Twilio und Zendesk.
Pros and Cons
Pros:
- Bietet Echtzeit-Fehlerverfolgung über Web-, Mobil- und Backend-Apps hinweg
- Fortschrittliche Fehlergruppierung hilft, Probleme schnell zu priorisieren und zu beheben
- Verteiltes Tracing zeigt transaktionsgenaue Performance-Einblicke
Cons:
- Nicht alle Integrationen sind nativ verfügbar, einige erfordern Drittanbieter-APIs
- Begrenzte Benachrichtigungen und Anwendungseinblicke in niedrigeren Tarifstufen
New Product Updates from Sentry

Sentry Adds Log Export in CSV and JSONL
Sentry now supports exporting up to 10,000 log lines from Explore → Logs in CSV or JSON Lines, with downloads available in-browser or as background downloads and email. For more information, visit Sentry's official site.
 .
.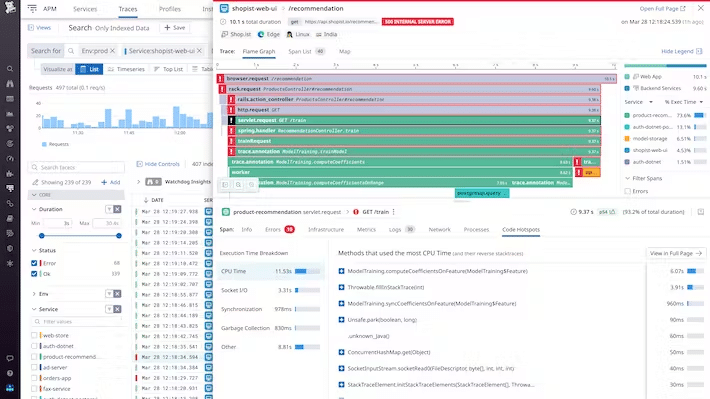
Datadog ist eine Monitoring- und Sicherheitsplattform für Anwendungen und Infrastruktur mit Funktionen wie Protokollierung und Softwarebereitstellung.
Warum ich Datadog ausgewählt habe: Ich habe Datadog gewählt, weil es eine All-in-One-Monitoring-Lösung ist, die eine einzige Benutzeroberfläche schafft, um nicht nur Ihre App, sondern auch die zugehörigen Netzwerke, Datenbanken, Infrastruktur und Container zu visualisieren. Außerdem gefiel mir, wie die Kollaborationsfunktionen dabei halfen, die Lücke zwischen Entwicklern und Geschäftsteams zu überbrücken.
Herausragende Funktionen und Integrationen von Datadog:
Funktionen, die Datadog meiner Meinung nach zu einer idealen einheitlichen Monitoring-Plattform für Anwendungen und Netzwerkumgebungen machen, beinhalten Protokollierungsfunktionen, die Prüfpfade, Observability-Pipelines und Scanner für sensible Daten bereitstellen.
Es ermöglicht außerdem die Verwaltung der digitalen Erfahrung mit detaillierten Funktionen, die Session-Aufzeichnung und -Wiedergabe, Fehlerverfolgung sowie echtes Nutzer- und synthetisches Monitoring abdecken.
Integrationen sind vorgefertigt für Argo CD, CircleCI, Travis CI, Azure DevOps, GitHub, Jira, GitLab, Auth0, Kubernetes und Docker.
Pros and Cons
Pros:
- All-in-One-Monitoring-Plattform
- Tiefgehende Protokollmanagement-Funktionen
- Umfassende Funktionen für digitales Experience-Management
Cons:
- Spärliche Dokumentation
- Relativ steile Lernkurve
Am besten geeignet für Einblicke auf Code-Ebene
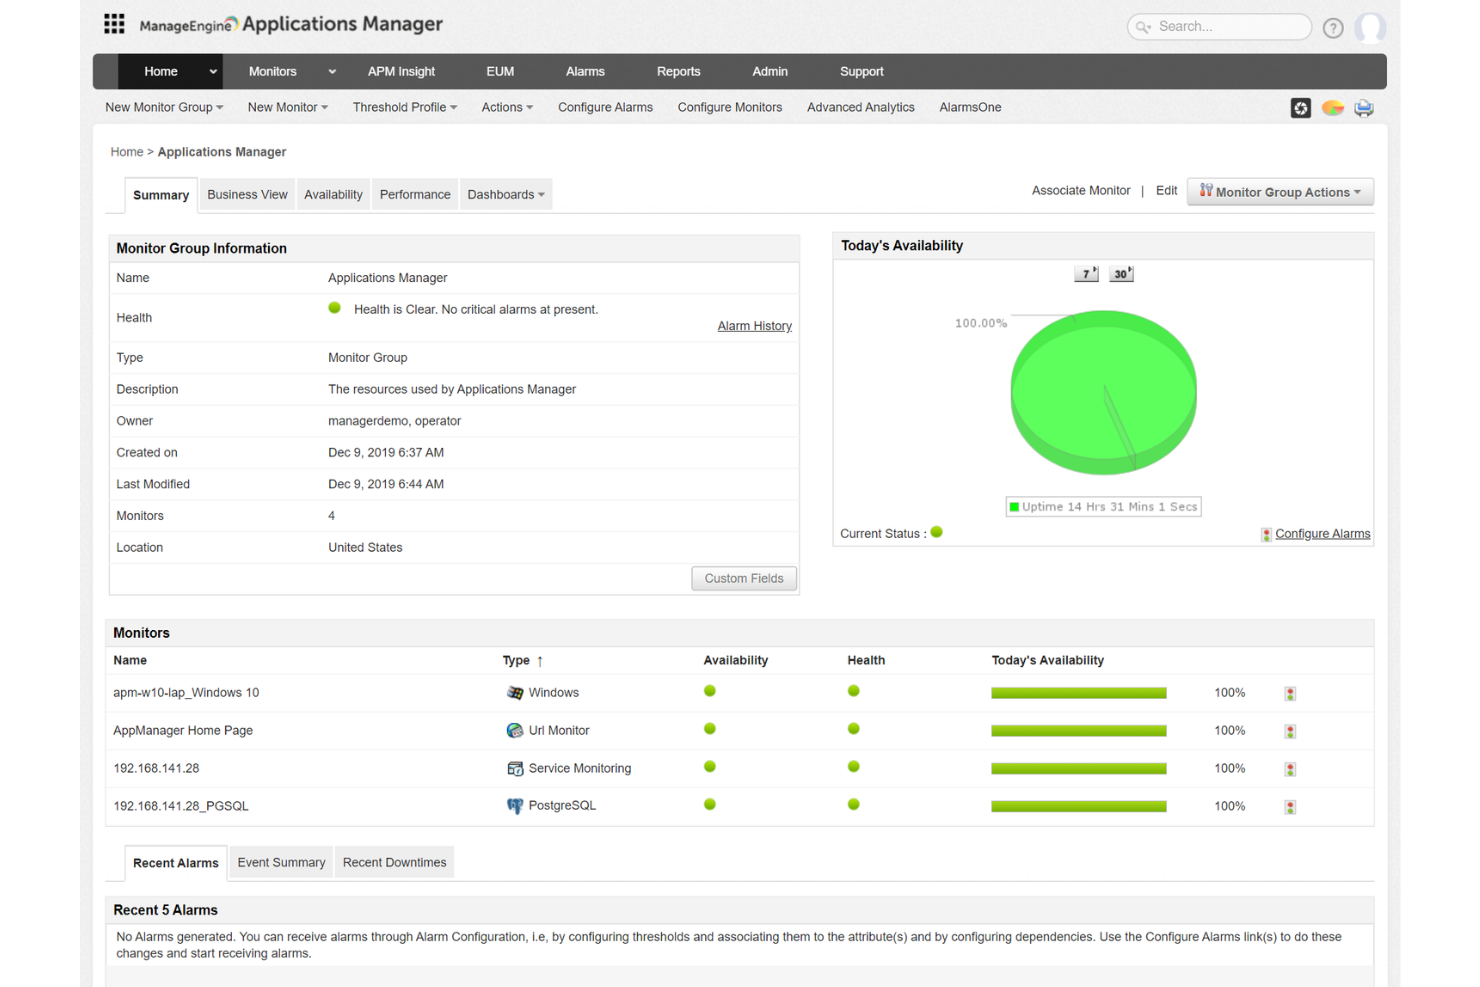
ManageEngine Applications Manager ist ein leistungsstarkes Tool zur Überwachung der Anwendungsperformance, das für IT-Teams und Administratoren entwickelt wurde.
Warum ich ManageEngine Applications Manager ausgewählt habe: Mir gefällt die Möglichkeit, Einblicke auf Code-Ebene in Ihre Anwendungen zu erhalten. Diese Funktion hilft Ihnen, problematische Elemente im Anwendungscode zu identifizieren, sodass Sie Probleme beheben können, bevor sie Ihre Nutzer betreffen. Zusätzlich bietet es Thread-Profiling, das Engpässe im Code-Stack aufdecken kann, sodass Sie die Performance effektiv optimieren können.
Herausragende Funktionen und Integrationen von ManageEngine Applications Manager:
Funktionen wie Real User Monitoring liefern in Echtzeit Einblicke in die Nutzererfahrung, indem Seitenladezeiten und Sitzungsdetails verfolgt werden. Das hilft Ihnen, Probleme mit der Nutzererfahrung proaktiv zu erkennen und zu beheben. Darüber hinaus sammelt und analysiert das Hybrid-Cloud-Monitoring Daten aus sowohl lokalen als auch Cloud-basierten Infrastrukturen und verschafft Ihnen einen umfassenden Überblick über Ihre IT-Umgebung.
Die Funktion zur Abbildungsvisualisierung von Anwendungsabhängigkeiten stellt die Beziehungen zwischen Ihren Anwendungskomponenten dar, sodass Sie verstehen können, wie Dienste, APIs und Datenbanken zusammenarbeiten – ein wichtiger Aspekt für effizientes Troubleshooting.
Integrationen umfassen ManageEngine ServiceDesk Plus, ServiceNow, Site24x7, AlarmsOne, Slack, Prometheus, AWS, Google Cloud, Microsoft Azure, Oracle und MySQL.
Pros and Cons
Pros:
- Überwacht eine breite Palette von Anwendungen und Infrastrukturkomponenten
- Echtzeit-Benachrichtigungssystem hilft Teams, schnell auf Probleme zu reagieren
- Vereinfacht die Verwaltung von Anwendungen und deren Beziehungen
Cons:
- Die Einrichtung des Tools für spezifische Anforderungen kann herausfordernd sein
- Das Tool kann ressourcenintensiv sein
New Product Updates from ManageEngine Applications Manager
Oracle Cloud Application Monitoring Now Available in ManageEngine Applications Manager
ManageEngine Applications Manager introduces Oracle Cloud Application Monitoring, Oracle Cloud Function Monitoring, and Oracle Cloud NAT Gateway Monitoring. These new capabilities help teams monitor Oracle Cloud applications, serverless workloads, and network resources from a single platform. For more information, visit ManageEngine Applications Manager's official site.
 .
.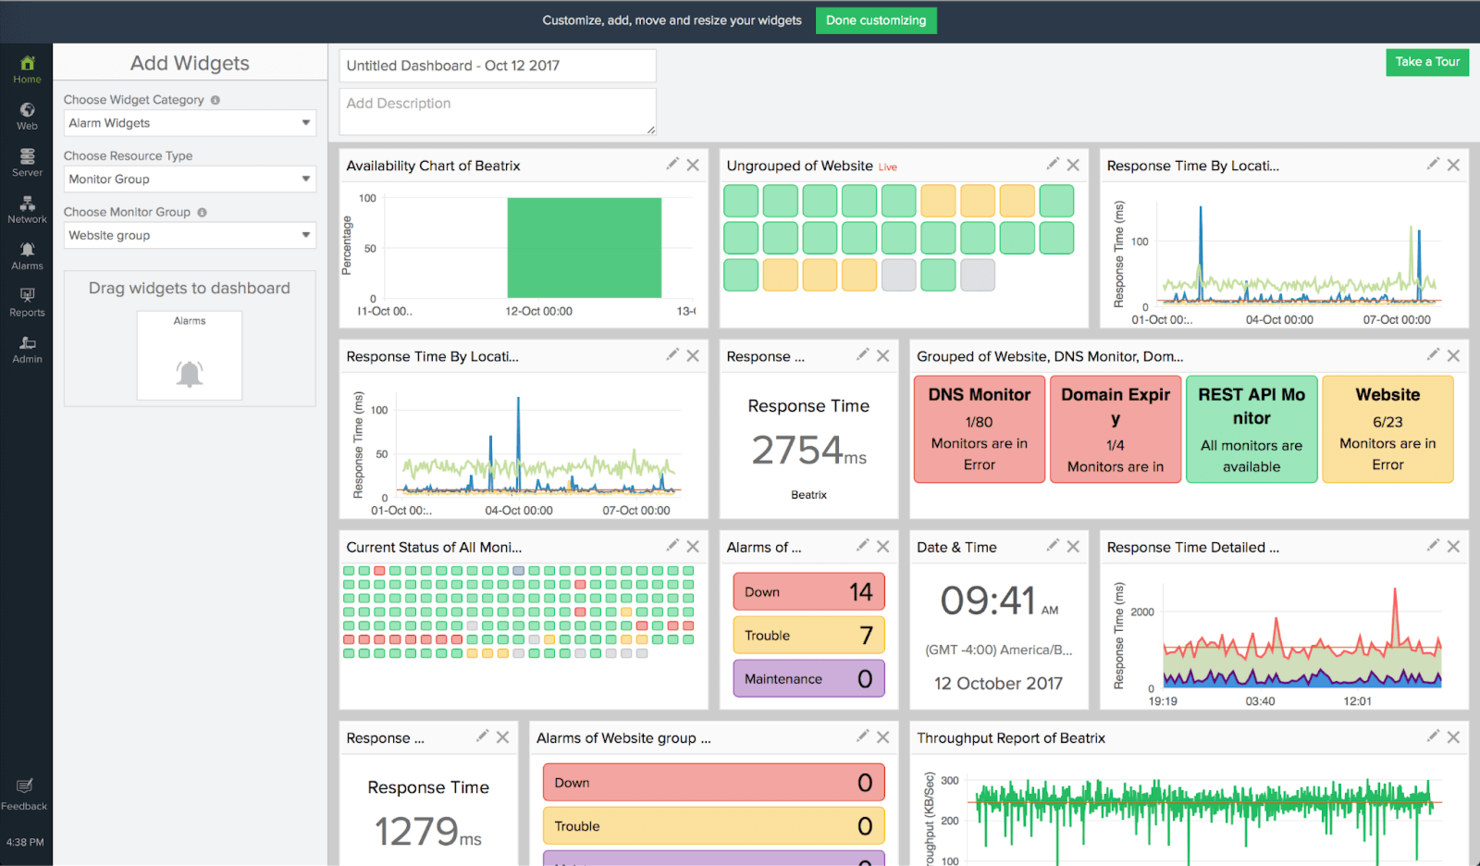
Site24x7 bietet Überwachungstools für Anwendungen, Websites, Netzwerke, Server, öffentliche und private Clouds sowie synthetische Webtransaktionen.
Warum ich Site24x7 ausgewählt habe: Unter den Kunden von Site24x7 finden sich bekannte Namen aus dem Bildungsbereich wie Stanford und Oxford, und das Produkt zeigt überzeugend, warum. Zum einen erfüllt es viele der Anforderungen, die an Bildungseinrichtungen gestellt werden, darunter SOC 2 und ISO 27001, sodass Sie mit den Daten von Studierenden und Mitarbeitenden sicher umgehen können.
Herausragende Funktionen und Integrationen von Site24x7:
Funktionen, die Site24x7 besonders für Bildungseinrichtungen geeignet machen, sind unter anderem die Elastizität und die Fähigkeit, Ressourcen automatisch je nach Nutzung zu skalieren – ein Aspekt, der auf einem Campus im Tagesverlauf starken Schwankungen unterliegen kann.
Mir hat auch gefallen, dass es Integrationen für verschiedene gängige Plattformen für Serviceanfragen und Kommunikation bietet, wie Discord, Microsoft Teams, Slack, ServiceNow, Freshdesk und Telegram. Das erleichtert das Einholen von Feedback direkt von Studierenden und Mitarbeitenden.
Integrationen sind vorkonfiguriert für Jenkins, Bitbucket, GitHub, Freshdesk, Jira, Slack, Teams, Amazon EventBridge, ServiceNow und Discord.
Pros and Cons
Pros:
- Entspricht branchenspezifischen Standards im Bildungsbereich
- Unterstützt gängige Kommunikations-Apps
- Zentrale Überwachung verschiedener Plattformtypen, einschließlich Websites und Clouds
Cons:
- Benachrichtigungen werden nicht automatisch gruppiert und können daher überwältigend wirken
- Überladene Benutzeroberfläche
New Product Updates from Site24x7
Site24x7 Adds Synchronization Statuses for MSPs
Site24x7 now provides MSPs enhanced alerts and synchronization statuses in a centralized notification center to spot configuration sync issues sooner and accelerate incident response. For more information, visit Site24x7's official site.

New Relic ist eine Observability-Plattform, die Ingenieur:innen und Datenwissenschaftler:innen Daten aus verschiedenen Quellen bereitstellt, darunter Web- und Mobile-Apps, Infrastruktur und Netzwerke.
Warum ich New Relic ausgewählt habe: New Relic hat es auf meine Liste geschafft wegen Errors Inbox, einer umfassenden Fehlerverwaltungsfunktion. In meinen Tests habe ich diese genutzt, um ähnliche Fehler je nach Wichtigkeit zu gruppieren, sodass ich nicht dieselben Benachrichtigungen sowohl für schwerwiegende als auch für vernachlässigbare Probleme erhalten habe. Außerdem konnte ich es so einrichten, dass bestimmte Benachrichtigungen direkt an das zuständige Team in Slack geschickt werden.
Herausragende Funktionen und Integrationen von New Relic:
Funktionen, die New Relic zur idealen APM-Lösung für die Fehlerverfolgung machen, sind unter anderem die Möglichkeit, eine Arbeitslast in einer Vorproduktionsumgebung einzurichten und Probleme zu kennzeichnen, bevor sie in die Produktion gelangen, und dann sofort Benachrichtigungen an Slack zu senden.
Ich habe zudem festgestellt, dass Fehlerdaten auch nach ihrer Behebung gespeichert bleiben, sodass man beispielsweise Kontextinformationen, Anhänge und Kommentare nachträglich einsehen kann, falls man wissen muss, wie etwas gelöst wurde und wer daran beteiligt war.
Integrationen sind vorgefertigt für VMware vSphere, Relic, Kafka, HAProxy, JFrog, Apache Cassandra, Amazon ECS, Netlify, Oracle Database und NGINX.
Pros and Cons
Pros:
- Fehlergruppierung
- Gezielte Benachrichtigungen bei Fehlern
- Speichert Fehlerdaten
Cons:
- Die Anzahl der Funktionen kann für neue Nutzer:innen überwältigend sein
- Kann teuer werden
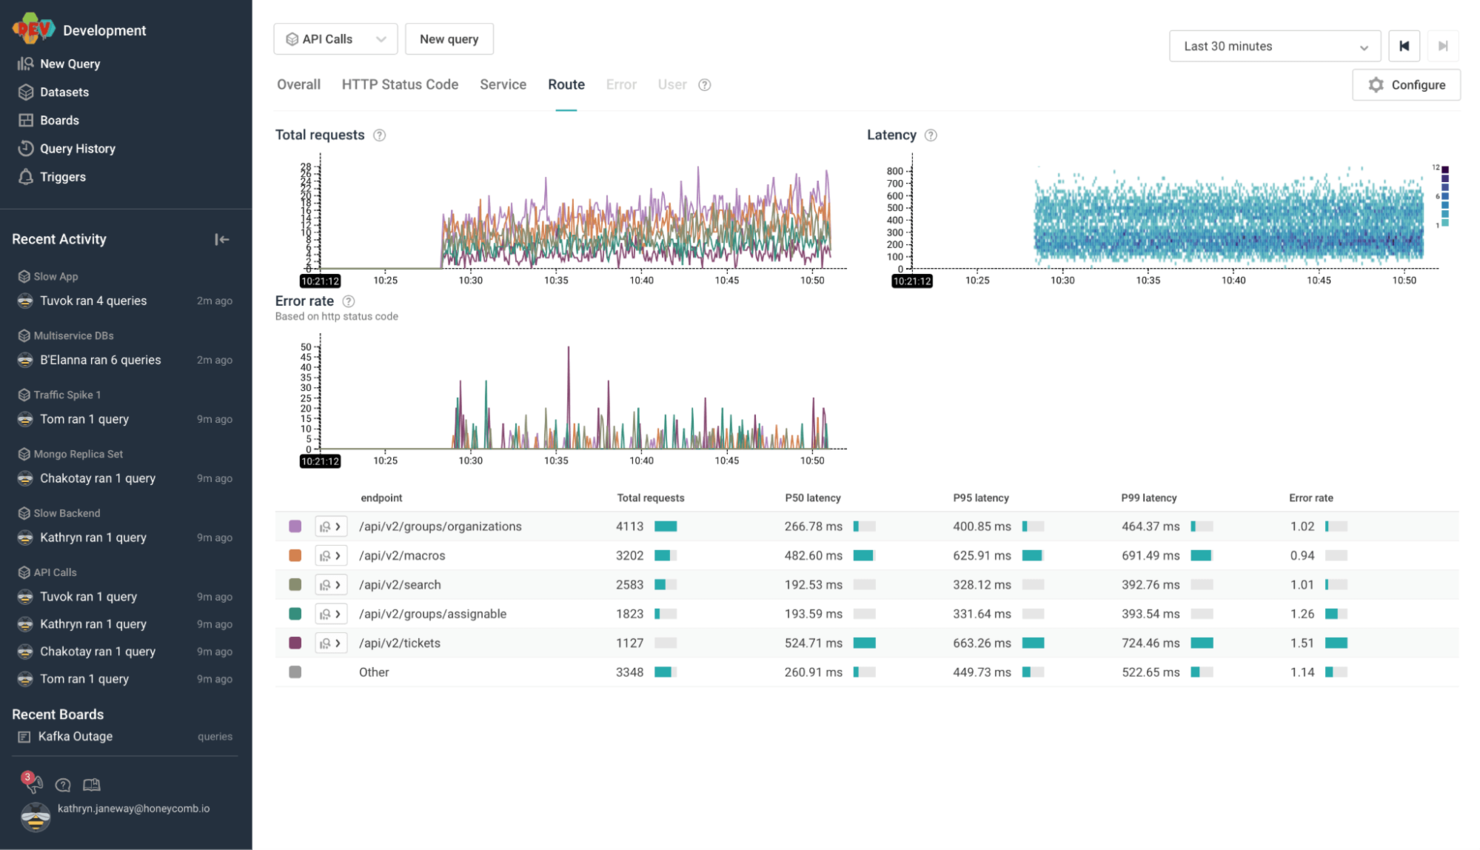
Honeycomb ist eine Ereignisverwaltungsplattform für verteilte Dienste, die darauf abzielt, Einblicke aus einer zentralen Schnittstelle zu bieten.
Warum ich mich für Honeycomb entschieden habe: Wenn die Anwendung, die Sie überwachen möchten, tatsächlich ein Spiel ist, könnte Honeycomb meiner Meinung nach die richtige Lösung für Ihr Team sein. Ich habe die Funktionen zur verteilten Nachverfolgung zusammen mit einer Funktion namens BubbleUp getestet; BubbleUp analysiert Anfragen verschiedener Teams nach gemeinsamen Mustern, um Ihnen ein ganzheitlicheres Bild davon zu geben, wie Nutzer mit dem Produkt interagieren. In einem Spielentwicklungs-Szenario könnten diese Daten sich auf Spieler beziehen und von Teams wie Entwicklung, Audio und Design gesammelt werden.
Herausragende Funktionen und Integrationen von Honeycomb:
Funktionen, die Honeycomb meiner Meinung nach ideal für Spieleentwicklungsunternehmen machen, sind beispielsweise das Service Map, das eine visuelle Darstellung aller verknüpften Dienste in Ihrer Anwendung erstellt; dies ist ein wertvolles Werkzeug zur Überwachung von als Microservices aufgebauten Spielen, zumal Sie es auch zur visuellen Fehlerdiagnose nutzen können.
OpenTelemetry ermöglicht es Ihnen, Ihren Code für Honeycomb zu instrumentieren, sodass Sie Ihre eigenen Telemetriedaten generieren können. Sie müssen dies nur einmal einrichten und können die Daten anschließend in jedem gewünschten Backend-Dienst nutzen, wobei Sie sich keine Sorgen machen müssen, an einen Anbieter gebunden zu sein.
Integrationen sind vorgefertigt für GitHub, LaunchDarkly, CircleCI, Terraform, Consul, AWS Lambda, Slack, PagerDuty, Chef und GitLab.
Pros and Cons
Pros:
- Individuelle Telemetrie
- Gut für das Management von Microservices
- Leistungsstarke verteilte Nachverfolgung
Cons:
- Teuer
- Benötigt etwas Zeit zur Einrichtung und Eingewöhnung
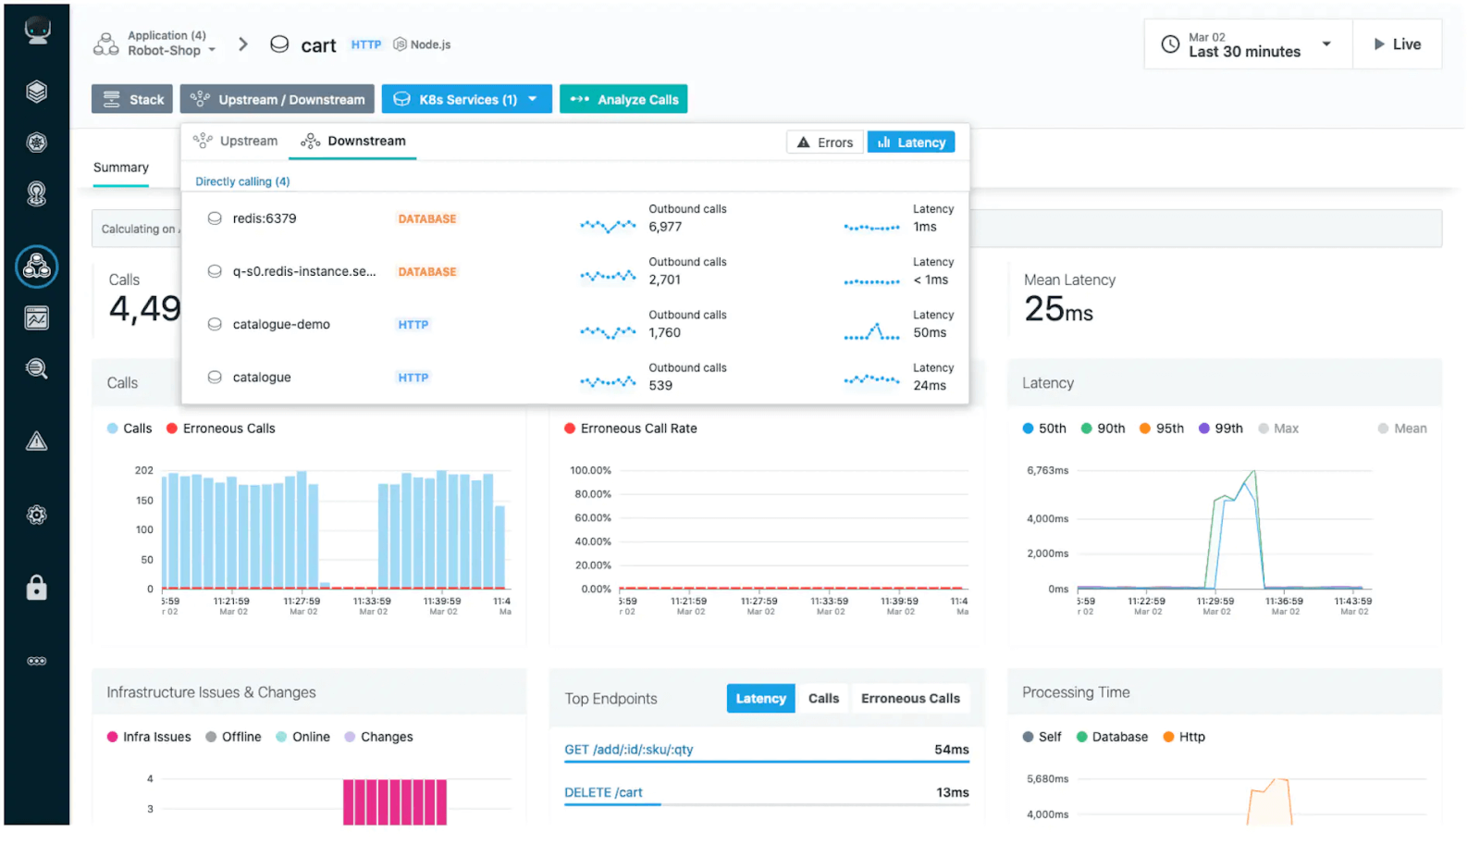
Instana Observability, häufig einfach als Instana bezeichnet, ist ein APM von IBM, das automatisierte Full-Stack-Transparenz und schnelle Benachrichtigungen bietet.
Warum ich IBM Instana ausgewählt habe: Bei meiner Bewertung habe ich festgestellt, dass Instana über leistungsstarke Funktionen für das Incident Reporting verfügt, einschließlich KI-basierter Warnmeldungen. Sobald ein Dienst erkannt wird, beginnt Instana automatisch mit der Überwachung der damit verbundenen KPIs wie Fehler, Auslastung und Latenzzeit und sendet eine Benachrichtigung, wenn diese Werte über oder unter ein akzeptables Niveau steigen oder fallen.
Herausragende Funktionen und Integrationen von IBM Instana:
Funktionen, die IBM Instana ideal für das Incident Management machen, sind unter anderem das automatische Erkennen und Protokollieren von Änderungen – abhängig davon, ob etwas online oder offline geht – und die Verknüpfung mit anderen Aktivitäten, um zu bestimmen, ob eine Warnmeldung ausgelöst werden muss. Beim Versenden einer Alarmmeldung werden außerdem kontextbezogene Informationen bereitgestellt, sodass Sie weniger Zeit für die Problemlösung Ihrer Anwendung aufwenden müssen.
Integrationen sind vorgefertigt für OpsGenie, Microsoft 365, Slack, Traefik, PagerDuty, Jaeger, TIBCO EMS, VMware Tanzu, Coralogix und Splunk.
Pros and Cons
Pros:
- Vereinfacht die Fehlerbehebung durch detaillierte Benachrichtigungen
- Präzise Erkennung von Vorfällen und Änderungen
- Starke Automatisierungsfunktionen
Cons:
- Hohe Prozessorlast
- Dauert etwas, bis die vollständige Konfiguration abgeschlossen ist
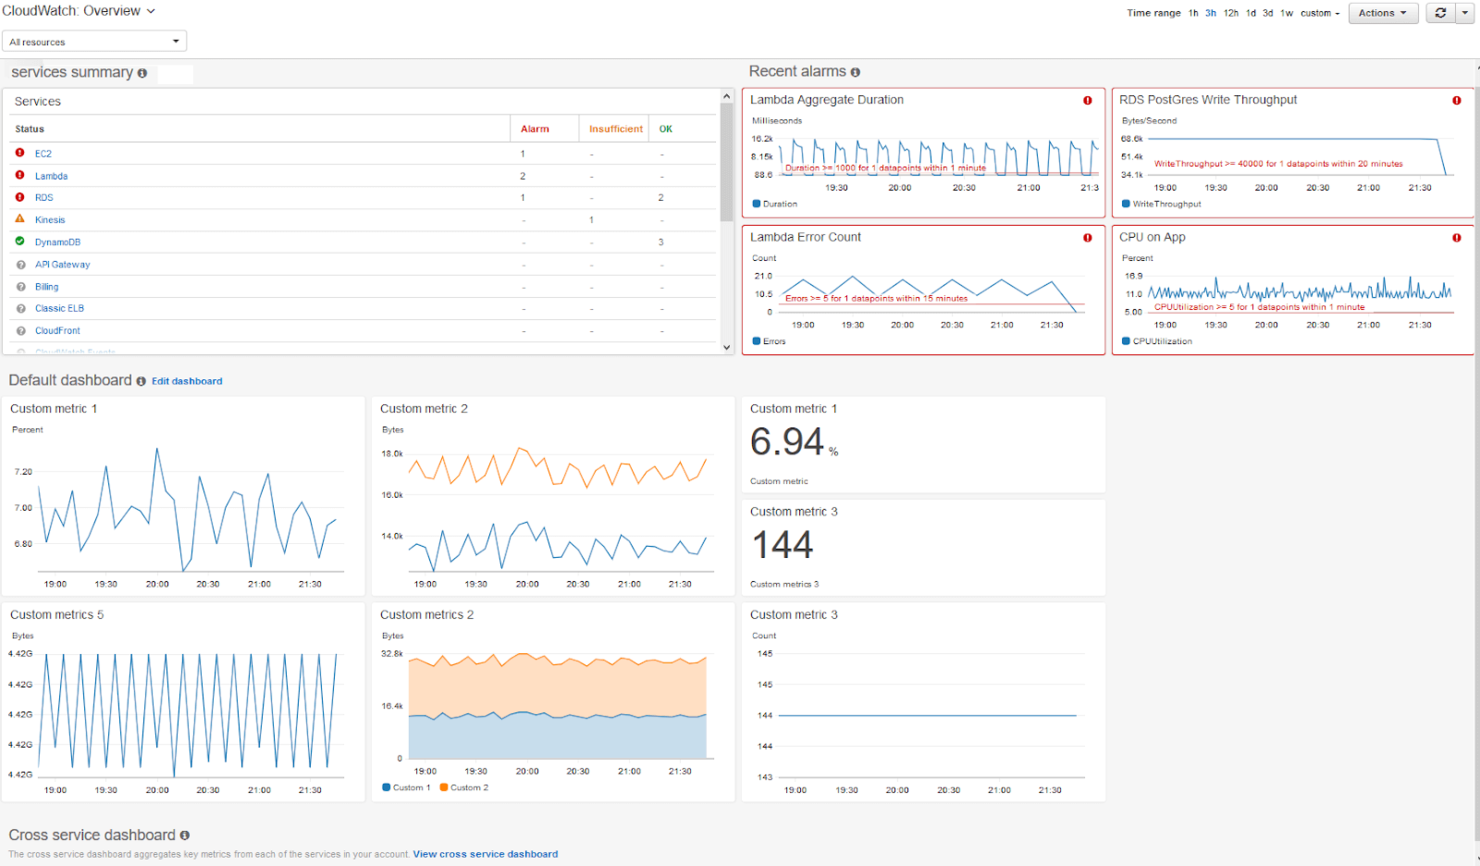
CloudWatch ist ein APM, das zur AWS-Familie von Amazon gehört und sich auf das Sammeln von Protokollen und Metriken über verschiedene Clouds hinweg konzentriert.
Warum ich Amazon CloudWatch ausgewählt habe: Auch wenn CloudWatch ein vielseitiges Tool ist, das sogar vor Ort (on-premise) eingesetzt werden kann, habe ich festgestellt, dass es am besten funktioniert, wenn Sie es auf AWS betreiben. Sie können damit Anwendungen überwachen, die Sie unter verschiedenen AWS-Konten und -Diensten bereitgestellt haben, darunter ECS, S3 und Lambda, und erhalten alle Daten zentral an einem Ort.
Hervorstechende Funktionen und Integrationen von Amazon CloudWatch:
Funktionen, die CloudWatch zu meinem bevorzugten APM für AWS machen, sind unter anderem die FedRamp- und PCI-Konformität sowie die Option, Amazon Key Management Service (KMS) zur Verschlüsselung von Protokollen und zur Erhöhung der Sicherheitskonformität zu nutzen.
Was das Sammeln der Protokolle angeht, haben Sie, sofern Sie auf AWS sind, verschiedene Optionen, darunter VPC Flow Logs und Route 53 für vended logs oder Sie sammeln sie von AWS-Diensten, die sie veröffentlichen, darunter ECS und API Gateway.
Integrationen sind nativ für andere AWS-Produkte und -Dienste verfügbar, darunter DynamoDB, CloudTrail, ECS, EKS, Fargate, API Gateway, VPC Flow Logs, Route 53, Lambda und EventBridge.
Pros and Cons
Pros:
- Native Integration mit nützlichen AWS-Diensten
- Teil des AWS Free Tiers
- Umfassende Unterstützung für Protokollierung
Cons:
- Weniger leistungsfähig außerhalb von AWS
- Starke Abhängigkeit von anderen Tools
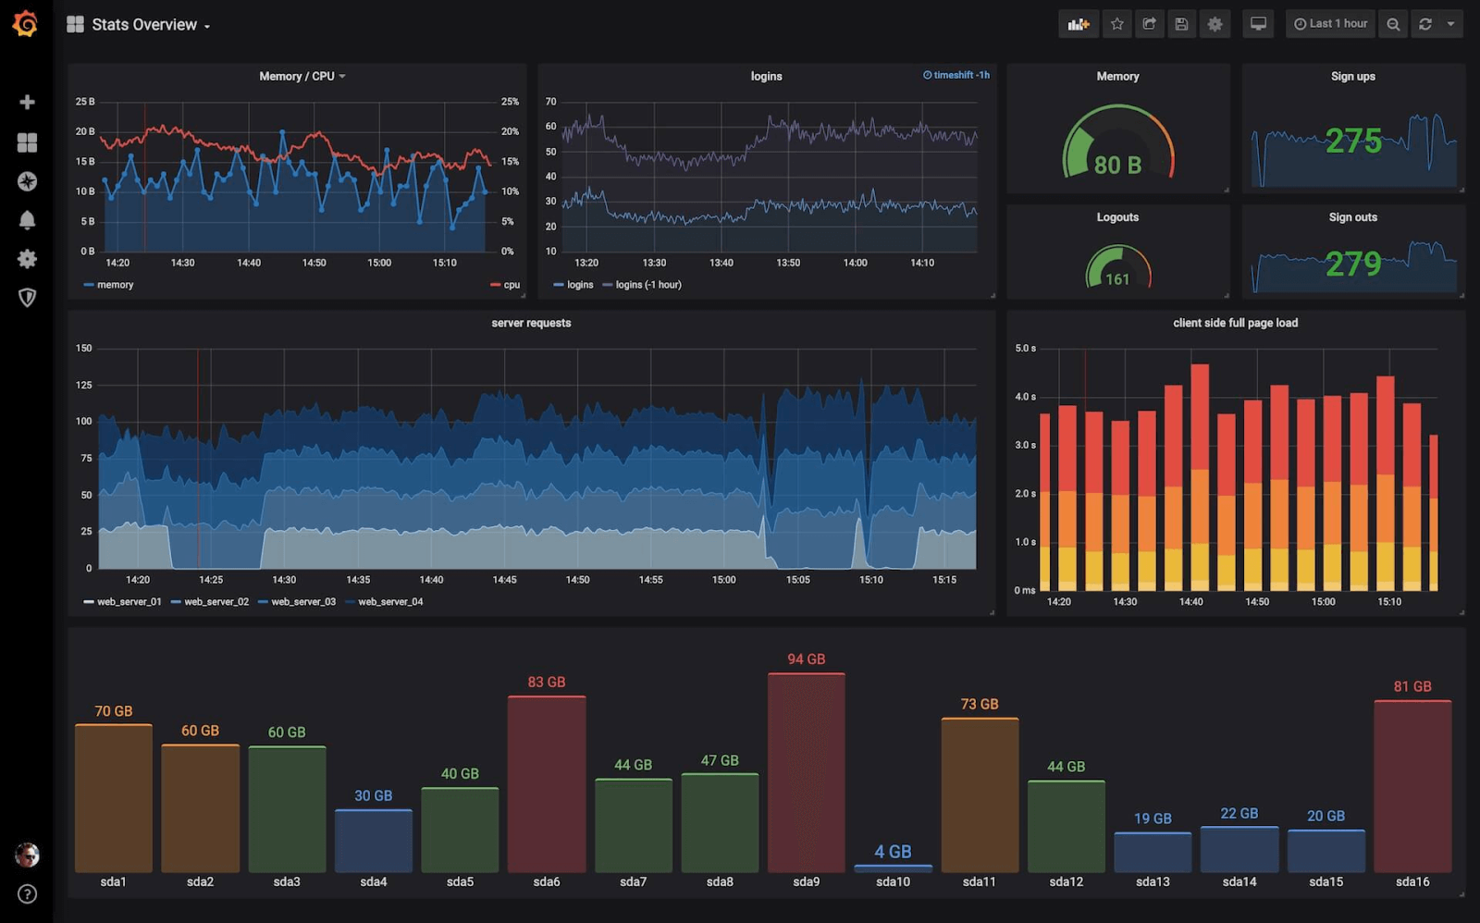
Grafana ist eine Open-Source-Observability-Plattform von Grafana Labs, die Full-Stack-Monitoring sowohl in Cloud- als auch in selbst gehosteten Umgebungen ermöglicht.
Warum ich Grafana gewählt habe: Ich habe mich für Grafana entschieden, weil es Open-Source ist und zahlreiche nützliche Monitoring-Funktionen für Nutzer bietet, die einen selbstverwalteten Ansatz bevorzugen. Ein herausragendes Merkmal ist der Agent, mit dem Sie Telemetriedaten wie Traces, Logs und Metriken erfassen und an Ihren bevorzugten Endpunkt senden können – vorausgesetzt, dieser ist mit OpenTelemetry, Loki oder Prometheus kompatibel.
Herausragende Funktionen und Integrationen von Grafana:
Funktionen, die mich zur Empfehlung von Grafana bewogen haben, sind Transparenz und Zugänglichkeit. Da es Open-Source ist, haben Sie die Möglichkeit, eigene Funktionen zu entwickeln und profitieren im Allgemeinen von sichereren und kosteneffizienteren Produkten. Besonders gefällt mir auch, dass Sie eine vollständig interaktive Online-Demo ausprobieren können, ohne Kontakt zum Vertrieb aufnehmen zu müssen. Falls Ihr Projekt zusätzliche Monitoring-Anforderungen hat, können Sie ganz einfach weitere Grafana-Tools für Back-End- und Front-End-Überwachung integrieren, um Echtzeitdaten von Nutzern zu Logs, Metriken, Traces und Ereignissen zu sammeln.
Integrationen sind vorkonfiguriert für GitHub, GitLab, Jenkins, Consul, Traefik, Snowflake, CloudWatch, Kafka, Redis und Oracle Database.
Pros and Cons
Pros:
- Open-Source
- Leistungsstarke Datenvisualisierung
- Kostenlose interaktive Web-Demo
Cons:
- Logs werden nicht nativ gespeichert
- Erfordert tiefergehende technische Kenntnisse, um das Meiste herauszuholen
Weitere Tools zur Anwendungsüberwachung
Sie suchen noch? Hier sind weitere solide Tools, die mir bei meinen Recherchen aufgefallen sind und Ihnen zusätzliche Optionen bieten können.
- Google Cloud Operations
E APM für Google Cloud
- SolarWinds Server and Application Monitor
E Abhängigkeitszuordnung
- LogRocket
Am besten für E-Commerce-Unternehmen geeignet
- eG Innovations
Am besten für Node.js-Anwendungen
- Icinga
Am besten für Open-Source-Monitoring
- Dotcom Monitor
Am besten geeignet zur Simulation & zum Scripting von Nutzerverhalten


Wie ich Tools zur Anwendungsüberwachung bewerte
Ich bewerte Tools auf zwei Ebenen: die grundlegenden APM-Funktionen, die notwendig sind, um eine Latenzspitze durch Microservices zurückzuverfolgen, sowie die Unterscheidungsmerkmale, die ein Tool besser geeignet machen als ein anderes.
Kernfunktionen (Grundvoraussetzungen für diese Liste)
Wenn ich Tools für meine Liste auswähle, bewerte ich jedes einzelne auf einer Skala von 0 (bietet die Funktionalität nicht an) bis 5 (überzeugt in diesem Bereich) für jede unten aufgeführte Kernfunktion. Anschließend berechne ich die Gesamtpunktzahl des Tools als Prozentsatz. Jedes Tool muss eine minimale Gesamtpunktzahl von 75% erreichen, um berücksichtigt zu werden.
- Echtzeit-Performance-Überwachung: Ich prüfe, ob das Tool Antwortzeiten, Durchsatz und Ressourcenauslastung in Echtzeit darstellt – wie zum Beispiel das Erkennen eines plötzlichen Latenzanstiegs bei einer Checkout-API während einer Bereitstellung.
- Verteiltes Tracing: Das Nachverfolgen einer einzelnen Anfrage über Dutzende von Microservices hinweg ist der Punkt, an dem Tools ihren Wert beweisen. Daher bewerte ich, wie jedes Tool Abhängigkeiten abbildet und langsame Spans isoliert.
- Fehler- & Ausnahme-Tracking: Ich achte auf automatische Fehlergruppierung mit vollständigen Stacktraces und Kontextinformationen, beispielsweise um einen Anstieg der 500-Fehler einer bestimmten Version oder Umgebung zuordnen zu können.
- Benachrichtigungen & Anomalie-Erkennung: Gute Benachrichtigung geht über feste Schwellenwerte hinaus. Ich bewerte, ob Tools dynamische Basislinien unterstützen und Benachrichtigungen an Kanäle wie Slack oder PagerDuty weiterleiten.
- Metriken, Logs & APM-Dashboards: Das Korrelieren eines Speicherlecks in den Metriken mit einem passenden Log-Muster und einem langsamen Trace sollte in einer Ansicht möglich sein. Ich prüfe, wie gut jedes Tool diese Signale zusammenführt.
- Multi-Stack- & Cloud-Integration: Egal ob Ihr Stack auf Kubernetes, serverlosen Funktionen oder VMs in AWS, Azure oder GCP läuft – ich prüfe, wie breit die unterstützten Sprachen, Frameworks und Plattformen sind.
Sobald ich eine Liste von Tools habe, die diese Kriterien erfüllen, schaue ich, was jede Plattform besonders macht.
Unterscheidungsmerkmale (Was Anbieter unterscheidet)
So vergleiche und kontrastiere ich verschiedene Anbieter:
Herausragende Funktionen
AIOps-Fähigkeiten spielen hier eine Rolle – wenn ein Bereitschaftsingenieur um 2 Uhr nachts benachrichtigt wird, kann eine automatisierte Ursachenanalyse die Fehlerbehebung von Stunden auf Minuten verkürzen. Ich bewerte außerdem Real User Monitoring, das aufzeigt, wie tatsächliche Nutzer Ihre Anwendung erleben, anstatt sich allein auf Serverdaten zu verlassen. Das Nachvollziehen von Releases ist ein weiteres Unterscheidungsmerkmal, das ich suche. Tools, die Fehler- oder Latenzspitzen mit einer bestimmten Bereitstellung verknüpfen, erleichtern die Entscheidung, ob man einen Rollback macht oder einen Fix weiter ausrollt.
Über die Funktionen hinaus
Preisvorhersehbarkeit ist ein großes Thema – Telemetrie-Kosten können schnell explodieren, deshalb bewerte ich, ob ein Anbieter nach Host, Datenvolumen oder Nutzer abrechnet und wie transparent die Kosten im großen Maßstab bleiben. Auch Integrationsmöglichkeiten sind wichtig. Ich prüfe auf native OpenTelemetry-Kompatibilität und Schnittstellen zu Incidence-Tools wie PagerDuty oder ServiceNow, da APM-Daten nur dann helfen, wenn sie Ihr Bereitschafts-Workflow tatsächlich erreichen. Sicherheits- und Compliance-Zertifikate wie SOC 2 Typ II und HIPAA sollten gerade dann früh geprüft werden, wenn Ihr Team sensible Daten verwaltet.
So wählen Sie ein Tool zur Anwendungsüberwachung aus
Lange Funktionslisten und komplexe Preisstrukturen können schnell verwirrend wirken. Damit Sie während Ihres individuellen Auswahlprozesses den Überblick behalten, finden Sie hier eine Checkliste wichtiger Aspekte:
| Faktor | Worauf achten? |
|---|---|
| Skalierbarkeit | Kann das Tool mit Ihrem Unternehmen mitwachsen? Stellen Sie sicher, dass steigender Traffic und Datenmengen ohne Leistungseinbußen verarbeitet werden. |
| Integrationen | Lässt sich das Tool in Ihre bestehende Software-Landschaft integrieren? Suchen Sie nach Kompatibilität mit bereits verwendeten Anwendungen, um Störungen zu vermeiden. |
| Anpassbarkeit | Lässt sich das Tool auf Ihre Anforderungen zuschneiden? Prüfen Sie die Flexibilität für Anpassungen an Ihre Workflows und Bedürfnisse. |
| Benutzerfreundlichkeit | Ist die Bedienoberfläche einfach verständlich? Erwägen Sie, wie schnell Ihr Team das Tool ohne großen Schulungsaufwand einsetzen kann. |
| Implementierung und Einführung | Wie lange dauert die Einrichtung? Achten Sie auf vorhandene Hilfsmittel wie Tutorials oder Support-Angebote, die den Umstieg erleichtern. |
| Kosten | Passt das Tool in Ihr Budget? Vergleichen Sie Preisstrukturen und berücksichtigen Sie langfristige Kosten sowie versteckte Gebühren oder Aufpreise. |
| Sicherheitsmaßnahmen | Sind Datenschutzmechanismen vorhanden? Prüfen Sie die Einhaltung von Branchenstandards und bewerten Sie Verschlüsselung sowie Zugriffskontrollen. |
Was sind Tools zur Anwendungsüberwachung?
Tools zur Anwendungsüberwachung sind Softwarelösungen, die darauf ausgelegt sind, die Leistung von Anwendungen zu überwachen, zu analysieren und zu verwalten. IT-Profis, Entwickler und Betriebsteams nutzen diese Tools in der Regel, um eine optimale Performance der Anwendungen und die Zufriedenheit der Nutzer zu gewährleisten.
Funktionen zur Überwachung, Alarmierung und Berichterstattung helfen, Probleme frühzeitig zu erkennen, die Verfügbarkeit sicherzustellen und Ressourcen zu optimieren. Diese Tools sorgen letztlich für ein beruhigendes Gefühl, indem sie einen reibungslosen und effizienten Betrieb der Anwendungen sicherstellen.
Funktionen
Bei der Auswahl von Tools zur Anwendungsüberwachung sollten Sie auf die folgenden Schlüsselfunktionen achten:
- Echtzeitüberwachung: Überwacht kontinuierlich die Anwendungsleistung, um Probleme sofort zu erkennen und zu beheben.
- Benachrichtigungssystem: Sendet Benachrichtigungen an Nutzer, wenn Leistungskennzahlen außerhalb akzeptabler Schwellenwerte liegen, um eine schnelle Reaktion zu ermöglichen.
- Fehlerverfolgung: Erkennt und protokolliert Fehler in Anwendungen, damit Entwickler Probleme effizient beheben können.
- Anpassbare Dashboards: Ermöglicht es den Nutzern, die Oberfläche so anzupassen, dass die relevantesten Daten für ihre spezifischen Anforderungen angezeigt werden.
- Integrationen: Verbindet sich nahtlos mit anderen Tools und Hardware-Überwachungssoftware für einen durchgängigen Workflow und Datenaustausch.
- Skalierbarkeit: Passt sich wachsenden Geschäftsanforderungen an und verarbeitet mehr Daten und Traffic, ohne die Leistung zu beeinträchtigen.
- Überwachung der Benutzererfahrung: Bewertet Interaktionen der Endnutzer, um eine optimale Funktionalität und Zufriedenheit sicherzustellen.
- Datenvisualisierung: Wandelt komplexe Daten in leicht verständliche Diagramme und Grafiken zur besseren Analyse um.
- Sicherheitsmaßnahmen: Schützt sensible Daten durch Verschlüsselung und Zugriffskontrollen und sorgt für die Einhaltung von Branchenstandards.
- Berichterstattungsfunktionen: Erstellt detaillierte Berichte zur Anwendungsperformance und liefert wertvolle Einblicke für fundierte Entscheidungen.
Vorteile
Die Implementierung von Tools zur Anwendungsüberwachung bietet Ihrem Team und Ihrem Unternehmen mehrere Vorteile. Auf einige davon können Sie sich freuen:
- Verbesserte Verfügbarkeit: Diese Tools sorgen durch Echtzeitüberwachung für ein schnelles Erkennen von Problemen und halten Anwendungen reibungslos am Laufen.
- Effizientere Fehlerbehebung: Fehlerverfolgung und Benachrichtigungssysteme ermöglichen eine schnellere Problemlösung, wodurch Ausfallzeiten und Nutzerfrust reduziert werden.
- Optimierte Nutzererfahrung: Die Überwachung der Interaktionen von Nutzern stellt sicher, dass die Anwendungen den Leistungserwartungen entsprechen und steigert so die Zufriedenheit.
- Datenbasierte Einblicke: Berichte und Datenvisualisierungen liefern umsetzbare Erkenntnisse, die Teams fundierte Entscheidungen treffen lassen.
- Skalierbarkeit: Tools, die an steigenden Daten- und Trafficbedarf angepasst werden können, gewährleisten eine konstante Leistung während Ihres Unternehmenswachstums.
- Kosteneinsparungen: Durch die Vermeidung größerer Ausfälle und die Optimierung der Ressourcennutzung helfen diese Tools, Betriebskosten zu senken.
- Sicherheitsgarantie: Funktionen wie Sicherheitsmaßnahmen schützen sensible Daten, erhalten die Compliance aufrecht und stärken das Vertrauen der Nutzer.
Kosten & Preise
Die Auswahl von Tools zur Anwendungsüberwachung erfordert das Verständnis der verschiedenen verfügbaren Preismodelle und -pläne. Die Kosten hängen von Funktionen, Teamgröße, Zusatzoptionen und mehr ab. Die folgende Tabelle fasst übliche Pläne, deren Durchschnittspreise sowie die typischerweise enthaltenen Funktionen von Anwendungsüberwachungslösungen zusammen:
Vergleichstabelle: Pläne für Tools zur Anwendungsüberwachung
| Plan-Typ | Durchschnittspreis | Gemeinsame Funktionen |
|---|---|---|
| Kostenloser Plan | $0 | Basisüberwachung, begrenzte Datenaufbewahrung und Community-Support. |
| Persönlicher Plan | $5-$25/user/month | Echtzeit-Benachrichtigungen, Basisberichte und E-Mail-Support. |
| Business-Plan | $30-$75/user/month | Erweiterte Analysen, Integration mit anderen Tools und telefonischer Support. |
| Enterprise-Plan | $100-$250/user/month | Anpassbare Dashboards, dedizierte Account-Betreuung und Prioritäts-Support. |
Häufig gestellte Fragen zu Application Monitoring Tools
Hier finden Sie Antworten auf häufig gestellte Fragen zu Application Monitoring Tools:
Können Application Monitoring Tools mit bestehender Software integriert werden?
Ja, die meisten Application Monitoring Tools können mit bestehenden Softwaresystemen integriert werden. Sie bieten häufig APIs und vorgefertigte Connectoren für beliebte Plattformen wie AWS, Azure und Slack an. Dadurch wird ein nahtloser Datenfluss und eine effiziente Zusammenarbeit innerhalb Ihres Tech-Stacks ermöglicht und die Gesamtleistung gesteigert.
Wie gehen Application Monitoring Tools mit Datenschutz um?
Application Monitoring Tools legen großen Wert auf Datenschutz, indem sie Verschlüsselung und Zugriffskontrollen einsetzen. Prüfen Sie bei der Auswahl eines Tools dessen Datenschutzrichtlinien und die Einhaltung von Vorschriften wie der DSGVO oder HIPAA. Wählen Sie immer ein Tool, das den Datenschutzanforderungen Ihrer Organisation entspricht.
Benötigen diese Tools Agents und wie unterscheidet sich die Installation?
Die meisten Tools nutzen Agents, um tiefere Einblicke in Anwendungen und Infrastruktur zu erhalten. Die Installationsmethoden reichen von einfachen Skripten über Container-basierte Bereitstellung bis hin zu Paketmanagern. Einige Tools bieten agentenlose Optionen an, allerdings meist mit eingeschränkter Funktionalität oder Sichtbarkeit.
Ist technisches Fachwissen erforderlich, um Application Monitoring Tools zu nutzen?
Nein, es ist kein umfangreiches technisches Fachwissen erforderlich, um Application Monitoring Tools zu verwenden. Viele Tools bieten benutzerfreundliche Oberflächen sowie Anleitungen und Support, die den Einstieg erleichtern. Ein grundlegendes Verständnis der Architektur Ihrer Anwendung kann jedoch dabei helfen, die Daten effektiver zu interpretieren.
Welche Bereitstellungsmodelle unterstützen Application Monitoring Tools?
Die Bereitstellungsoptionen variieren je nach Tool – einige sind ausschließlich als SaaS verfügbar, andere unterstützen auch lokale oder hybride Umgebungen. Das gewählte Bereitstellungsmodell beeinflusst, wie Daten gespeichert und abgerufen werden. Prüfen Sie immer, ob das Tool mit Ihrer bestehenden Infrastruktur kompatibel ist.
Wie geht es weiter:
Wenn Sie sich mit der Recherche zu Application Monitoring Tools beschäftigen, nehmen Sie Kontakt zu einem SoftwareSelect-Berater auf und erhalten Sie kostenlose Empfehlungen.
Sie füllen ein Formular aus und führen ein kurzes Gespräch, in dem Ihre spezifischen Anforderungen besprochen werden. Anschließend erhalten Sie eine Shortlist von Software-Lösungen zur Auswahl. Die Berater unterstützen Sie sogar während des gesamten Kaufprozesses, inklusive Preisverhandlungen.