10 Beste Log-Analyse-Tools, um das Backend von 2026 zu beherrschen

10 Die besten Tools zur Log-Analyse: Shortlist


Das Navigieren durch Logdateien, insbesondere zwischen Betriebssystemen wie Windows und komplexen Firewalls, erfordert einen soliden Log-Analyzer. Diese Log-Analyse-Software wandelt System-, Server- und Anwendungslogs mithilfe von Indizierung um, um große Datenmengen aufzunehmen und zu strukturieren. Funktionen wie Echtzeitbenachrichtigungen, vordefinierte Normalisierungstechniken und spezialisierte Plugins machen das Sammeln von Logs mühelos.
Ein gutes Log-Management-Tool geht über die einfache Ereignisverwaltung hinaus und bietet aussagekräftige Diagramme aus Metriken, sodass Logs – egal ob vom Webserver oder anderswo – benutzerfreundlich werden. Diese Tools sind entscheidend, um Log-Nachrichten zu filtern, unschätzbare Einblicke zu bieten und eine problemlose Kommunikation in der heutigen digitalen Welt zu gewährleisten.
Warum Sie unseren Software-Bewertungen vertrauen können
Wir testen und bewerten seit 2023 Software. Als Technologie-Führungskräfte wissen wir, wie kritisch und herausfordernd es ist, die richtige Entscheidung bei der Softwareauswahl zu treffen.
Wir investieren viel in gründliche Recherche, um unserer Zielgruppe zu helfen, bessere Kaufentscheidungen zu treffen. Wir haben über 2.000 Tools für verschiedene Technikanwendungsfälle getestet und mehr als 1.000 umfassende Softwarebewertungen geschrieben. Erfahren Sie wie wir transparent bleiben und unsere Methodik der Softwarebewertung.
Zusammenfassung der besten Log-Analyse-Tools
Diese Vergleichstabelle fasst die Preisinformationen meiner Top-Auswahl an Tools zur Log-Analyse zusammen, damit Sie das beste für Ihr Budget und Ihre geschäftlichen Anforderungen finden.
| Tool | Best For | Trial Info | Price | ||
|---|---|---|---|---|---|
| 1 | Am besten geeignet für KI-gesteuerte Anwendungsleistung | Kostenlose Demo + 15-tägige kostenlose Testphase verfügbar | $21/user/month (jährlich abgerechnet) | Website | |
| 2 | Am besten für detaillierten Fehlerkontext | Kostenloser Plan + kostenlose Demo verfügbar | Ab $26/Monat (bei jährlicher Abrechnung) | Website | |
| 3 | Am besten für integriertes Plattform-Monitoring | 14-tägige kostenlose Testphase + kostenloser Plan verfügbar | $15/user/month (jährliche Abrechnung) | Website | |
| 4 | Am besten für Echtzeit-Logüberwachung | Kostenlose Demo verfügbar | Ab $0,09/GB/Monat | Website | |
| 5 | Am besten für hochvolumige Datenaufnahme | 30-tägige kostenlose Testphase | Ab $25.30 pro 1TB/Monat | Website | |
| 6 | Am besten geeignet für maschinelles Lernen-basierte UEBA | Kostenlose Demo verfügbar | Preise auf Anfrage | Website | |
| 7 | Am besten für die Erkennung von Log-Anomalien in Echtzeit | 14-tägige kostenlose Testversion + kostenlose Demo verfügbar | $15/user/month (jährliche Abrechnung) | Website | |
| 8 | Am besten geeignet für das Monitoring von Cloud-basierter Infrastruktur | Kostenlose 15-Tage-Testversion | $15/Benutzer/Monat (jährliche Abrechnung) | Website | |
| 9 | Am besten für entwicklerzentrierte Einblicke | Kostenlose Testversion + kostenlose Demo verfügbar | $99/Benutzer/Monat (jährlich abgerechnet) | Website | |
| 10 | Am besten geeignet für kontinuierliche Intelligenz | 30-tägige kostenlose Testphase | Preis auf Anfrage | Website |
-

TestDevLab
Visit Website -
Site24x7
Visit WebsiteThis is an aggregated rating for this tool including ratings from Crozdesk users and ratings from other sites.4.7 -
GitHub Actions
Visit WebsiteThis is an aggregated rating for this tool including ratings from Crozdesk users and ratings from other sites.4.8


Bewertungen der besten Log-Analyse-Tools
Nachfolgend finden Sie meine ausführlichen Zusammenfassungen der besten Log-Analyse-Tools, die es auf meine Shortlist geschafft haben. Meine Bewertungen geben Ihnen einen detaillierten Einblick in die wichtigsten Funktionen, Vor- u0026amp; Nachteile, Integrationen und ideale Anwendungsfälle jedes Tools, damit Sie das passende Tool für Ihre Anforderungen finden.

Dynatrace bietet eine fortschrittliche Überwachungslösung, die KI nutzt, um Einblicke in die Anwendungsleistung in unterschiedlichen Umgebungen zu liefern. Der Fokus auf KI-gestützte Analysen stellt sicher, dass Unternehmen Leistungsprobleme vorausschauend, präzise und gezielt erkennen und beheben können – mit einer Genauigkeit, die herkömmlichen Tools oft fehlt.
Warum ich Dynatrace ausgewählt habe:
Bei der Auswahl von Überwachungstools fiel meine Wahl auf Dynatrace, da die Lösung besonders auf künstliche Intelligenz setzt. Im Vergleich mit anderen Lösungen wurde klar, dass Dynatrace einen einzigartigen Ansatz für das Application Performance Management verfolgt und mithilfe von KI proaktivere und tiefgreifendere Erkenntnisse ermöglicht. Ich habe es als das 'Beste für KI-gesteuerte Anwendungsleistung' bewertet.
Hervorstechende Funktionen und Integrationen:
Zu den Kernfunktionen von Dynatrace gehören KI-Analysen in Echtzeit, automatische Ursachenanalyse und Full-Stack-Monitoring, wodurch es sich als ganzheitliche Lösung für komplexe Anwendungen erweist. Bei Integrationen verbindet sich Dynatrace nahtlos mit Plattformen wie AWS, Azure und Google Cloud, sodass Unternehmen ihre Anwendungen in verschiedenen Cloud-Umgebungen überwachen können.
Pros and Cons
Pros:
- KI-gestützte Analysen liefern proaktive Erkenntnisse
- Full-Stack-Monitoring deckt alle Aspekte von Anwendungen ab
- Effiziente Ursachenanalyse beschleunigt die Problemlösung
Cons:
- Die Ersteinrichtung erfordert möglicherweise fachkundige Unterstützung
- Die Preisgestaltung kann für kleinere Unternehmen ein Hindernis darstellen
- Einige fortgeschrittene Funktionen sind mit einer steilen Lernkurve verbunden

Für Entwickler und IT-Fachleute, die nach einem Tool zur Log-Analyse suchen, bietet Sentry eine überzeugende Lösung, die auf Ihre Bedürfnisse zugeschnitten ist. Es liefert Echtzeit-Einblicke in das Anwendungsverhalten mit ausführlichem Fehlerkontext und unterstützt Teams dabei, Probleme schnell zu erkennen und zu beheben. Durch die Integration in Plattformen wie GitHub und Slack fördert Sentry eine reibungslosere Zusammenarbeit und verbessert gleichzeitig die Zuverlässigkeit von Anwendungen und die Benutzererfahrung.
Warum ich Sentry ausgewählt habe
Ich habe Sentry aufgrund seiner Fähigkeit gewählt, einen detaillierten Fehlerkontext direkt innerhalb von Loganalyse-Workflows bereitzustellen. Es zeigt, wo ein Fehler aufgetreten ist, in welcher Umgebung er aufgetreten ist und den genauen betroffenen Code, sodass Teams Probleme schneller und präziser beheben können. Die Integrationen mit Tools wie Slack und Jira helfen Teams zudem, synchron zu bleiben und schnell auf auftretende Probleme zu reagieren.
Sentry Hauptfunktionen
Neben einem ausführlichen Fehlerkontext bietet Sentry:
- Session Replay: Liefert eine visuelle Wiedergabe von Nutzerinteraktionen, um den Nutzerpfad nachzuvollziehen und Probleme zu identifizieren.
- Tracing: Stellt detaillierte Leistungsdaten bereit und verfolgt Anfragen über verschiedene Dienste hinweg, um Engpässe aufzudecken.
- Code Coverage: Analysiert Codeausführungspfade, um eine umfassende Testabdeckung und effektives Debugging sicherzustellen.
Sentry Integrationen
Zu den Integrationen gehören GitHub, Slack, Jira, GitLab, Bitbucket, Trello, Microsoft Teams, PagerDuty, Opsgenie und Datadog.
Pros and Cons
Pros:
- Fortschrittliche Fehlergruppierung hilft, Probleme zur schnellen Behebung zu priorisieren
- Bietet Echtzeit-Fehlerüberwachung für Web-, Mobil- und Backend-Apps
- Verteiltes Tracing liefert Einblicke auf Transaktionsebene in die Leistung
Cons:
- Nicht alle Integrationen sind nativ verfügbar und erfordern für einige Drittanbieter-APIs
- Begrenzte Benachrichtigungen und Anwendungseinblicke bei niedrigeren Tarifplänen
New Product Updates from Sentry

Sentry Adds Log Export in CSV and JSONL
Sentry now supports exporting up to 10,000 log lines from Explore → Logs in CSV or JSON Lines, with downloads available in-browser or as background downloads and email. For more information, visit Sentry's official site.
 .
.
Datadog ist ein umfassender Überwachungsdienst, der Informationen aus verschiedenen Quellen sammelt und sie für eine klare Beobachtung und gezielte Maßnahmen verarbeitet. Datadog bietet detaillierte Einblicke in die gesamte Stack-Überwachung, von der Infrastruktur bis hin zu Anwendungen.
Warum ich Datadog gewählt habe:
Ich habe mich für Datadog entschieden, weil es einen ganzheitlichen Ansatz für die Überwachung bietet. Unter den zahlreichen Tools, die ich geprüft habe, überzeugte Datadog durch seine umfassenden Fähigkeiten. Besonders angesichts der zentralen Bedeutung einer integrierten Überwachungsplattform passt Datadog perfekt, da es verschiedene Metriken auf einer zentralen Plattform vereint.
Besondere Funktionen und Integrationen:
Datadog vereint Infrastrukturmetriken, Traces und Logs, mit Anomalieerkennung zur Identifizierung von Unregelmäßigkeiten. Es lässt sich in verschiedene Cloud-Anbieter, Datenbanken und Tools wie Slack und Microsoft Teams integrieren, wodurch es sich an jedes Unternehmensumfeld anpassen lässt.
Pros and Cons
Pros:
- Umfangreiche Integrationsmöglichkeiten
- Vollständige Stack-Transparenz
- Fortschrittliche Anomalieerkennung
Cons:
- Höhere Einstiegshürde für Anfänger
- Begrenzte Anpassungsmöglichkeiten für Dashboards
- Einige Nutzer berichten von gelegentlicher Verzögerung bei Alarmen
Logmanager ist eine Plattform für Log-Analyse und SIEM, die die zentrale Sammlung von Logs mit verlustfreier Aggregation über TCP ermöglicht. Sie erlaubt die Echtzeitsuche, Filterung und Visualisierung von Logs, während benutzerdefinierte Tags und Anreicherung die Untersuchungen beschleunigen und eine konforme, manipulationssichere Aufbewahrung gewährleisten.
Warum ich Logmanager ausgewählt habe:
Ich habe Logmanager ausgewählt, weil es sofortige Transparenz in Ihre Infrastruktur durch Echtzeit-Logüberwachung und dynamische Dashboards bietet. Dies hilft dabei, Leistungs- oder Sicherheitsprobleme im Moment ihres Auftretens zu erkennen, sodass Ihrem Team mehr Zeit für die Reaktion bleibt. Außerdem schätze ich die Unterstützung für über 140 Logquellen, mit denen Sie Systemprotokolle, Netzwerkaktivitäten und Anwendungsereignisse in einer Ansicht zusammenführen können. Für Teams, die sich auf Compliance und betriebliche Resilienz konzentrieren, sind die zuverlässige Datenverfügbarkeit und prüfbereite Berichte von Logmanager ein starker Allrounder.
Herausragende Funktionen und Integrationen von Logmanager:
Zu den Funktionen gehören anpassbare Dashboards für zentrale Überwachung, hochverfügbare Speicherung zur Sicherung von Logdaten und integrierte Compliance-Berichte zur Unterstützung von Audits und regulatorischen Anforderungen. Das Tool bietet außerdem eine No-Code-Konfiguration für eine einfache Einrichtung sowie eine kontextuelle Loganreicherung für tiefere Einblicke. Zu den Integrationen zählen Apache, Cisco, Microsoft, VMware, Fortinet, IBM, HP, Juniper, Symantec, ESET, NGINX und MySQL.
Pros and Cons
Pros:
- Integrierte Compliance-Berichterstattung
- Logdatenanreicherung mit Kontextinformationen
- Zentrale Logüberwachung und Alarmierung
Cons:
- Begrenzte SaaS-Bereitstellungsoptionen
- Erweiterte Anpassungen können komplex sein
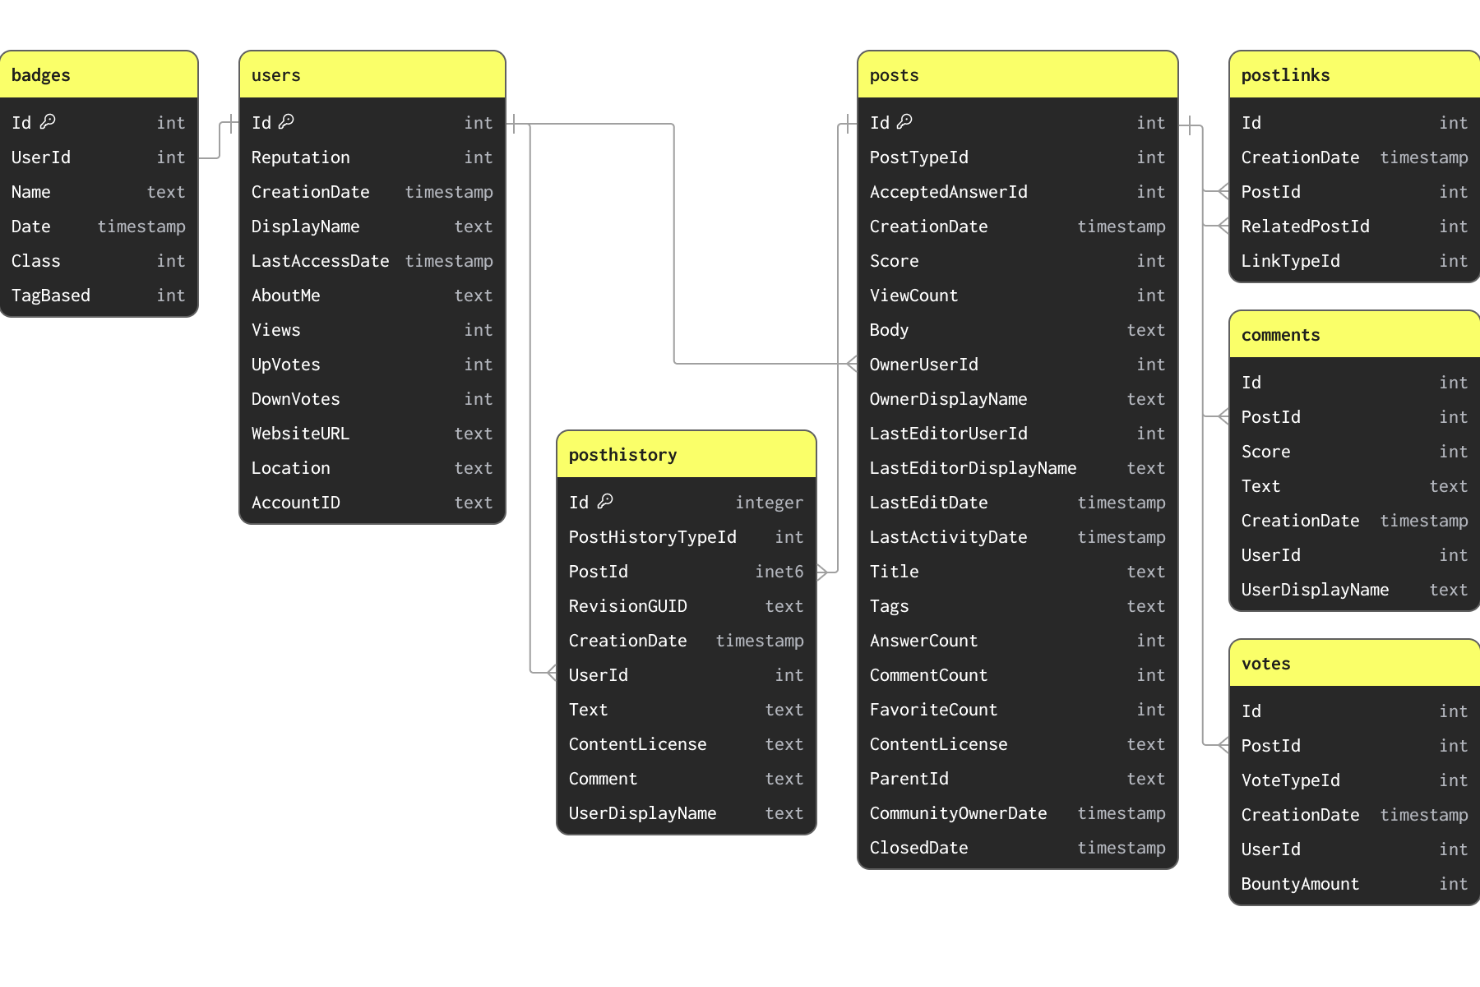
ClickHouse ist eine Open-Source-Spaltendatenbank zur Log-Analyse, die Echtzeit-SQL-Abfragen, schnelle Datenaufnahme, Volltextsuche und native Unterstützung für OpenTelemetry-Telemetriedaten vereint.
Für wen ist ClickHouse am besten geeignet?
ClickHouse ist besonders geeignet für Daten- und Plattform-Engineering-Teams in mittleren bis großen Unternehmen, die hochfrequente Log- und Observability-Daten im großen Maßstab verwalten.
Warum ich ClickHouse gewählt habe
ClickHouse zählt zu meinen Favoriten, weil es analytische Abfragen großer Log-Datensätze verarbeitet, ohne Geschwindigkeit einzubüßen. Die vektorisierte Abfrageausführung nutzt dabei die volle Parallelität aller verfügbaren CPU-Kerne, sodass Aggregationen über Milliarden von Logzeilen in Millisekunden und nicht in Minuten durchgeführt werden. Besonders gefällt mir auch die Funktion der materialisierten Sichten, die die Rechenlast auf die Einfügezeit verlagern. Wiederholte Abfragen auf hochfrequente Logmuster liefern dadurch praktisch sofort Resultate.
Wichtige Funktionen von ClickHouse
- Volltextsuche mit invertierten Indizes: Durch tokenbasierte invertierte Indizes kann in unstrukturierten Logfeldern gesucht werden, ohne dass die gesamte Tabelle durchsucht werden muss.
- Native OpenTelemetry-Datenaufnahme: Akzeptiert Logs, Metriken und Traces direkt von OpenTelemetry-Collectoren über eine eingebaute HTTP-Schnittstelle.
- Daten-Skip-Indizes: Sekundärindizes auf Logfeldern wie Schweregrad oder Dienstname ermöglichen das Überspringen irrelevanter Datenblöcke zur Abfragezeit.
- Gestufter Speicher: Ältere Logdaten werden automatisch von schneller SSD auf kostengünstigeren Objektspeicher verschoben – basierend auf konfigurierbaren TTL-Regeln.
ClickHouse Integrationen
ClickHouse bietet über 100 Integrationen in den Bereichen Datenaufnahme, Visualisierung und Datenintegration, darunter Kafka, Grafana, Apache Flink, OpenTelemetry, Splunk, dbt, Prometheus, Tableau, Superset und Vector. Eine Unterstützung für Zapier ist nicht klar dokumentiert, aber ClickHouse stellt eine API bereit und unterstützt native Client-Bibliotheken in Python, Go, Java und Node.js für individuelle Integrationen.
Pros and Cons
Pros:
- Abfragen von Milliarden Logzeilen in Millisekunden
- Abfragen komprimierter Daten direkt auf Festplatte
- Open-Source unter der Apache 2.0-Lizenz
Cons:
- Das Aktualisieren oder Löschen vorhandener Datensätze ist schwierig
- Der Aufbau eines Multi-Node-Clusters erfordert fortgeschrittene Kenntnisse
Am besten geeignet für maschinelles Lernen-basierte UEBA
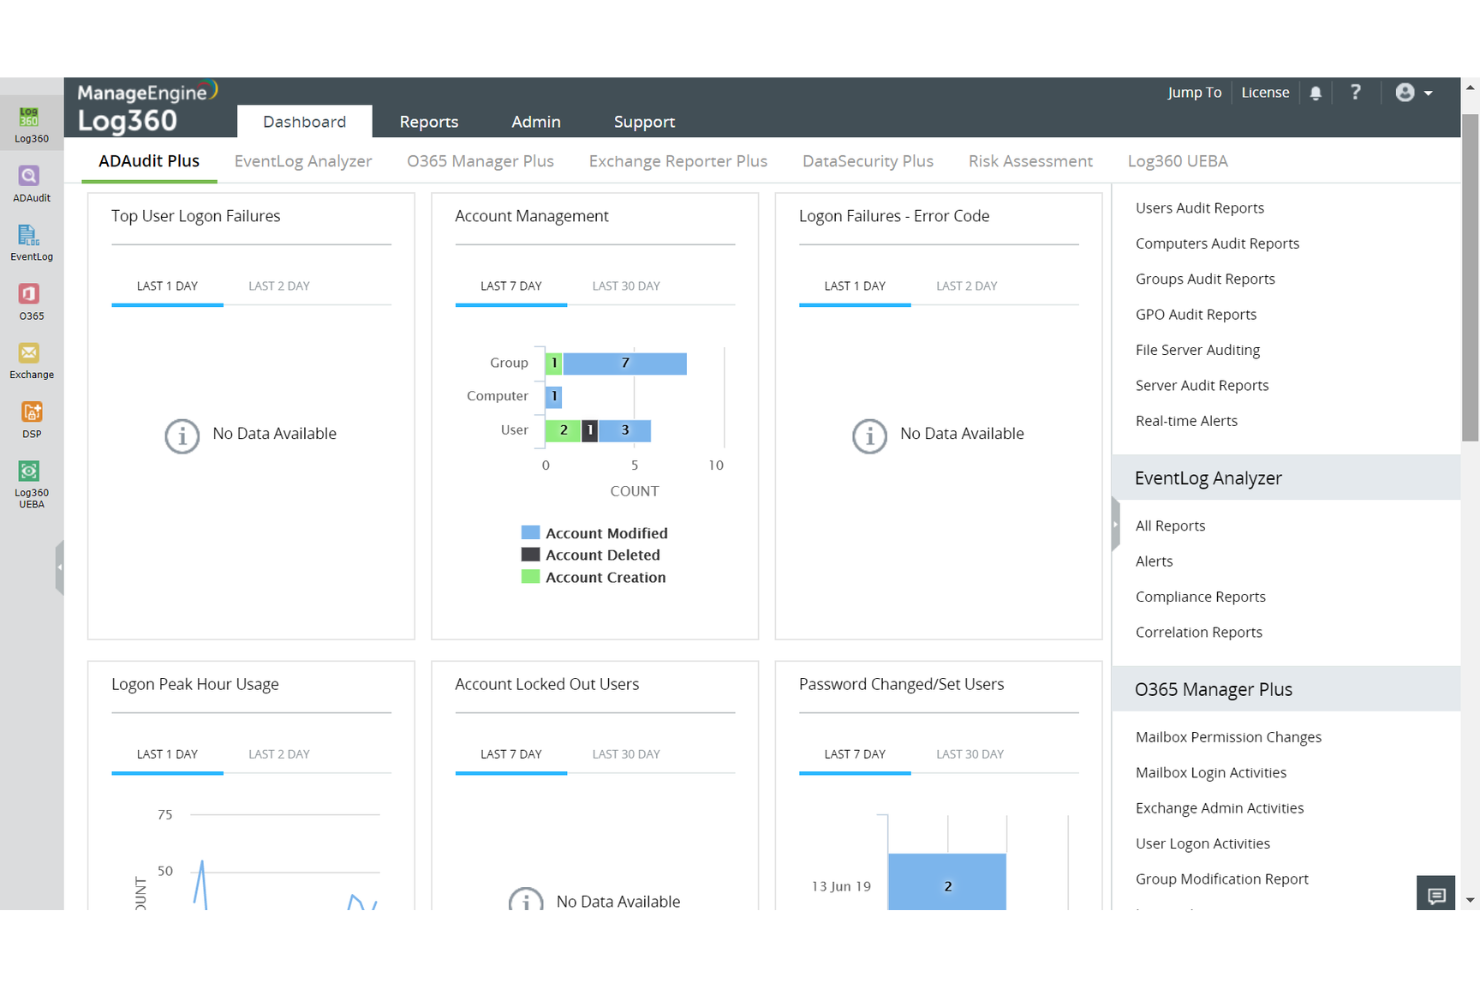
ManageEngine Log360 ist eine Security Information and Event Management (SIEM) Lösung, die Protokollanalyse, Bedrohungserkennung und Compliance-Berichterstattung in einer einheitlichen Plattform vereint. Sie wurde für Unternehmen entwickelt, die sowohl eine Echtzeit-Überwachung der IT-Sicherheit als auch umfassende Compliance-Funktionen in unterschiedlichen IT-Umgebungen benötigen.
Warum ich ManageEngine Log360 ausgewählt habe:
Ich habe mich für ManageEngine Log360 entschieden, weil es Sicherheit, Compliance und Benutzerverhaltensanalysen in einem zentralen Tool integriert. Im Gegensatz zu anderen Lösungen, die sich auf einen einzelnen Aspekt der Protokollanalyse spezialisieren, bietet Log360 eine ausgewogene Kombination aus Bedrohungserkennung, Überwachung der Dateiintegrität und Compliance-Berichterstattung. Die auf maschinellem Lernen basierende UEBA (Benutzer- und Entitätsverhaltensanalyse) hebt sich dadurch ab, dass sie Anomalien proaktiv erkennt, die bei traditionellen regelbasierten Systemen unentdeckt bleiben könnten.
Herausragende Funktionen und Integrationen:
ManageEngine Log360 bietet Echtzeit-Sicherheitsüberwachung, Active Directory-Auditing, Überwachung der Dateiintegrität und Sicherheitsorchestrierung (SOAR). Es verfügt über intuitive Dashboards, globale Bedrohungsinformationen sowie integrierte DLP- und CASB-Tools. Die Integration mit anderen ManageEngine-Produkten und Plattformen wie Veeam, Nginx, Cisco und Fortinet erfolgt nahtlos.
Pros and Cons
Pros:
- Echtzeit-Sicherheitsmanagement
- Benutzerfreundliche Dashboards
- Überwachung der Dateiintegrität
Cons:
- Langsam bei großen Datenmengen
- Komplexe Ersteinrichtung
New Product Updates from ManageEngine Log360
ManageEngine Log360 Adds New Log Source Integrations
ManageEngine Log360 introduced new integration support for NetFlow Analyzer and Firewall Analyzer, along with enhanced audit log parsing for OpManager products. The updates help teams centralize log collection and improve monitoring and analysis workflows. For more information, visit ManageEngine Log360's official site.
 .
.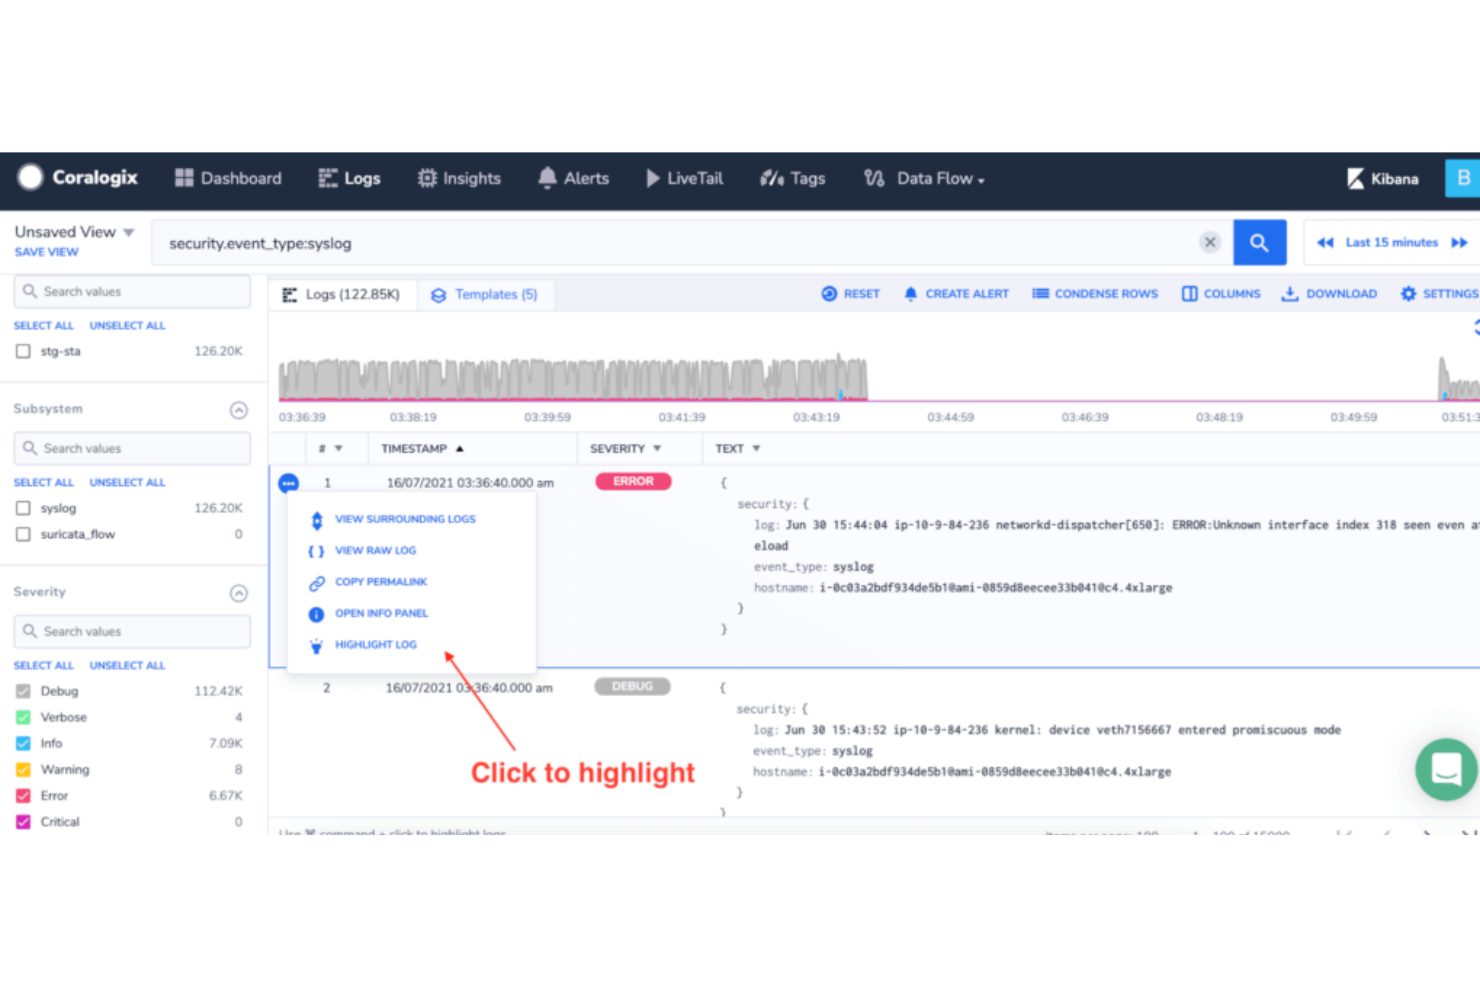
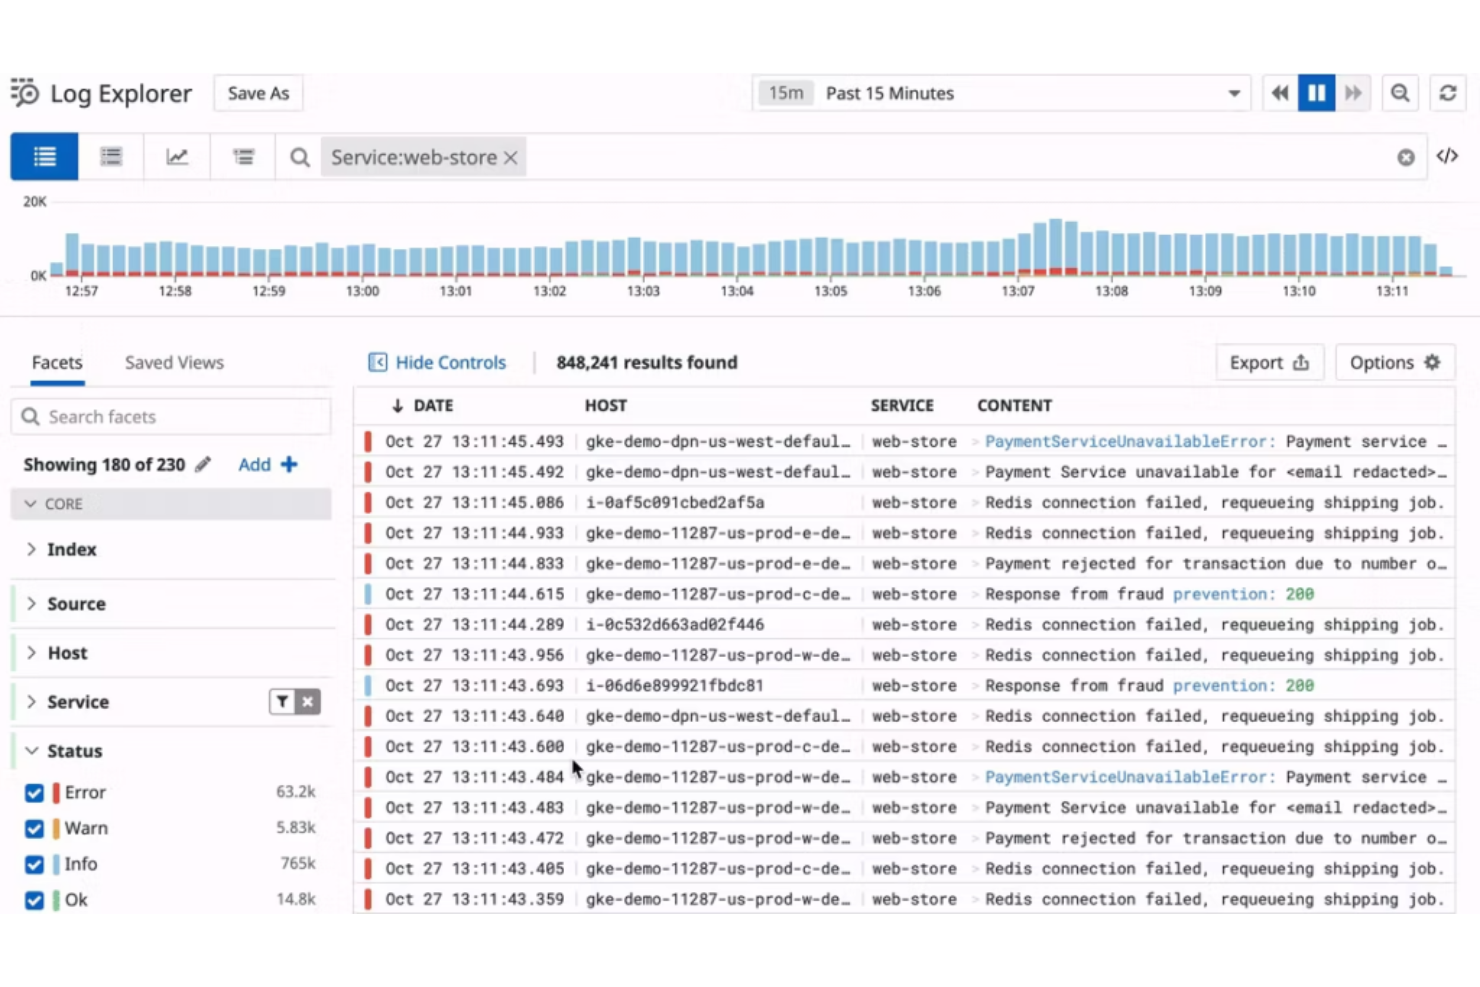
Coralogix bietet eine spezialisierte Plattform für Log-Management, die sich auf die Erkennung von Anomalien in großen Mengen von Logs in Echtzeit konzentriert. Das Tool ermöglicht rechtzeitige Eingriffe, indem es eine schnelle Erkennung und Identifikation unregelmäßiger Muster unterstützt – und wird damit seinem Ruf für herausragende Log-Anomalie-Erkennung gerecht.
Warum ich Coralogix gewählt habe:
Auf meiner Suche nach außergewöhnlichen Log-Management-Tools habe ich mich für Coralogix entschieden, weil der Fokus klar auf der Erkennung von Anomalien in Echtzeit liegt. Nach dem Vergleichen und Bewerten verschiedener Tools kam ich zu dem Schluss, dass Coralogix sich dadurch auszeichnet, dass es nicht nur Logs verfolgt, sondern sie in Echtzeit versteht. Diese Erkenntnis bestärkte mich, das Tool als 'Am besten für die Erkennung von Log-Anomalien in Echtzeit' einzustufen.
Herausragende Funktionen und Integrationen:
Im Zentrum der Fähigkeiten von Coralogix stehen Funktionen wie KI-gestützte Anomalie-Erkennung, sofortige Visualisierungen und Alarmmechanismen für schnelle Reaktionen. Was Integrationen betrifft, harmoniert Coralogix mit Plattformen wie Kubernetes, AWS und Slack und steigert damit seine Möglichkeiten für unmittelbare Reaktionen noch weiter.
Pros and Cons
Pros:
- Effektive KI-gestützte Anomalie-Erkennung
- Umfangreiche Visualisierung erleichtert die Interpretation von Logs
- Starke Integration mit beliebten Plattformen verbessert Echtzeit-Fähigkeiten
Cons:
- Die Benutzeroberfläche könnte für Einsteiger komplex erscheinen
- Bei größeren Datenmengen werden möglicherweise mehr Ressourcen benötigt
- Ausführliche Funktionen können eine gewisse Einarbeitung erfordern
Am besten geeignet für das Monitoring von Cloud-basierter Infrastruktur
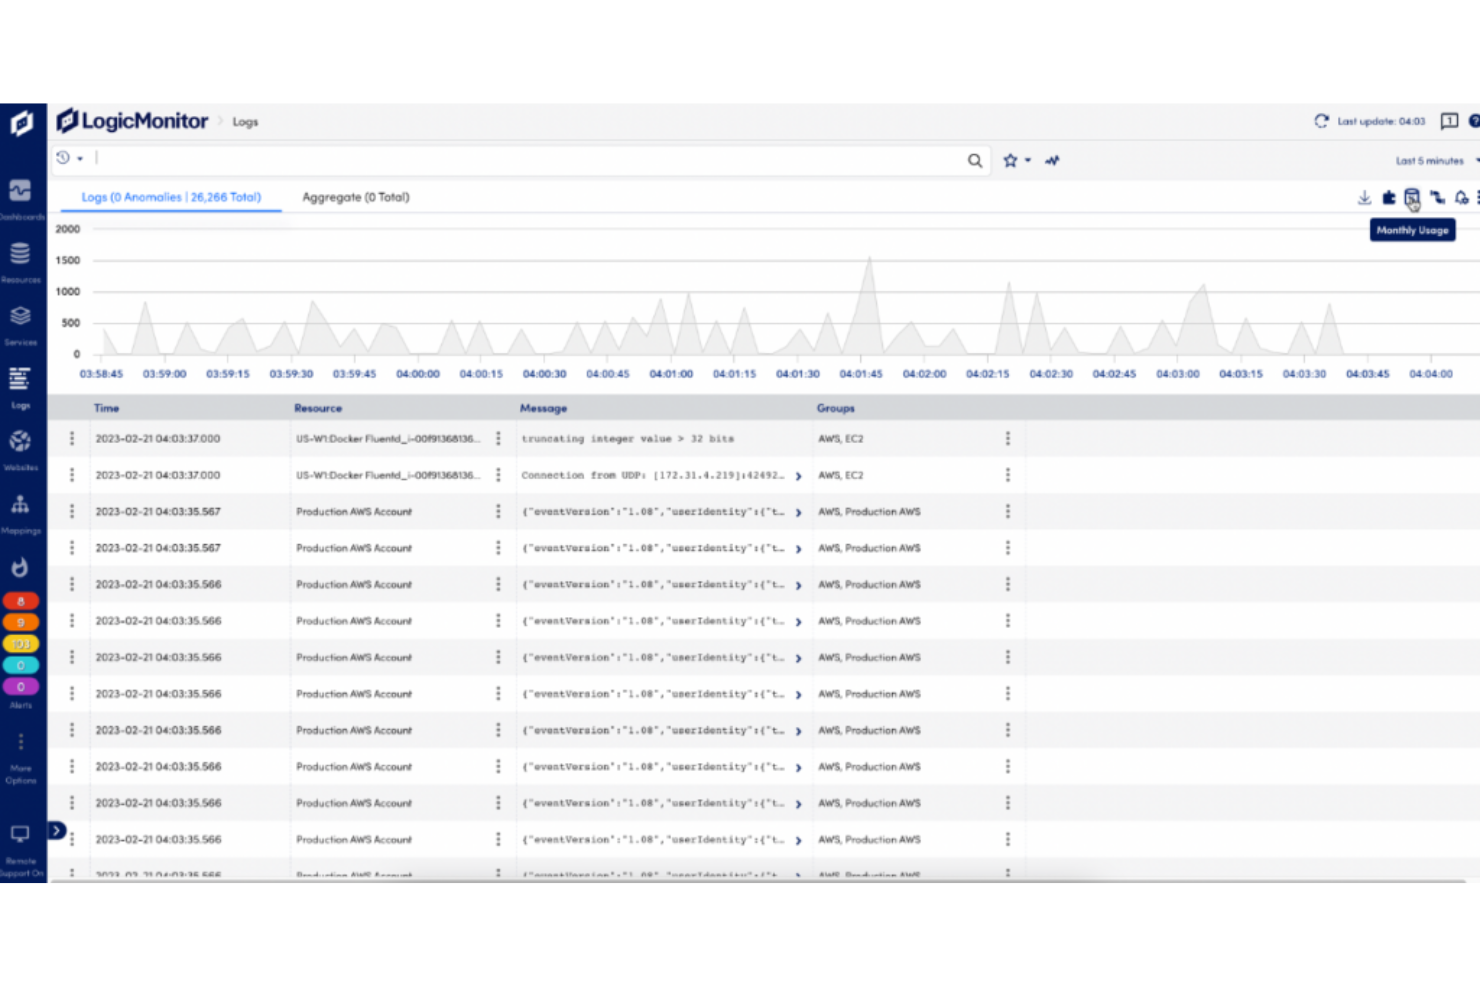
LogicMonitor hebt sich als umfassende SaaS-basierte Leistungs-Monitoring-Plattform hervor. Entwickelt für die moderne IT-Landschaft, taucht dieses Tool tief in Cloud-, Hybrid- und On-Premises-Infrastrukturen ein und liefert detaillierte Einblicke und zeitnahe Warnmeldungen.
Warum ich LogicMonitor ausgewählt habe:
Die Auswahl eines Tools, das das gesamte Spektrum von IT-Infrastrukturen abdeckt, erforderte sorgfältige Abwägung. LogicMonitor hat sich bei meinem Vergleich verschiedener Plattformen immer wieder an die Spitze gesetzt, insbesondere wegen seines besonderen Schwerpunkts auf Cloud-Infrastrukturen. Angesichts der zunehmenden Bedeutung von Cloud-Lösungen bin ich überzeugt, dass LogicMonitor zu Recht als 'Am besten geeignet für das Monitoring von Cloud-basierter Infrastruktur' gilt.
Herausragende Funktionen und Integrationen:
Zentrale Eigenschaften von LogicMonitor sind die automatische Geräteerkennung, die den Einrichtungsprozess erleichtert, sowie Prognose-Analysen, die auf Basis vergangener Daten Vorhersagen bieten. Bei den Integrationen bietet LogicMonitor Anbindungen an beliebte Plattformen wie ServiceNow, Slack und Puppet, was den Informationsfluss optimiert und die Zusammenarbeit innerhalb von IT-Teams verbessert.
Pros and Cons
Pros:
- Umfassende Abdeckung von Cloud-, Hybrid- und lokalen Infrastrukturen
- Leistungsstarke automatische Erkennung und Prognosetools
- Umfangreiche Bibliothek an Integrationen mit führenden IT-Tools
Cons:
- Die Benutzeroberfläche kann für Einsteiger komplex wirken
- Preisstruktur kann für manche Nutzer verwirrend sein
- Erfordert anfängliche Konfiguration für ein maßgeschneidertes Monitoring

New Relic hat sich als branchenführende Plattform für das Application Performance Management etabliert und konzentriert sich darauf, Teams Einblicke in die Leistung und das Verhalten ihrer Software zu geben.
Warum ich New Relic ausgewählt habe:
New Relic war eine eindeutige Wahl, als es darum ging, ein Tool zu finden, das auf Entwickler zugeschnittene Einblicke bietet. Es hebt sich durch seine entwicklerorientierten Telemetriedaten und die Detailgenauigkeit seiner Analysen hervor. Wie es Entwicklern die notwendigen Werkzeuge und Daten liefert, damit sie fundierte Entscheidungen treffen können, hat meine Meinung gefestigt, dass es wirklich „Am besten für entwicklerzentrierte Einblicke“ ist.
Herausragende Funktionen und Integrationen:
Echtzeit-Anwendungsüberwachung steht im Mittelpunkt des Angebots von New Relic und bietet einen klaren Überblick darüber, wie Anwendungen sich verhalten und performen. Darüber hinaus überzeugt die Plattform mit Funktionen wie verteiltem Tracing und Fehlersuche, sodass Entwickler Probleme präzise lokalisieren können. Bei den Integrationen verbindet sich New Relic gut mit Plattformen wie AWS, Azure und Google Cloud sowie mit Kollaborationstools wie Slack und Jira.
Pros and Cons
Pros:
- Echtzeitüberwachung bietet aktuelle Einblicke
- Umfassende Integrationen mit Cloud-Plattformen und Team-Kollaborationstools
- Entwicklerorientierte Funktionen ermöglichen eine präzise Fehlerbehebung
Cons:
- Kann für Neueinsteiger eine gewisse Lernkurve mit sich bringen
- Individuelle Instrumentierung kann komplex sein
- Die Preisgestaltung kann für kleinere Teams abschreckend sein
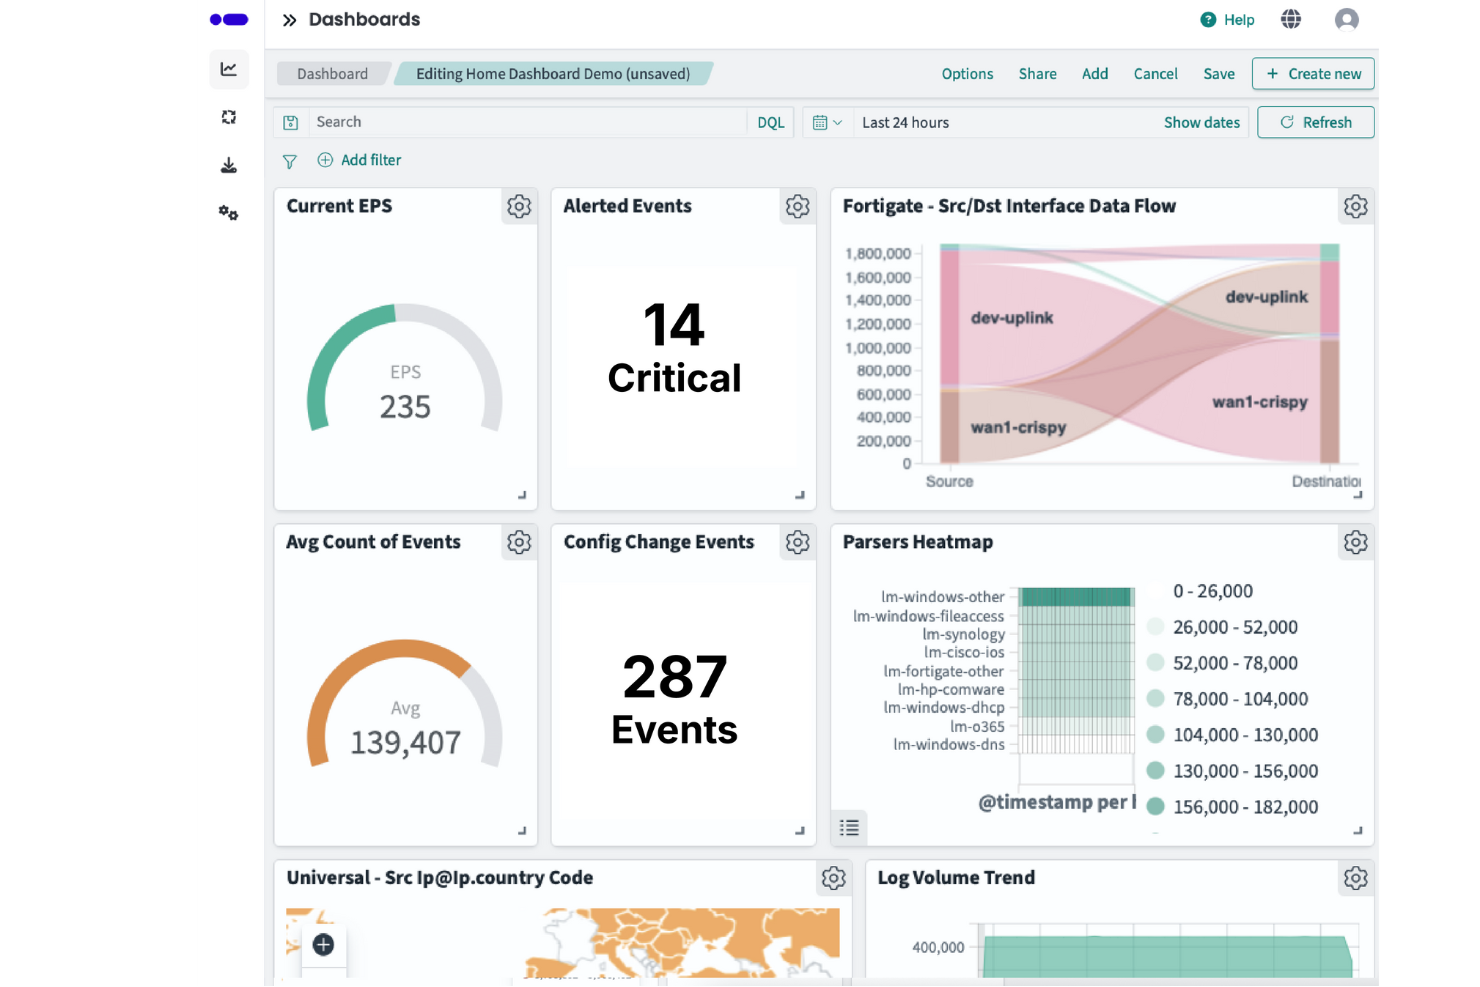
Sumo Logic ist eine cloudbasierte Plattform für Datenanalysen. Sie liefert Einblicke, die Teams dabei unterstützen, in dynamischen digitalen Umgebungen proaktiv und reaktionsfähig zu bleiben. Sumo Logic wird als 'Beste Wahl für kontinuierliche Intelligenz' anerkannt.
Warum ich Sumo Logic ausgewählt habe:
Bei der Auswahl eines Tools mit unvergleichlichen Fähigkeiten zur kontinuierlichen Intelligenz war Sumo Logic ein klarer Spitzenreiter. Sein einzigartiger Analyseansatz in Kombination mit dem Fokus auf Echtzeiteinblicke lässt es in einem umkämpften Markt hervorstechen. Ich bin der Meinung, dass Sumo Logic all das verkörpert, was 'am besten für kontinuierliche Intelligenz' bieten sollte, da es Teams die notwendigen Werkzeuge bereitstellt, um sich in einer ständig wandelnden digitalen Landschaft zurechtzufinden.
Herausragende Funktionen und Integrationen:
Kernstück von Sumo Logic sind die Echtzeit-Dashboards, die Teams stets einen aktuellen Überblick über ihre Datenlandschaft bieten. Die Funktionen für Log-Management und Cloud SIEM ermöglichen Unternehmen zudem eine starke Sicherheitslage. Was die Integrationen betrifft, verbindet sich Sumo Logic mit Plattformen wie AWS, Kubernetes und Terraform sowie mit diversen Incident-Management-Tools.
Pros and Cons
Pros:
- Echtzeit-Dashboards bieten einen konstanten Überblick über Datenentwicklungen
- Umfassende Integration mit Cloud-Plattformen und Incident-Management-Tools
- Cloud-native Architektur sorgt für Skalierbarkeit und Flexibilität
Cons:
- Kann für Anwender ohne Erfahrung mit fortgeschrittener Analytik überwältigend sein
- Manche Nutzer wünschen sich mehr granulare Kontrolle beim Daten-Parsing
- Abfragesprache erfordert für Neueinsteiger eine Lernkurve
Weitere Log-Analyse-Tools
Nachfolgend finden Sie eine Liste weiterer Log-Analyse-Tools, die ich auf meiner Shortlist hatte, die es aber nicht in die Top 10 geschafft haben. Sie sind auf jeden Fall einen Blick wert.
- IBM Instana
Am besten für End-to-End-Anwendungseinblicke
- Splunk Enterprises
E für groß angelegte Datenanalysen
- Logz.io
E Lösung für Open-Source-Log-Management
- Mezmo Log Analysis
Am besten für anpassbare Logdatenvisualisierung
- LogPoint
E Lösung für die Integration von Bedrohungsinformationen
- Site24x7
Am besten für umfassende Website-Überwachung


Auswahlkriterien für Log-Analyse-Tools
Bei der Auswahl der besten Log-Analyse-Tools für diese Liste habe ich typische Käuferbedürfnisse und Herausforderungen wie das Management von Datenmengen und das Sicherstellen von Echtzeitüberwachung berücksichtigt. Um meine Bewertung strukturiert und fair zu gestalten, habe ich außerdem den folgenden Rahmen genutzt:
Kernfunktionen (25 % der Gesamtbewertung)
Damit eine Lösung in diese Liste aufgenommen wird, musste sie diese gängigen Anwendungsfälle erfüllen:
- Erfassung von Logdaten aus mehreren Quellen
- Analyse und Visualisierung von Logdaten
- Echtzeitüberwachung und -benachrichtigung
- Bereitstellung von Such- und Filterfunktionen
- Gewährleistung von Datensicherheit und Compliance
Besondere Zusatzfunktionen (25 % der Gesamtbewertung)
Zur weiteren Unterscheidung habe ich zudem auf besondere Merkmale geachtet, etwa:
- Analyse mittels maschinellem Lernen
- Anpassbare Dashboards
- Integration mit Drittanbietertools
- Mehrsprachige Unterstützung
- Optionen für Cloud-Speicherung
Benutzerfreundlichkeit (10 % der Gesamtbewertung)
Um das Nutzungserlebnis einzuschätzen, habe ich folgende Aspekte bewertet:
- Intuitives Design der Benutzeroberfläche
- Einfache Navigation
- Anpassbare Benutzereinstellungen
- Minimale Einarbeitungszeit
- Zugänglichkeit auf verschiedenen Endgeräten
Onboarding (10 % der Gesamtbewertung)
Um das Onboarding-Erlebnis jeder Plattform zu bewerten, habe ich folgende Aspekte berücksichtigt:
- Verfügbarkeit von Schulungsvideos
- Interaktive Produkttouren
- Zugang zu Vorlagen und Leitfäden
- Live-Webinare und Workshops
- Unterstützung durch Chatbots
Kundensupport (10 % der Gesamtbewertung)
Um die Kundensupport-Leistungen jedes Softwareanbieters zu bewerten, habe ich folgende Aspekte berücksichtigt:
- Verfügbarkeit von Support rund um die Uhr (24/7)
- Reaktionszeit auf Anfragen
- Zugang zu einer Wissensdatenbank
- Verfügbarkeit eines Live-Chats
- Qualität des technischen Supports
Preis-Leistungs-Verhältnis (10 % der Gesamtbewertung)
Um das Preis-Leistungs-Verhältnis jeder Plattform zu beurteilen, habe ich folgende Aspekte berücksichtigt:
- Konkurrenzfähige Preispläne
- Verfügbarkeit von kostenlosen Testversionen
- Flexibilität bei den Abo-Optionen
- Kosten im Vergleich zu den angebotenen Funktionen
- Rabatte bei langfristigen Verträgen
Kundenbewertungen (10 % der Gesamtbewertung)
Um einen Eindruck von der allgemeinen Kundenzufriedenheit zu gewinnen, habe ich bei der Auswertung von Kundenrezensionen folgende Aspekte beachtet:
- Zufriedenheitsbewertungen von Nutzer:innen
- Feedback zur Benutzerfreundlichkeit
- Kommentare zum Kundensupport
- Erfahrungen mit der Zuverlässigkeit
- Meinungen zur Wirksamkeit der Funktionen
Wie wählt man ein Log-Analyse-Tool aus?
Lange Funktionslisten und komplizierte Preisstrukturen können schnell überfordern. Damit du bei deinem individuellen Auswahlprozess den Überblick behältst, findest du hier eine Checkliste mit wichtigen Faktoren:
| Faktor | Worauf achten? |
|---|---|
| Skalierbarkeit | Kann das Tool mit deinen Anforderungen wachsen? Prüfe, ob es steigende Datenmengen und Nutzerzahlen ohne Leistungseinbußen bewältigt. |
| Integrationen | Lässt es sich mit deinen bestehenden Systemen verbinden? Stelle sicher, dass APIs oder native Integrationen zu bereits genutzten Tools vorhanden sind. |
| Anpassbarkeit | Können Dashboards und Berichte an deinen Workflow angepasst werden? Suche nach Tools mit flexiblen Konfigurationsmöglichkeiten. |
| Benutzerfreundlichkeit | Ist die Benutzeroberfläche für dein Team intuitiv? Meide Tools, für die umfangreiche Schulungen nötig sind oder die eine steile Lernkurve haben. |
| Implementierung und Onboarding | Wie schnell kannst du mit dem Tool starten? Erkundige dich, ob der Anbieter Support, Schulungsmaterialien und einen klaren Einrichtungsprozess bietet, um Ausfallzeiten zu minimieren. |
| Kosten | Passen die Preise zu deinem Budget? Achte auf transparente Preismodelle und verschaffe dir Klarheit über etwaige Zusatzkosten für weitere Funktionen oder Nutzer:innen. |
| Sicherheitsvorkehrungen | Wie schützt das Tool deine Daten? Prüfe Verschlüsselungsstandards, Zugriffskontrollen und die Einhaltung von Datenschutzbestimmungen. |
| Support-Verfügbarkeit | Wann erreichst du den Support? Stelle sicher, dass du bei Bedarf zeitnah Unterstützung bekommst—etwa über einen 24/7 Support oder einen dedizierten Account-Manager für dringende Anliegen. |
Was ist ein Log-Analyse-Tool?
Log-Analyse-Tools sind spezialisierte Softwarelösungen, die darauf ausgelegt sind, große Mengen an maschinell generierten Log-Daten zu analysieren und auszuwerten. Sie helfen dabei, Muster zu erkennen, Systemprobleme zu beheben und wertvolle Erkenntnisse aus Datenquellen wie Servern, Anwendungen und Netzwerkgeräten zu gewinnen. Häufig werden sie von IT-Fachleuten, Systemadministratoren und Sicherheitsexperten eingesetzt, um Systemverfügbarkeit sicherzustellen, die Performance zu verbessern und potenzielle Sicherheitsrisiken zu erkennen.
Funktionen
Achte bei der Auswahl von Log-Analyse-Tools auf die folgenden Schlüsselfunktionen:
- Echtzeit-Überwachung: Bietet sofortige Einblicke in die Systemleistung und ermöglicht eine schnelle Erkennung und Reaktion auf Probleme.
- Datenvisualisierung: Stellt logische Daten grafisch dar, was die Interpretation und Analyse von Trends erleichtert.
- Such- und Filterfunktionen: Ermöglicht es Benutzern, bestimmte Logeinträge anhand von Schlüsselwörtern oder Kriterien schnell zu finden, was die Effizienz bei der Fehlersuche erhöht.
- Benachrichtigungsfunktionen: Sendet Meldungen über vordefinierte Ereignisse oder Unregelmäßigkeiten, damit Nutzer Probleme sofort angehen können.
- Integrationsunterstützung: Verbindet sich mit bestehender Software und Systemen und gewährleistet damit einen reibungslosen Datenfluss und erweiterte Funktionalitäten.
- Individuell anpassbare Dashboards: Ermöglichen den Nutzern, Ansichten und Berichte an ihre eigenen Arbeitsabläufe und Präferenzen anzupassen.
- Sicherheitsvorkehrungen: Schützt sensible Protokolldaten durch Verschlüsselung und Zugriffsbeschränkungen und stellt die Einhaltung von Datenschutzstandards sicher.
- Skalierbarkeit: Unterstützt wachsende Datenmengen und Nutzerzahlen ohne Leistungseinbußen und fördert damit das Unternehmenswachstum.
- Maschinelles Lernen für Analysen: Nutzt KI, um Muster zu erkennen und mögliche Probleme vorherzusagen, was proaktives Systemmanagement verbessert.
- Benutzerfreundliche Oberfläche: Sorgt für einfache Bedienbarkeit, reduziert die Einarbeitungszeit und erleichtert die schnelle Einführung im Team.
Vorteile
Die Implementierung von Log-Analyse-Tools bietet zahlreiche Vorteile für Ihr Team und Ihr Unternehmen. Hier sind einige, auf die Sie sich freuen können:
- Verbesserte Fehlersuche: Erkennt und behebt Probleme schnell durch Echtzeit-Überwachung und Suchfunktionen.
- Erhöhte Sicherheit: Schützt Ihre Daten mit Sicherheitsvorkehrungen und Benachrichtigungsfunktionen, die Sie bei verdächtigen Aktivitäten alarmieren.
- Effizienter Betrieb: Steigert die Produktivität durch Verringerung des Aufwands für die manuelle Protokollanalyse dank Automatisierung und Analysen durch maschinelles Lernen.
- Fundierte Entscheidungsfindung: Liefert Erkenntnisse durch Datenvisualisierung und unterstützt Sie so bei strategischen Entscheidungen.
- Skalierbarkeitsunterstützung: Wächst mit den Anforderungen Ihres Unternehmens und passt sich steigendem Datenvolumen und Benutzerbedarf an.
- Integration in individuelle Arbeitsabläufe: Passt sich nahtlos in Ihre bestehenden Abläufe ein durch Integrationsunterstützung und individuell anpassbare Dashboards.
- Proaktives Management: Sagt potenzielle Probleme mithilfe maschinellen Lernens voraus, sodass Teams sie schon vor der Eskalation beheben können.
Kosten und Preise
Bei der Auswahl von Log-Analyse-Tools ist es wichtig, die verschiedenen verfügbaren Preismodelle und Tarife zu verstehen. Die Kosten variieren je nach Funktionsumfang, Teamgröße, Zusatzmodulen und mehr. Die folgende Tabelle fasst gängige Tarife, ihre Durchschnittspreise und typische enthaltene Funktionen von Log-Analyse-Tools zusammen:
Vergleichstabelle für Log-Analyse-Tools
| Tariftyp | Durchschnittlicher Preis | Typische Funktionen |
|---|---|---|
| Kostenloser Tarif | $0 | Grundlegende Datenerfassung, begrenzter Speicherplatz und Community-Support. |
| Persönlicher Tarif | $5-$25/user/month | Echtzeit-Überwachung, einfache Benachrichtigung und eingeschränkte Integrationen. |
| Geschäftstarif | $50-$150/user/month | Erweiterte Analysen, anpassbare Dashboards und erweiterter Support. |
| Enterprise-Tarif | $200+/user/month | Umfassende Integrationsmöglichkeiten, dediziertes Account-Management und umfassende Sicherheitsfunktionen. |
FAQ zu Log-Analyse-Tools
Hier finden Sie Antworten auf häufig gestellte Fragen zu Log-Analyse-Tools:
Wie gehen Log-Analyse-Tools mit Daten aus mehreren Quellen um?
Log-Analyse-Tools sammeln Daten aus verschiedenen Quellen wie Servern, Anwendungen und Netzwerkgeräten. Sie bündeln diese Daten auf einer zentralen Plattform, sodass Sie alles an einem Ort anzeigen und analysieren können. Diese Konsolidierung hilft, Muster und Zusammenhänge zwischen unterschiedlichen Systemen zu erkennen.
Welche Arten von Benachrichtigungen kann ich mit Log-Analyse-Tools einrichten?
Mit Log-Analyse-Tools können Sie Benachrichtigungen für bestimmte Ereignisse oder Anomalien in Ihren Daten einrichten. Sie können diese Warnungen individuell auf Schwellenwerte, Muster oder bestimmte Log-Einträge anpassen. So kann Ihr Team schnell auf potenzielle Probleme reagieren, Ausfallzeiten minimieren und die Systemzuverlässigkeit sicherstellen.
Können Log-Analyse-Tools in bestehende Systeme integriert werden?
Ja, die meisten Log-Analyse-Tools bieten Integrationsmöglichkeiten für gängige Systeme und Anwendungen. Oft stehen APIs oder vorgefertigte Konnektoren zur Verfügung, um eine nahtlose Einbindung in Ihre bestehende IT-Infrastruktur zu ermöglichen. So können Sie Ihre aktuellen Systeme weiterhin nutzen und von einer verbesserten Log-Analyse profitieren.
Wie hoch ist die Lernkurve beim Einsatz von Log-Analyse-Tools?
Die Lernkurve unterscheidet sich je nach Komplexität des Tools und den Vorkenntnissen Ihres Teams mit ähnlicher Software. Viele Tools verfügen über benutzerfreundliche Oberflächen und umfangreiche Dokumentationen, die den Einstieg erleichtern. Schulungsressourcen wie Tutorials und Webinare sind ebenfalls häufig verfügbar, um Ihr Team schnell einzuarbeiten.
Gibt es Bedenken hinsichtlich der Skalierbarkeit von Log-Analyse-Tools?
Die Skalierbarkeit ist ein wichtiger Faktor, den es zu berücksichtigen gilt – viele Tools sind darauf ausgelegt, steigende Datenvolumina und Nutzerzahlen zu bewältigen. Sie lassen sich flexibel erweitern, sodass Ihr wachsender Bedarf ohne Leistungseinbußen abgedeckt werden kann. Es ist ratsam, die Skalierbarkeitsfunktionen jedes Tools zu prüfen, damit diese zu Ihren zukünftigen Anforderungen passen.
Gibt es kostenlose Log-Analyse-Tools?
Ja, einige Tools bieten kostenlose Versionen oder Open-Source-u003ca href=u0022https://thectoclub.com/tools/sumologic-alternative/u0022u003eSumo Logic Alternativenu003c/au003e an. u0022Elastic Stacku0022 bietet eine kostenlose Stufe und es gibt weitere Open-Source-Lösungen wie u0022Logstashu0022 und u0022Graylogu0022, die leistungsstarke Log-Analysefunktionen ohne Anfangskosten bieten. Allerdings können kostenlose Versionen Einschränkungen hinsichtlich der Funktionen, des Datenvolumens oder der Skalierbarkeit haben.
Wie geht es weiter:
Wenn Sie gerade Log-Analyse-Tools recherchieren, kontaktieren Sie einen SoftwareSelect-Berater für kostenlose Empfehlungen.
Sie füllen ein Formular aus und führen ein kurzes Gespräch, in dem Ihre spezifischen Anforderungen geklärt werden. Anschließend erhalten Sie eine Shortlist mit Software-Vorschlägen. Die Berater unterstützen Sie sogar während des gesamten Kaufprozesses, inklusive Preisverhandlungen.