10 Best Network Monitoring Software Reviewed for 2026

Best Network Monitoring Software Shortlist


Managing a network can be tough. You’re juggling multiple devices, keeping data secure, and ensuring everything runs smoothly. Network monitoring software can help with these challenges by offering insights and alerts, letting your team focus on what really matters.
I've tested and reviewed many of these tools to provide you with an unbiased look at the best options out there. In this article, you'll find a detailed review of the top network monitoring software that can meet your team’s needs.
I believe in offering well-researched, trustworthy information so you can make informed decisions. Let’s dive into what makes these tools stand out and how they can help your team succeed.
Why Trust Our Software Reviews
We’ve been testing and reviewing software since 2023. As tech leaders ourselves, we know how critical and difficult it is to make the right decision when selecting software.
We invest in deep research to help our audience make better software purchasing decisions. We’ve tested more than 2,000 tools for different tech use cases and written over 1,000 comprehensive software reviews. Learn how we stay transparent & our software review methodology.
Best Network Monitoring Summary
| Tool | Best For | Trial Info | Price | ||
|---|---|---|---|---|---|
| 1 | Best for endpoint management and patch compliance | 14-day free trial available | Pricing upon request | Website | |
| 2 | Best for visual representations of networks | 14-day free trial + free demo available | Pricing upon request | Website | |
| 3 | Best for proactive network issue prevention | 30-day free trial | From $179/month (billed annually) | Website | |
| 4 | Best for network visibility and device discovery | 30-day free trial + free demo available | From $129/technician/month (billed annually) | Website | |
| 5 | Best for multi-vendor network monitoring | Free demo available | From $245/25 devices | Website | |
| 6 | Best open-source solution | Free plan available | Pricing upon request | Website | |
| 7 | Best for scalable IT monitoring | Free plan + 30-day free trial available | From $275/month (billed annually) | Website | |
| 8 | Best for unified MSP management | 21-day free trial + free demo available | From $149/technician/month (billed annually) | Website | |
| 9 | Best for DNS security and threat prevention | Free trial + free demo available | Pricing upon request | Website | |
| 10 | Best for comprehensive device coverage | 30-day free trial + free demo available | From $10/month (billed annually) | Website |

-

TestDevLab
Visit Website -
Site24x7
Visit WebsiteThis is an aggregated rating for this tool including ratings from Crozdesk users and ratings from other sites.4.7 -
GitHub Actions
Visit WebsiteThis is an aggregated rating for this tool including ratings from Crozdesk users and ratings from other sites.4.8


Best Network Monitoring Software Reviews
Here you’ll find my choices for the best network monitoring software and tools:

NinjaOne gives IT teams a unified platform to monitor networks, manage endpoints, and automate patching across distributed environments, helping MSPs and internal IT departments reduce risk and maintain uptime.
Who Is NinjaOne Best For?
NinjaOne is a strong fit for MSPs and mid-sized IT teams that need centralized visibility and control across a large number of endpoints.
Why I Picked NinjaOne
NinjaOne earns its spot on my shortlist because of how tightly it connects endpoint visibility with automated patch compliance. I particularly like the Patch Intelligence AI feature, which analyzes telemetry and deployment signals to automatically flag unstable updates before they roll out—so my team doesn't have to research every KB article to decide what's safe to deploy. NinjaOne supports patching across Windows, macOS, Linux, and over 200 third-party applications from a single console, so I don't have to juggle separate tools for different OS environments. The condition-based remediation workflows also let my team automatically detect and correct endpoint issues at scale, without waiting on a technician to intervene.
NinjaOne Key Features
- Hardware and software inventory: Gives you a real-time view of every device in your environment, including hardware specs, installed software, warranty status, and performance data.
- Secure remote access: Lets you connect directly to any device to diagnose and resolve issues without switching to a separate remote access tool.
- Form-based script deployment: Build scripts in common languages and deploy them across your environment using interactive forms without editing code each time.
- Flexible device reporting: Customize device views with configurable columns and filters to surface the specific data your team needs to act on.
NinjaOne Integrations
Integrations include ServiceNow, CrowdStrike, SentinelOne, Microsoft Entra, Okta, PagerDuty, Bitdefender, ConnectWise Manage, IT Glue, and Slack.
Pros and Cons
Pros:
- Automated IT compliance reporting
- Detailed hardware and software inventory tracking
- Efficient multi-tenant management
Cons:
- Limited customization in dashboard design
- Dependency on cloud infrastrucutre
New Product Updates from NinjaOne
NinjaOne Adds Windows Agent Deployment to Network Discovery
NinjaOne adds Windows agent deployment directly from Network Discovery. This update helps IT teams move from discovering unmanaged Windows devices to monitoring, patching, and managing them faster. For more information, visit NinjaOne’s official site.
 .
.
Auvik gives IT teams and managed service providers a cloud-based platform to automatically discover, map, and monitor complex networks, helping them identify issues and maintain reliable infrastructure.
Who Is Auvik Best For?
Auvik is a strong fit for managed service providers and in-house IT teams that need to monitor and manage multi-site or multi-client network environments.
Why I Picked Auvik
Auvik earns its spot as one of the best on my shortlist because of how its automated network topology maps work in practice. The moment you install a collector, Auvik draws your network map from scratch—every switch, firewall, router, and IP-connected device appears with its Layer 1, 2, and 3 connections visible. I love that the map updates in real time as your network changes, so you're never working from a stale diagram when you're trying to trace an issue. On top of that, the path analysis feature lets you trace the route between any two devices and see alerts and performance data overlaid directly on that path, which makes root cause analysis much faster than jumping between separate tools.
Auvik Key Features
- Automated configuration backup: Auvik automatically backs up device configurations and lets you compare versions side-by-side to spot unauthorized changes.
- 64+ preconfigured alerts: Auvik ships with a library of pre-built alerts that surface directly on your live network map from day one, with no manual setup required.
- Multi-tenant dashboard: A centralized dashboard gives you real-time visibility across all sites and client environments from a single pane of glass.
- Network traffic analysis: Auvik monitors bandwidth usage, application flows, and geo data at the interface level so you can pinpoint performance bottlenecks.
Auvik Integrations
Integrations include ConnectWise, Autotask, ServiceNow, Slack, Microsoft Teams, Cisco Meraki, VMware, Palo Alto Networks, Fortinet, and an open API for custom integrations.
Pros and Cons
Pros:
- Quick and accurate alerting system
- Single dashboard monitoring
- Detailed visual graphical representation of networks
Cons:
- Could use more integrations
- Customizing the platform can be time consuming
New Product Updates from Auvik
Auvik Adds Aurora Troubleshooting Assistance
Auvik introduces Aurora Troubleshooting Assistance with AI-powered troubleshooting guidance, possible root causes, conversation downloads, and feedback tools. The open beta helps IT teams diagnose network issues faster with contextual recommendations tailored to specific devices and alerts. For more information, visit Auvik's official site.
 .
.
PRTG is a network monitoring platform built for IT teams and managed service providers who need to monitor complex infrastructures, spot issues fast, and keep business systems running smoothly.
Who Is PRTG Best For?
PRTG is a strong fit for mid-size to enterprise IT teams managing on-premises, cloud, or hybrid infrastructure across industries like healthcare, finance, and manufacturing.
Why I Picked PRTG
PRTG earns its spot on my shortlist because of how well it shifts network monitoring from reactive firefighting to genuine issue prevention. I particularly like the AI-driven anomaly detection, which continuously analyzes historical data to build intelligent baselines and flags deviations before they escalate into outages. On top of that, PRTG's customizable alert thresholds let my team fine-tune warning levels so we catch degrading conditions—like bandwidth creeping toward capacity—well before users notice anything. The smart sensor recommendations also surface monitoring gaps automatically, so nothing critical slips through undetected.
PRTG Key Features
- Sensor library: Choose from 250+ pre-configured sensor types covering SNMP, WMI, NetFlow, packet sniffing, and more to monitor virtually any device or protocol.
- Distributed monitoring: Monitor multiple remote locations from a single dashboard using remote probes, with TLS-encrypted communication between all components.
- Customizable reporting: Build and schedule reports using custom templates to share infrastructure status with stakeholders in a readable format.
- Real-time maps: Design live network maps with drag-and-drop tools that display current device and connection status across your entire infrastructure.
PRTG Integrations
Integrations include AWS, Microsoft Azure, VMware, Cisco, Dell EMC, NetApp, HPE, Oracle, Citrix, and Zoom. An HTTP API is also available for custom integrations.
Pros and Cons
Pros:
- Scalable for small and large networks
- Customizable monitoring and alerting
- User-friendly interface
Cons:
- More advanced features may come with a learning curve
- High cost for larger deployments
New Product Updates from PRTG
PRTG Introduces New Monitoring Sensors In Beta
This week, PRTG introduces three BETA sensors that broaden your monitoring scope for Proxmox VE clusters and SIMATIC S7-300/400 PLCs, giving you deeper operational insights. For more information, visit PRTG’s official site.
 .
.
For network administrators and IT professionals seeking to monitor and manage their networks, Atera offers a comprehensive solution. It is tailored for managed service providers and IT departments aiming to oversee multiple networks with ease. It addresses challenges like device discovery and network visibility, ensuring you can maintain a robust network infrastructure.
Who Is Atera Best For?
IT generalists and MSPs in small to mid-sized businesses serving distributed clients. It supports teams that need network visibility and automated device discovery within a unified management platform.
Why I Picked Atera
I picked Atera for its exceptional network visibility, which is crucial for any network monitoring tool. Atera's Network Discovery feature stands out, offering an in-depth view of all devices within a network. This feature automatically scans and updates the network inventory, ensuring you always have the latest information on your network assets. Additionally, its continuous monitoring capabilities track key metrics like CPU, RAM, and bandwidth usage, helping you maintain optimal network performance.
Atera Key Features
In addition to its network visibility, Atera offers several other features that enhance its functionality:
- Remote Monitoring and Management (RMM): This feature allows you to monitor your network's health and performance from a single dashboard.
- Automated Patch Management: Keep your systems up-to-date with automated patching, reducing vulnerabilities.
- Helpdesk and Ticketing System: Streamline your support process with an integrated ticketing system.
- Reporting and Analytics: Gain insights with detailed reports on network performance and issues.
Atera Integrations
Integrations include Microsoft Teams, Slack, Acronis, Splashtop, and an API is available for custom integrations.
Pros and Cons
Pros:
- Centralized inventory for network assets
- Real-time CVE vulnerability scanning
- Auto-discovery of devices
Cons:
- Some features require separate add-ons
- Customization options may feel limited
New Product Updates from Atera

Atera Adds Multiple API Tokens With Access Controls
Atera now supports multiple API tokens with configurable expiration dates, IP restrictions, and permission scopes, giving teams tighter control and safer delegation of API access. For more information, visit Atera's official site.

ManageEngine OpManager gives IT teams and network administrators a unified platform to monitor, troubleshoot, and manage complex network infrastructures across physical, virtual, and cloud environments.
Who Is ManageEngine OpManager Best For?
ManageEngine OpManager is a strong fit for mid-size to large enterprises running complex network infrastructures that span multiple device vendors and technology stacks.
Why I Picked ManageEngine OpManager
I picked ManageEngine OpManager as one of the best because of how well it handles environments where Cisco, Juniper, Fortinet, and HP devices coexist on the same network. Most teams run mixed-vendor stacks, and OpManager's SNMP-based device discovery classifies hardware by category—routers, switches, firewalls—regardless of vendor. I also like the network path analysis feature, which lets my team trace the route traffic takes across multi-vendor hops and pinpoint where degradation occurs. The AI-based adaptive thresholds adjust based on real-time performance trends, reducing the need to retune alert baselines when new devices from different vendors are added.
ManageEngine OpManager Key Features
- Network mapping: Automatically generates L1/L2 topology maps to visualize device relationships and pinpoint outages across your infrastructure.
- IT workflow automation: Lets you build automated response workflows to handle first-level fault troubleshooting and routine maintenance tasks without manual intervention.
- Storage capacity forecasting: Analyzes historical and current usage trends to predict when storage resources will be exhausted before it becomes a problem.
- Distributed network monitoring: Monitors network resources across remote branch offices and data centers from a single unified console using a probe-central architecture.
ManageEngine OpManager Integrations
Integrations include ServiceDesk Plus, NetFlow Analyzer, Network Configuration Manager, Firewall Analyzer, OpUtils, AlarmsOne, Applications Manager, Analytics Plus, Site24x7, and AssetExplorer.
Pros and Cons
Pros:
- Router performance metrics like temperature, voltage, and buffer statistics
- Mapping and visualization of performance degradation and network outages
- 2,000+ performance metrics for network monitoring
Cons:
- Complex setup and configuration process
- Limited customization options for dashboards and reports
New Product Updates from ManageEngine OpManager
ManageEngine OpManager Vendor Templates and NCM XML Import
ManageEngine OpManager introduces enhanced vendor template integration and device template import for the NCM module using XML files. This update helps teams improve device classification and speed up configuration workflows. For more information, visit ManageEngine OpManager’s official site.
 .
.
Icinga is a flexible network monitoring platform built for IT teams and system administrators who need deep visibility, real-time alerts, and customizable dashboards to keep complex infrastructures running smoothly.
Who Is Icinga Best For?
Icinga is a strong fit for mid-to-large IT teams and DevOps engineers who need a highly customizable, open-source monitoring solution for complex, distributed infrastructure environments.
Why I Picked Icinga
Icinga earns its spot on my shortlist because it's one of the few genuinely open-source network monitoring platforms that doesn't water down its feature set to push you toward a paid tier. I like that you can monitor hosts, services, and network devices using a fully customizable check system, and then route alerts through your own notification logic without being locked into a vendor's opinionated workflow. My team uses Icinga's Icinga Director module to manage large-scale configurations through a web UI, which makes handling hundreds of monitored objects far less painful than editing flat config files.
Icinga Key Features
- Dependency views: Visualize relationships between monitored objects to quickly trace the root cause of cascading failures across your infrastructure.
- Distributed monitoring with clustering: Deploy Icinga across multiple nodes with built-in high availability, so there's no single point of failure in your monitoring setup.
- Metrics and log collection: Collect performance data and logs alongside health checks, giving you time-series context for diagnosing issues rather than just pass/fail status.
- Schedule-aware incident routing: Define on-call schedules and event rules to control exactly who gets notified and when, reducing unnecessary alert noise.
Icinga Integrations
Integrations include VMware, Kubernetes, Windows Server, MySQL, PostgreSQL, Elasticsearch, Grafana, Slack, PagerDuty, and Jira.
Pros and Cons
Pros:
- Highly customizable for various IT infrastructure needs
- Scalable for both small and large environments
- Free to use with no setup fees
Cons:
- Setup and configuration comes with a learning curve
- Occasional performance issues reported during high-load scenario
New Product Updates from Icinga

Icinga Adds TOTP Two-Factor Authentication to Icinga Web
Icinga added time-based one-time password (TOTP) two-factor authentication to Icinga Web, helping organizations strengthen login security with an additional verification step. For more information, visit Icinga’s official site.
 .
.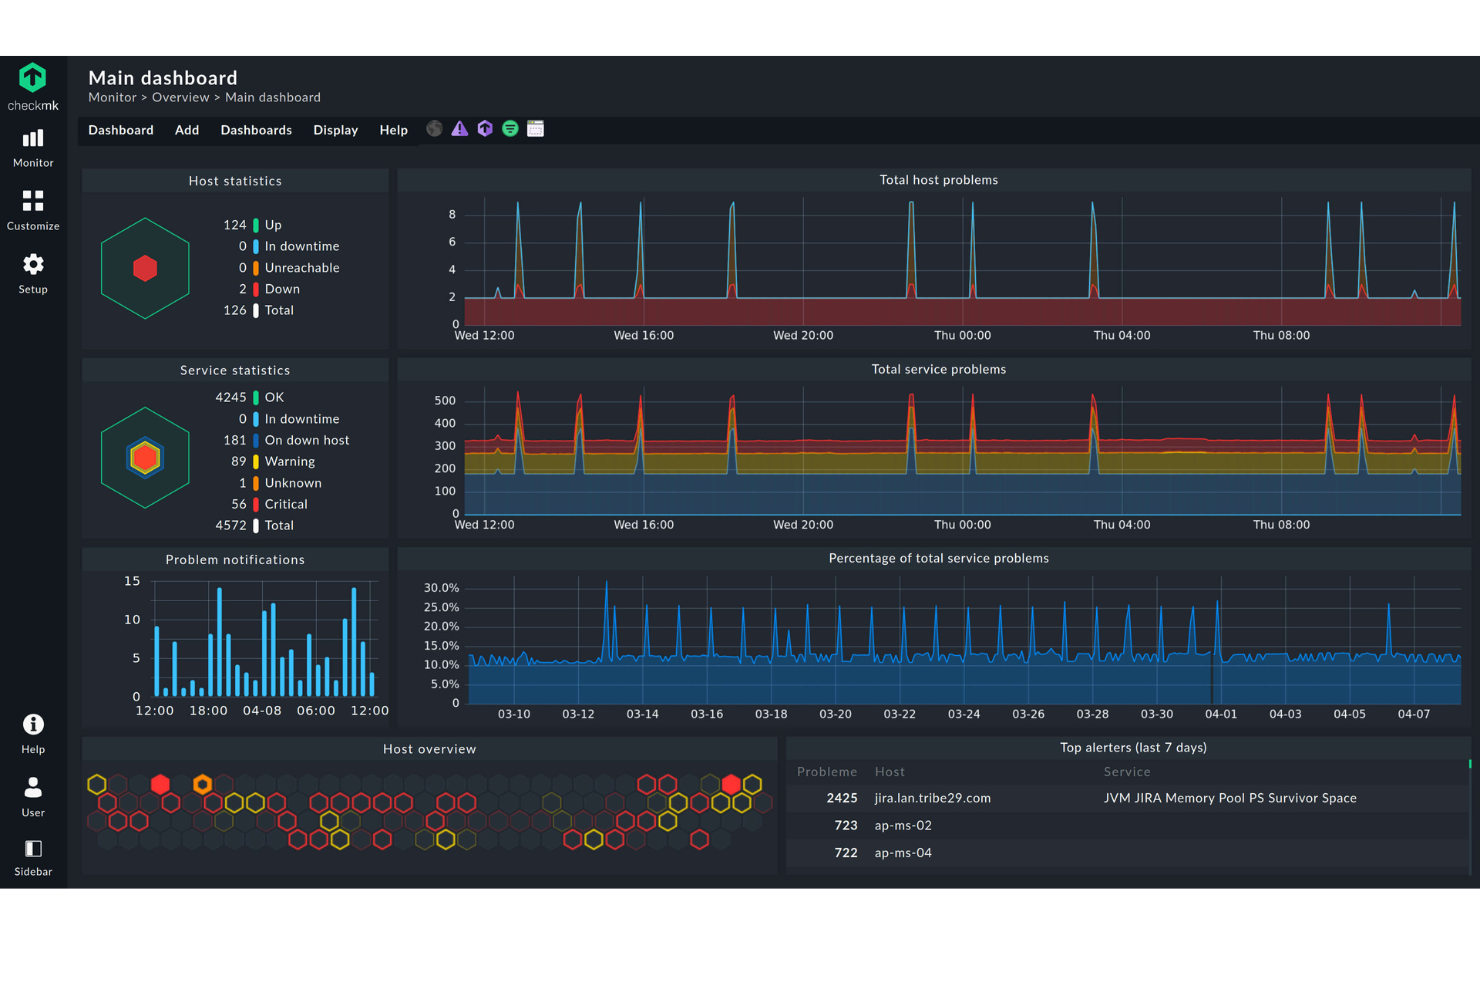
Checkmk is a network monitoring platform built for IT teams and managed service providers who need to monitor complex, distributed infrastructures and identify network issues across a wide range of devices and protocols.
Who Is Checkmk Best For?
Checkmk is a strong fit for mid-size to large IT teams and MSPs managing hybrid or multi-site infrastructures that have outgrown simpler monitoring tools.
Why I Picked Checkmk
Checkmk earns its spot on my shortlist because its distributed monitoring architecture genuinely scales in a way most tools can't match. I like that you can monitor hundreds of sites and millions of devices from a single platform without spinning up and syncing multiple monitoring instances. The auto-discovery feature is a standout—Checkmk automatically detects hosts and services, then recommends relevant metrics and thresholds, reducing setup time in large environments. The rule-based 1-to-N configuration lets my team apply a single rule across thousands of hosts, keeping configuration manageable as infrastructure grows.
Checkmk Key Features
- Real-time sampling: Checkmk collects monitoring data at measurement intervals as short as one minute, giving you up-to-date visibility into infrastructure health.
- Smart alerting: A rule-based notification system routes alerts to the right team—like storage admins for a failing disk—and escalates unresolved issues automatically.
- Log monitoring: Checkmk ingests events from syslog, SNMP traps, Windows event logs, and log files, then filters and collapses duplicate entries to reduce noise.
- Hardware and software inventory: Checkmk automatically identifies and tracks all hardware and software assets, and flags changes as they occur across your environment.
Checkmk Integrations
Integrations include AWS, Azure, Google Cloud Platform, VMware, Cisco, Dell, HPE, NetApp, Oracle, and Kubernetes.
Pros and Cons
Pros:
- Comprehensive monitoring capabilities
- Numerous automation options
- High configurability
Cons:
- Learning curve for new users
- Potential overhead for smaller networks

SuperOps is a cloud-based platform designed for managed service providers who need to monitor client networks, manage IT assets, and handle support tickets from a single dashboard.
Who Is SuperOps Best For?
SuperOps is a strong fit for small to mid-sized MSPs that need a single platform to manage network monitoring, ticketing, and client IT environments.
Why I Picked SuperOps
SuperOps earns its spot on my shortlist because it's one of the few platforms that genuinely combines network monitoring with a full PSA and RMM in a single interface. I like that network monitoring isn't bolted on as an afterthought—it's built into the RMM layer, so when a network alert fires, my team can jump into a ticket without switching tools. The platform supports real-time SNMP and ICMP monitoring across 250+ device manufacturers, and the visual topology maps give technicians full network context at a glance. Alert management uses AI to cut through noise, so my team focuses on issues that need attention rather than chasing false positives.
SuperOps Key Features
- Built-in SSH terminal: Access the terminal of any SSH-enabled network device directly within SuperOps to fix issues remotely without an on-site visit.
- Patch management: Schedule and automate OS and third-party software patches for Windows and Mac devices, with a custom patch approval matrix and automated deployment cycles.
- IT documentation: Store and access SOPs, WMI credentials, and troubleshooting steps securely alongside asset and network data in a single platform.
- Custom OID monitoring: Track granular, device-specific metrics using default monitors or custom OID monitoring to measure network health and performance over time.
SuperOps Integrations
Integrations include TeamViewer, Splashtop, ConnectWise Control, Xero, QuickBooks Online, Bitdefender, Webroot, Stripe, Microsoft Entra ID, and Pax8.
Pros and Cons
Pros:
- Offers native integrations with popular third-party software, enhancing functionality
- Easy to use with a simple setup process, reducing the learning curve for new users
- Unified platform that integrates network monitoring with RMM, streamlining IT operations
Cons:
- Limited information on customization options for specific MSP needs
- As a relatively new player, may lack some advanced features found in established competitors
New Product Updates from SuperOps

SuperOps Improves Ticket Visibility, Dynamic Forms, and Dashboard Views
SuperOps introduces improvements to ticket visibility, dynamic forms, and dashboard visualizations. These updates help technicians manage customer conversations, simplify ticket creation, and keep dashboard views consistent across teams. For more information, visit SuperOps' official site.
 .
.
Heimdal gives IT teams in businesses and enterprises a way to monitor network traffic, block threats, and secure endpoints with a focus on proactive threat detection and automated response.
Who Is Heimdal Best For?
Heimdal is a strong fit for mid-size to enterprise IT and security teams that need layered network protection across complex environments.
Why I Picked Heimdal
I picked Heimdal as one of the best because of how it approaches DNS security as a first line of defense rather than an afterthought. What I find genuinely impressive is Predictive DNS™—it uses machine learning and neural network modeling to predict and block malicious domains before they're even flagged by traditional threat intelligence feeds. In practice, my team can intercept threats at the DNS layer before any payload reaches an endpoint. I also like that the DNS Security Network module adds filtering directly to your local network infrastructure, so traffic doesn't need to reroute through external resolvers—a real advantage for hybrid and on-prem environments where latency and data sovereignty matter.
Heimdal Key Features
- Traffic logging tool: Logs all DNS traffic activity across your network so you can see exactly what devices are communicating with and flag suspicious behavior before it escalates.
- Host-Based Intrusion Prevention System (HIPS): Combines machine learning-based behavioral analysis with traffic filtering to detect and block intrusion attempts at the network level.
- Cloud Access Security Brokerage (CASB): Lets IT admins identify, classify, and block unsanctioned cloud apps accessing your environment, reducing shadow IT exposure.
- BYOD and IoT device coverage: Extends network protection to every device connected to your network—including personal devices and IoT equipment—without requiring endpoint agents.
Heimdal Integrations
Integrations include ConnectWise, Autotask, HaloPSA, Cisco Meraki, Microsoft 365, Microsoft Business, Blackpoint Cyber, Sophos, N-Able, and Patch My PC.
Pros and Cons
Pros:
- Detailed asset and license visibility
- Strong vulnerability and threat detection
- Automates patching across endpoints
Cons:
- Interface requires onboarding time
- No native integrations available

Site24x7 gives IT teams and managed service providers a unified platform to monitor network devices, servers, and cloud infrastructure, helping them detect outages, performance issues, and security threats across complex environments.
Who Is Site24x7 Best For?
Site24x7 is a good fit for mid-size to large IT teams managing mixed-vendor environments that span on-premises devices, cloud services, and remote infrastructure.
Why I Picked Site24x7
Site24x7 earns its spot on my shortlist because of how much ground it covers when it comes to device monitoring. I like that it supports over 450 device vendors using more than 15,000 device templates, which means my team can monitor routers, switches, firewalls, load balancers, and wireless controllers without needing separate tools for each vendor. Automated network discovery across IP ranges and CIDR blocks also reduces setup time—devices get detected and mapped without manual input. Support for NetFlow, sFlow, and J-Flow gives my team interface-level traffic visibility that is useful when tracking down congestion or unusual bandwidth patterns.
Site24x7 Key Features
- Network configuration management: Automate configuration backups, detect unauthorized changes, identify firmware vulnerabilities, and track compliance from a single console.
- SNMP trap processing: Receive instant alerts from network devices using SNMP traps to catch failures and abnormal behavior in real time.
- SDN and SD-WAN monitoring: Get end-to-end visibility into software-defined networks, including Cisco Meraki, Cisco ACI, and VMware VeloCloud SD-WAN environments.
- IP address management: Automatically discover and manage your entire IP space, track usage, prevent conflicts, and plan subnets with real-time insights.
Site24x7 Integrations
Integrations include ServiceNow, PagerDuty, Opsgenie, Jira, ManageEngine AlarmsOne, ConnectWise Manage, Zoho Desk, Zendesk, Slack, and Microsoft Teams.
Pros and Cons
Pros:
- Comprehensive monitoring capabilities
- Real-time alerts and notifications
- Customizable dashboards and reports
Cons:
- Complexity in initial setup for large environments
- Limited customization in alerting mechanisms
New Product Updates from Site24x7

Site24x7 Adds Discovery Issues for AWS Monitoring
Site24x7 added Discovery Issues for AWS monitoring, helping teams identify why resources are not being discovered across services and regions. The feature surfaces permission gaps, policy restrictions, and blocked API actions to support faster troubleshooting. For more information, visit Site24x7’s official site.
 .
.Other Network Monitoring Software Options
Here are some extra options you can pick from. Even though they did not make it to the best 12 list, they are still worth considering:
- Dynatrace
For network monitoring in complex environments
- Datadog
For small businesses
- Netdata
For real-time infrastructure monitoring
- Wireshark
For packet analysis
- Zabbix
Range of features
- LogicMonitor
For cloud-based network monitoring
- SysAid
For network monitoring and ITSM ticketing
- WhatsUp Gold
For comprehensive network monitoring
- New Relic
For advanced and power users
- Nagios XI
For enterprises
- Prometheus
Free network monitoring tool
- Munin Monitoring
Free option
- Zenoss
For hybrid IT infrastructure monitoring
- OPSWAT Security Score
For Windows security scans
- Syncro
For unlimited endpoint monitoring
- ManageEngine Applications Manager
For application monitoring
- Dotcom Monitor
For multi-step API & web testing
- Cisco Meraki
For security
- Spiceworks
For non-technical users
- NetCrunch
For hybrid IT infrastructure monitoring


Related Reviews
- Network Monitoring Software
- Server Monitoring Software
- SD-Wan Solutions
- Infrastructure Monitoring Tools
- Packet Sniffer
- Application Monitoring Tools
How I Evaluate Network Monitoring Software
I split my evaluation into two layers: baseline capabilities every tool must have—like SNMP discovery, real-time alerting, and flow analysis—and the differentiators that set the best options apart.
Core Functionality (Table Stakes for This List)
These core capabilities serve as the acceptance criteria for inclusion on my list of network monitoring software:
- Device & Network Discovery: I check whether a tool can auto-discover routers, switches, APs, and servers across subnets and map their Layer 2/3 relationships without hours of manual entry.
- Real-Time Performance Monitoring: Polling intervals, metric breadth, and sensor coverage matter here—I look for bandwidth, latency, CPU, memory, and interface tracking at useful intervals.
- Multi-Protocol Support: Tools that only handle SNMP and ICMP leave gaps. I evaluate whether a platform also supports NetFlow/sFlow/IPFIX, WMI, and syslog for full-stack visibility.
- Alerting & Notification Engine: I look at threshold configuration, escalation paths, and channel options—email, SMS, Slack, PagerDuty—plus whether alerts suppress downstream noise from dependencies.
- Topology Visualization & Dashboards: A live, interactive topology map that reflects real device states is what I look for, along with dashboards you can customize by role or site.
- Historical Reporting & Analytics: I evaluate data retention policies, report templates for SLA tracking, and whether trend data supports capacity planning decisions months out.
I rank each vendor on a scale from 0 (does not offer the functionality) to 5 (excels in this area) for each criterion.
Vendors need to achieve a minimum average score to be considered for inclusion on my list. From there, I consider what sets each platform apart.
Differentiating Factors (What Sets Vendors Apart)
Once I've curated my list, here's how I contrast and compare different vendors in the network monitoring software space:
Standout Features
AI-driven anomaly detection and deep packet inspection can be game changers for diagnosing complex performance issues that simple polling might miss. I also look for hybrid and cloud monitoring capabilities, especially when businesses run networks that span office, data center, and public cloud environments. Multi-tenant architecture stands out for MSPs or large enterprises needing clean client or site separation. Network configuration management becomes critical when frequent device changes demand easy versioning and quick rollbacks.
Beyond Features
Licensing structure matters a lot here—per-device vs. per-sensor pricing can drastically change your total cost as your network grows. I also evaluate integration depth with ITSM tools, since alert-to-ticket automation is where real operational time savings happen. Deployment flexibility is another factor I weigh; some teams need on-premise control for air-gapped networks, while others benefit from SaaS. Finally, I check for RBAC, SSO, and audit logging to confirm a platform fits regulated environments.
How to Choose Network Monitoring Software
It’s easy to get bogged down in long feature lists and complex pricing structures. To help you stay focused as you work through your unique software selection process, here’s a checklist of factors to keep in mind:
| Factor | What to Consider |
|---|---|
| Scalability | Can the software grow with your business? Consider future needs and whether the tool can handle increased data and devices without performance issues. |
| Integrations | Check compatibility with existing tools. Ensure seamless data flow between systems. Prioritize software that connects with your key platforms like CRM or ERP. |
| Customizability | Look for flexibility in dashboards and reports. Can you tailor the software to match your workflow? Avoid tools with rigid structures that don’t adapt to your needs. |
| Ease of use | Consider the learning curve for your team. Is the interface intuitive? Tools that require extensive training may slow down adoption and productivity. |
| Implementation and onboarding | Evaluate the setup process and resources needed. How long until you’re fully operational? Consider the availability of training materials and support during onboarding. |
| Cost | Compare pricing models. Are there hidden fees or extra costs for essential features? Ensure the plan fits your budget now and as you scale. |
| Security safeguards | Assess data protection measures. Does the software comply with industry standards? Look for encryption, access controls, and regular security updates to protect sensitive information. |
What Is Network Monitoring Software?
Network monitoring software is used by IT professionals and system administrators to track and manage the performance and availability of network components, often collaborating alongside WAN optimization vendors to ensure that systems run smoothly and efficiently.
Real-time alerts, bandwidth analysis, and device tracking features help with identifying issues, optimizing performance, and maintaining network health. Network mapping tools complement these monitoring capabilities by providing visual representations of network topology and device relationships. Overall, these tools provide essential insights that enhance network reliability and security.
Features
When selecting network monitoring software, keep an eye out for the following key features:
- Real-time network monitoring: This feature lets you see live data about network performance and device health. You can spot sudden outages or slowdowns and act fast, rather than being caught off guard.
- Customizable alerts: Create tailored notifications based on performance thresholds or specific incidents. These alerts help you respond to issues before they spiral into bigger problems.
- Comprehensive reporting: Get detailed reports summarizing network activity, performance trends, and device status. Use these insights to pinpoint trouble areas and show improvements to your team (or boss!).
- Device discovery and mapping: The software automatically scans and identifies devices connected to your network. This map makes it easy for you to keep track of new or unexpected devices and strengthens your network security.
- Bandwidth usage analysis: Monitor which devices or applications are using the most bandwidth. This helps you resolve congestion issues and enforce fair usage policies so everyone stays happy.
- Historical data retention: Review previous network performance metrics to spot recurring problems or long-term trends. With this data, you’re better equipped to plan upgrades and prevent repeat outages.
- Multi-vendor compatibility: Support for hardware and software from multiple vendors means you can monitor everything in your network, even if your devices come from different manufacturers.
- Remote monitoring capabilities: Access your network monitoring dashboard securely from anywhere. This way, you stay in control whether you're at your desk or working remotely.
- Automated troubleshooting tools: Leverage built-in diagnostics that recommend or even perform basic fixes. This saves you time and helps you resolve common issues without a manual deep dive.
Benefits
Implementing network monitoring software provides several benefits for your team and your business. Here are a few you can look forward to:
- Scalability: Automated network mapping and flexible features support growing businesses by adapting to increased demands. Significantly to an organization's strategic goals.
- Improved network reliability: Real-time alerts and predictive analytics help prevent downtime by addressing issues before they escalate.
- Enhanced security: Anomaly detection and device tracking identify potential threats and vulnerabilities, keeping your network secure.
- Optimized performance: Bandwidth analysis ensures efficient use of resources, leading to smoother network operations.
- Informed decision-making: Customizable dashboards provide insights tailored to your needs, aiding in strategic planning and management.
- Reduced operational costs: Proactive monitoring minimizes the need for emergency fixes and reduces the risk of costly outages.
- Better user experience: Synthetic monitoring ensures services are available and performing well, leading to satisfied users.
Costs & Pricing
Selecting network monitoring software requires an understanding of the various pricing models and plans available. Costs vary based on features, team size, add-ons, and more. The table below summarizes common plans, their average prices, and typical features included in network monitoring software solutions:
Plan Comparison Table for Network Monitoring Software
| Plan Type | Average Price | Common Features |
|---|---|---|
| Free Plan | $0 | Basic monitoring capabilities, limited alerts, and community support. |
| Personal Plan | $5-$25/user/month | Real-time alerts, customizable dashboards, and basic reporting. |
| Business Plan | $30-$75/user/month | Advanced analytics, enhanced security features, and integration options. |
| Enterprise Plan | $100-$250/user/month | Comprehensive monitoring, priority support, predictive analytics, and extensive customization options. |
Network Monitoring Software FAQs
You can find answers to common questions about network monitoring and network monitoring tools.
What does network monitoring software actually track?
How does network monitoring improve security?
Can it monitor both on-premise and cloud networks?
What are the benefits of automated alerts in network monitoring?
How often should network performance be reviewed?
What’s Next:
If you're in the process of researching network monitoring software, connect with a SoftwareSelect advisor for free recommendations.
You fill out a form and have a quick chat where they get into the specifics of your needs. Then you'll get a shortlist of software to review. They'll even support you through the entire buying process, including price negotiations.