12 Migliori Strumenti di Monitoraggio DevOps Recensiti per il 2026

10 Migliori strumenti di monitoraggio DevOps: la shortlist


Gestire una pipeline DevOps non è un compito facile. Tra il garantire la stabilità in produzione, monitorare i colli di bottiglia delle prestazioni e prevenire interruzioni, la pressione per mantenere tutto funzionante senza intoppi può sembrare opprimente. Forse ti sei trovato ad affrontare ritardi frustranti causati da problemi non rilevati o hai avuto difficoltà con strumenti che non si integrano perfettamente nei tuoi flussi di lavoro. La realtà è che, senza i giusti strumenti di monitoraggio DevOps, mantenere l'efficienza e offrire un'ottima esperienza utente diventa una vera sfida.
Gli strumenti di monitoraggio DevOps sono progettati per offrirti visibilità sui tuoi sistemi, aiutandoti a identificare e risolvere potenziali problemi prima che abbiano un impatto sugli utenti. Sono essenziali per mantenere operazioni fluide, ottimizzare le prestazioni e garantire che il tuo team possa concentrarsi sull'innovazione anziché sull'emergenza. Nel corso degli anni, ho lavorato con numerose soluzioni di monitoraggio in grandi progetti e team diversi. In questa guida condividerò le mie raccomandazioni principali e gli insight per aiutarti a scegliere lo strumento perfetto per ottimizzare i tuoi processi e mantenere i sistemi al massimo delle loro prestazioni.
Table of Contents
- Migliori Software Selezionati
- Perché Fidarsi di Noi
- Confronta le Specifiche
- Recensioni
- Altri Strumenti di Monitoraggio DevOps
- Recensioni Correlate
- Criteri di Selezione
- Come Scegliere
- Tendenze negli Strumenti di Monitoraggio DevOps
- Cosa Sono gli Strumenti di Monitoraggio DevOps?
- Funzionalità
- Vantaggi
- Costi e Prezzi
- Domande Frequenti
Perché Fidarti delle Nostre Recensioni Software
Testiamo e recensiamo software dal 2023. Come leader tecnologici, sappiamo quanto sia cruciale e difficile prendere la decisione giusta nella scelta di un software.
Investiamo in una ricerca approfondita per aiutare il nostro pubblico a effettuare scelte migliori di acquisto software. Abbiamo testato oltre 2.000 strumenti per diversi casi d’uso tecnologici e scritto più di 1.000 recensioni complete. Scopri come restiamo trasparenti e la nostra metodologia di recensione del software.
Sintesi dei migliori strumenti di monitoraggio DevOps
| Tool | Best For | Trial Info | Price | ||
|---|---|---|---|---|---|
| 1 | Ideale per il monitoraggio reale degli utenti | Prova gratuita di 30 giorni + demo gratuita disponibile | Da $10/mese (fatturato annualmente) | Website | |
| 2 | Ideale per il monitoraggio multi-cloud | Prova gratuita di 30 giorni + demo gratuita + piano gratuito disponibile | Da $199/anno | Website | |
| 3 | Ideale per approfondimenti in tempo reale sull'infrastruttura | Prova gratuita di 14 giorni + piano gratuito + demo gratuita disponibile | Da $4.50/node/mese (fatturato annualmente) | Website | |
| 4 | Ideale per il monitoraggio dei certificati SSL | Piano gratuito + demo gratuita disponibile | A partire da $8/10 monitoraggi/mese (fatturato annualmente) | Website | |
| 5 | Ideale per il monitoraggio di interruzioni e guasti dei server | Prova gratuita di 14 giorni | Da $21/utente/mese | Website | |
| 6 | Ideale per il monitoraggio continuo di grandi reti di porte | Prova gratuita di 30 giorni | A partire da $1.995/utente | Website | |
| 7 | Ideale per il monitoraggio delle prestazioni di siti web e mobile | Prova gratuita di 15 giorni | Da $6/core/mese | Website | |
| 8 | Ideale per l'osservabilità full-stack nelle soluzioni SaaS | Piano gratuito disponibile | A partire da 49$/utente/mese | Website | |
| 9 | Ideale per monitorare e cercare tra i big data | Prova gratuita di 60 giorni | Prezzo su richiesta | Website | |
| 10 | Ideale per avvisi e aggregazione delle metriche | Non applicabile | Gratuito | Website |
-

TestDevLab
Visit Website -
Site24x7
Visit WebsiteThis is an aggregated rating for this tool including ratings from Crozdesk users and ratings from other sites.4.7 -
GitHub Actions
Visit WebsiteThis is an aggregated rating for this tool including ratings from Crozdesk users and ratings from other sites.4.8


Recensioni dei migliori strumenti di monitoraggio DevOps
Qui trovi una panoramica dei principali strumenti di monitoraggio DevOps. Evidenzierò le funzionalità offerte da ciascun tool e perché meritano un posto in questa lista.

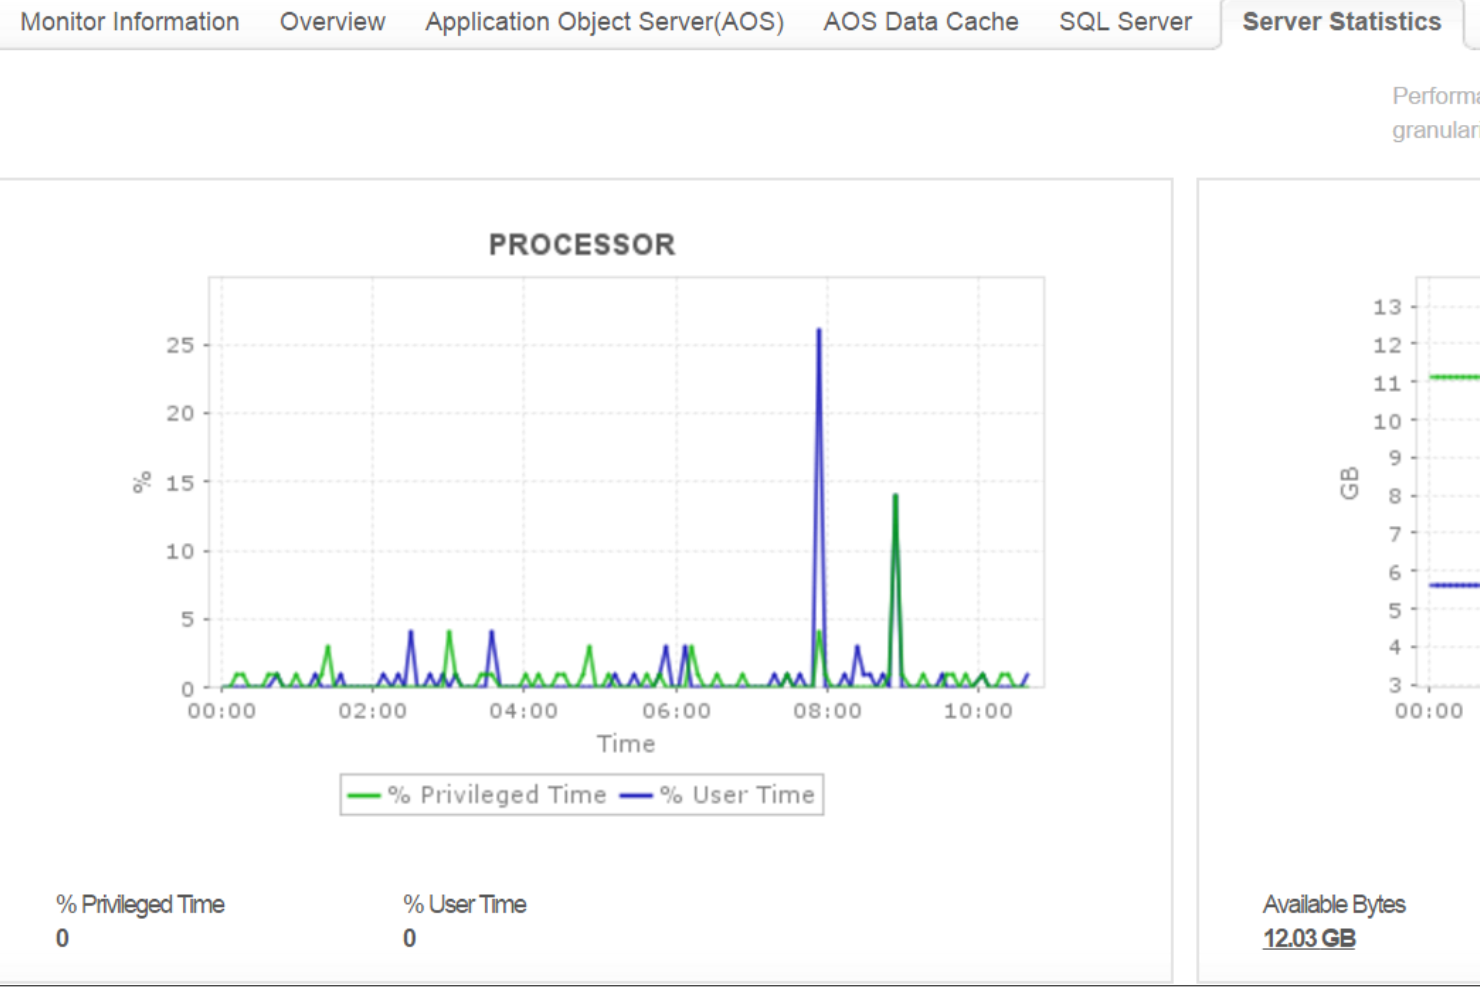
Site24x7 è una soluzione di monitoraggio basata su cloud pensata per i team DevOps e le operazioni IT. Offre capacità di monitoraggio complete per siti web, server, reti, applicazioni e servizi cloud. Con Site24x7, puoi ottenere informazioni in tempo reale sulle prestazioni e lo stato della tua infrastruttura IT.
Perché ho scelto Site24x7: Apprezzo la sua funzionalità di monitoraggio delle prestazioni delle applicazioni (APM). Questo strumento ti aiuta a identificare e risolvere problemi di prestazioni nelle tue applicazioni fornendo approfondimenti dettagliati sulle tracce delle transazioni, le query del database e i componenti applicativi. Un'altra funzione preziosa è il monitoraggio reale degli utenti (RUM). RUM ti permette di tracciare e analizzare le esperienze degli utenti reali sui tuoi siti web e applicazioni web. Comprendendo come gli utenti interagiscono con i tuoi servizi, puoi prendere decisioni informate per migliorare usabilità e prestazioni.
Caratteristiche e integrazioni principali di Site24x7
Le funzionalità includono il monitoraggio sintetico delle transazioni web, che ti consente di simulare le interazioni degli utenti per identificare eventuali problemi prima che possano influire sugli utenti reali. Inoltre, il monitoraggio della rete offre visibilità sullo stato dei dispositivi di rete, aiutandoti a mantenere l’affidabilità. La gestione dei log è un’altra funzione che permette di raccogliere e analizzare i log provenienti da varie fonti, facilitando una risoluzione efficiente dei problemi.
Le integrazioni includono ServiceNow, PagerDuty, Jira, Microsoft Teams, Slack, Nagios, AWS, Azure, Google Cloud Platform, Docker, Jenkins e Kubernetes.
Pros and Cons
Pros:
- Offre avvisi in tempo reale su vari canali
- Dashboard e report personalizzabili
- Monitoraggio completo per diversi sistemi
Cons:
- Un numero eccessivo di avvisi può risultare opprimente per gli utenti
- Configurazione iniziale complessa per ambienti di grandi dimensioni
New Product Updates from Site24x7

Site24x7 Adds Discovery Issues for AWS Monitoring
Site24x7 added Discovery Issues for AWS monitoring, helping teams identify why resources are not being discovered across services and regions. The feature surfaces permission gaps, policy restrictions, and blocked API actions to support faster troubleshooting. For more information, visit Site24x7’s official site.
 .
.Ideale per il monitoraggio multi-cloud
ManageEngine Applications Manager è uno strumento completo che offre il monitoraggio multi-cloud, permettendo agli utenti di monitorare, gestire, verificare e mettere in sicurezza le loro infrastrutture multi-cloud e ibride. Il suo punto di forza risiede nella capacità di fornire una soluzione unificata per il monitoraggio e la gestione di ambienti multi-cloud, rivelandosi la scelta migliore per le aziende che desiderano ottimizzare i propri sforzi di monitoraggio multi-cloud.
Perché ho scelto ManageEngine Applications Manager: ManageEngine Applications Manager si distingue offrendo funzioni robuste che facilitano il monitoraggio continuo, l'analisi delle prestazioni e la risoluzione dei problemi lungo l'intera pipeline DevOps. Supporta un approccio proattivo alla gestione degli incidenti, consente l'automazione dei controlli di routine e fornisce analisi dettagliate per migliorare le decisioni. La sua capacità di integrarsi senza difficoltà con vari strumenti di sviluppo, test e deployment lo rende una risorsa preziosa per i team DevOps che puntano all'alta efficienza e a tempi di inattività minimi.
Funzionalità e integrazioni di ManageEngine Applications Manager
Le funzionalità includono un ampio supporto nativo per il monitoraggio di oltre 100 applicazioni e server, spaziando da database, web server, application server e server virtuali, fino a piattaforme cloud, container e architetture a microservizi. Inoltre, ManageEngine Applications Manager integra funzionalità avanzate di analisi delle cause profonde alimentate da algoritmi di machine learning.
Le integrazioni includono Amazon Web Services (AWS), Microsoft Azure, Google Cloud Platform, Oracle Database, MySQL, Microsoft SQL Server, VMware, Docker, Apache Tomcat e Redis.
Pros and Cons
Pros:
- Monitoraggio completo di applicazioni, server e ambienti cloud
- Dashboard e report personalizzabili per analisi approfondite
- Rilevamento automatico delle anomalie e meccanismi di avviso
Cons:
- Può essere complesso da configurare e personalizzare per esigenze specifiche
- Il costo può essere proibitivo per piccole e medie imprese
New Product Updates from ManageEngine Applications Manager
Oracle Cloud Application Monitoring Now Available in ManageEngine Applications Manager
ManageEngine Applications Manager introduces Oracle Cloud Application Monitoring, Oracle Cloud Function Monitoring, and Oracle Cloud NAT Gateway Monitoring. These new capabilities help teams monitor Oracle Cloud applications, serverless workloads, and network resources from a single platform. For more information, visit ManageEngine Applications Manager's official site.
 .
.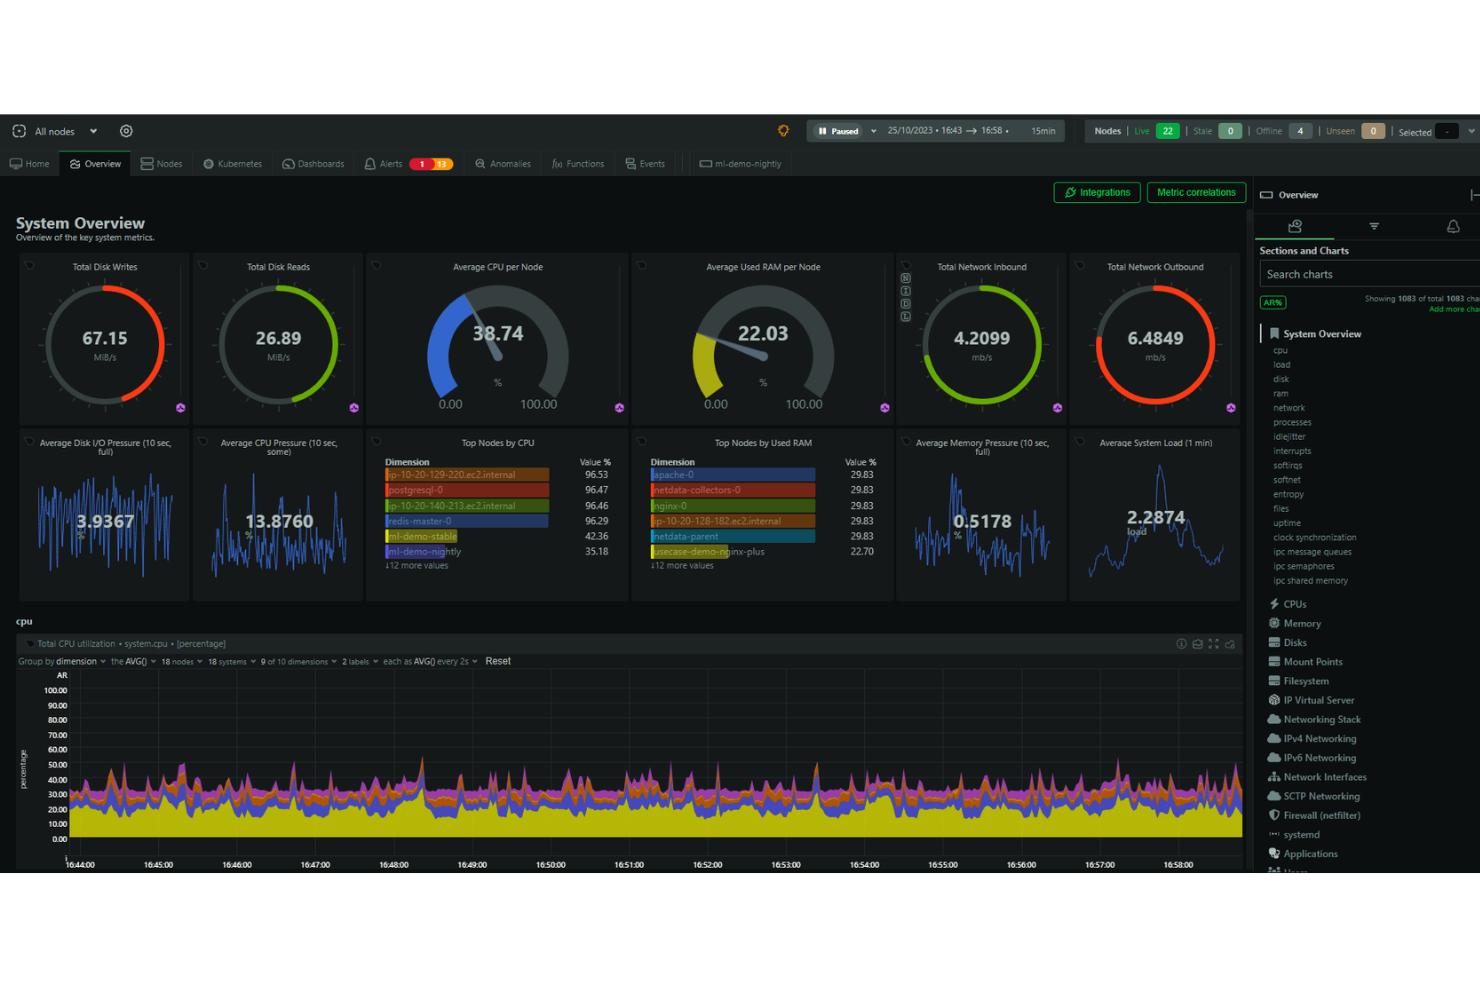
Netdata è una piattaforma open-source per il monitoraggio e la risoluzione dei problemi che offre metriche ad alta risoluzione, log di sistema e visualizzazioni in tempo reale per il monitoraggio dei sistemi. Si propone come un'alternativa economica e facile da usare rispetto a piattaforme più costose e complesse.
Perché ho scelto Netdata: Mi piace che la piattaforma dia importanza ai dati di alta fedeltà e offra visualizzazioni in tempo reale, permettendo agli utenti di monitorare le prestazioni e lo stato del sistema con precisione. Inoltre, semplifica e migliora il processo di monitoraggio per i team DevOps con funzionalità per la raccolta, l'archiviazione, l'interrogazione, la visualizzazione e le notifiche su un'ampia gamma di metriche. Netdata può essere eseguito su più nodi e ogni istanza di Netdata è in grado di funzionare autonomamente.
Caratteristiche e integrazioni distintive di Netdata
Le funzionalità includono avvisi per notificare gli utenti in caso di problemi rilevati all'interno del sistema, rilevamento automatico delle anomalie e dashboard automatizzati e personalizzabili. Inoltre, il nucleo dell'ecosistema Netdata è open-source e include tutte le funzioni di monitoraggio come il database, il motore di interrogazione, il motore di scoring, il motore di salute e il motore di apprendimento automatico.
Le integrazioni includono Containers, Kubernetes Containers, Macchine Virtuali, Apache, Consul, Elasticsearch, OpenSearch, MySQL, Redis, file di log Squid, Windows, macOS e centinaia di altri ancora.
Pros and Cons
Pros:
- Notifiche automatiche
- Monitoraggio illimitato delle metriche
- Grafici interattivi per la visualizzazione dei dati
Cons:
- Potrebbe avere una curva di apprendimento per sfruttarne al massimo le funzioni
- Gli approfondimenti potrebbero essere più completi
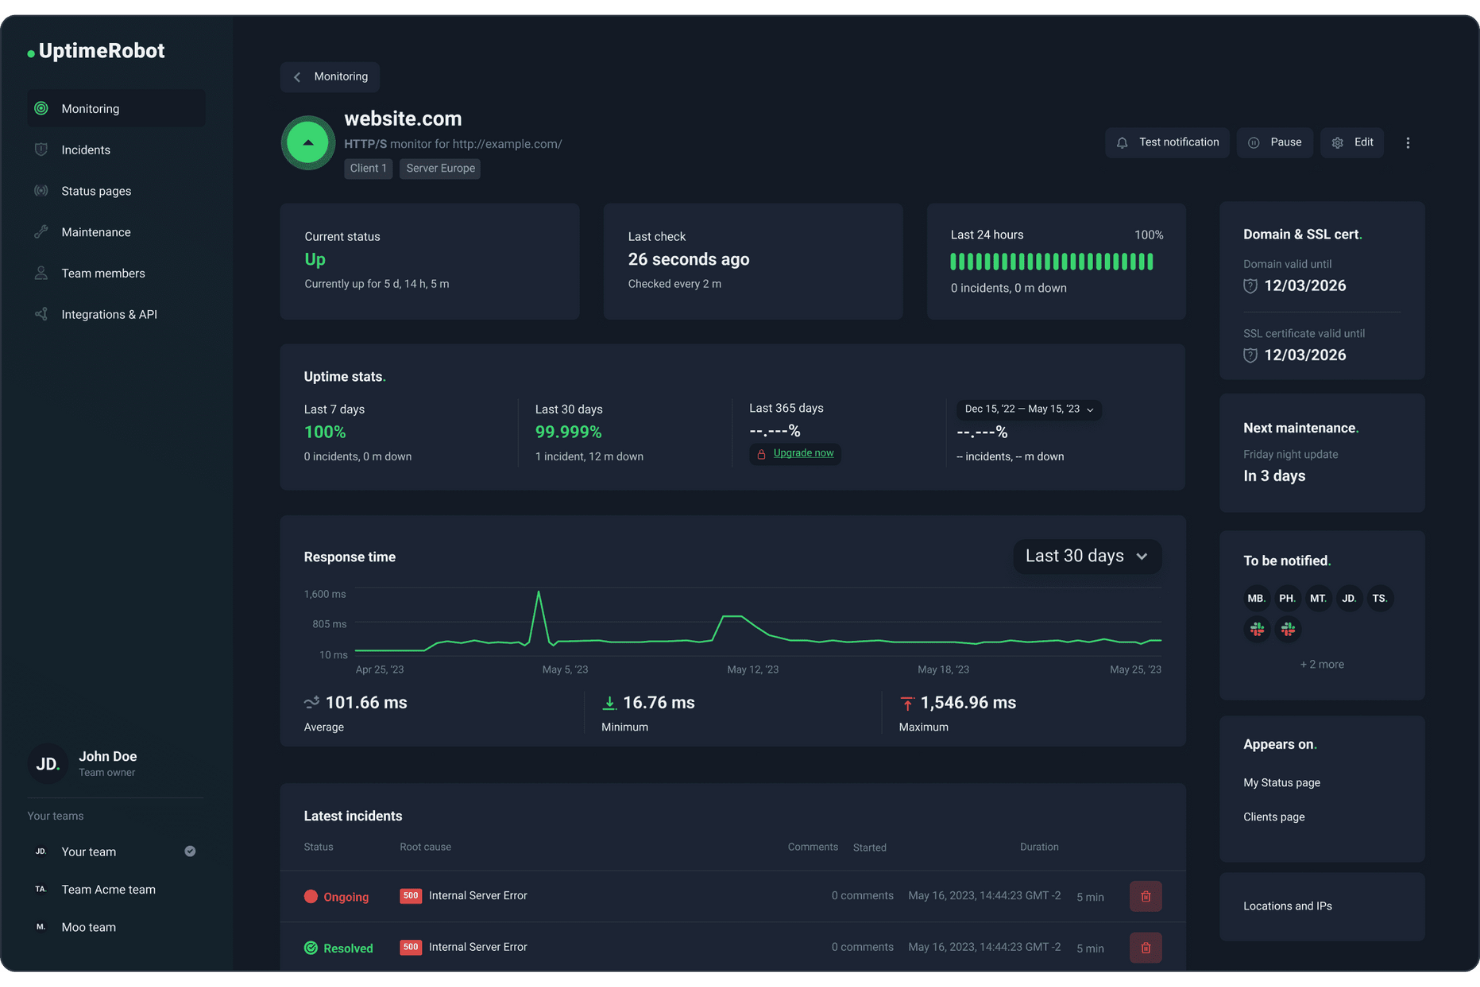
Per i team DevOps che cercano una soluzione di monitoraggio affidabile, UptimeRobot offre un'opzione pratica che supporta il monitoraggio dei certificati SSL insieme ai controlli di uptime. È adatto a team di tutte le dimensioni, dai singoli operatori alle organizzazioni più grandi, che necessitano di visibilità sulla disponibilità dei servizi e sulle prestazioni degli endpoint. Aiutando i team a rilevare problemi come scadenza dei certificati, tempi di inattività e rallentamenti nelle risposte, UptimeRobot supporta operazioni stabili e un'erogazione costante dei servizi.
Perché ho scelto UptimeRobot
Ho scelto UptimeRobot per il suo monitoraggio dei certificati SSL, che aiuta i team DevOps a evitare problemi causati da certificati scaduti o configurati in modo errato. Tiene traccia dello stato dei certificati e invia avvisi prima che scadano, riducendo il rischio di avvisi di accesso o interruzioni del servizio. UptimeRobot fornisce anche avvisi di inattività attraverso integrazioni come Slack e PagerDuty, rendendo più facile per i team rispondere rapidamente e mantenere servizi affidabili.
Funzionalità principali di UptimeRobot
Oltre al monitoraggio dei certificati SSL, UptimeRobot offre:
- Controlli da più località: Monitora i tuoi servizi da più località nel mondo per garantire l'accessibilità globale.
- Monitoraggio dei tempi di risposta: Tieni traccia della rapidità con cui il tuo server risponde per ottenere informazioni sui colli di bottiglia delle prestazioni.
- Pagine di stato personalizzabili: Condividi aggiornamenti sullo stato in tempo reale con gli utenti tramite pagine di stato personalizzate con il tuo marchio.
- Gestione degli incidenti: Gestisci e risolvi gli incidenti in modo efficiente grazie ad avvisi personalizzabili e livelli di accesso per il team.
Integrazioni di UptimeRobot
Le integrazioni includono Slack, PagerDuty, Microsoft Teams, Telegram, Discord, Splunk On-Call e altre ancora, permettendo una gestione degli avvisi senza interruzioni sulle piattaforme di comunicazione preferite.
Pros and Cons
Pros:
- Avvisi in tempo reale assicurano una risposta rapida ai problemi di downtime
- Il monitoraggio SSL aiuta a mantenere efficacemente la sicurezza del sito web
- Supporta più canali di avviso
Cons:
- Personalizzazione limitata delle impostazioni di notifica rispetto ai concorrenti
- Non adatto a stack DevOps complessi
Ideale per il monitoraggio di interruzioni e guasti dei server
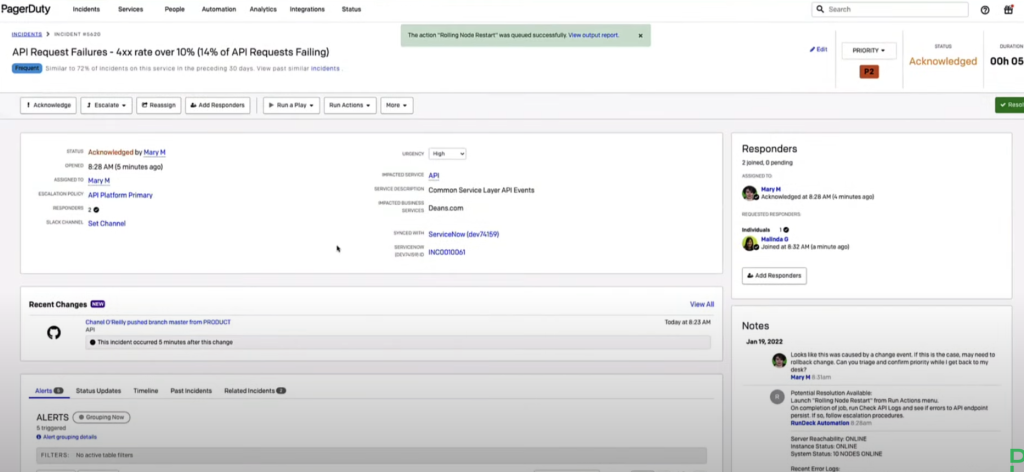
PagerDuty è una piattaforma di risposta agli incidenti che invia avvisi in caso di interruzioni o malfunzionamenti dei servizi. Nei momenti critici, può inviare notifiche tramite email, SMS e telefonate al tuo team di sviluppo o alla base clienti.
Perché ho scelto PagerDuty: Ho scelto PagerDuty perché è uno strumento eccellente se gestisci infrastrutture critiche che vuoi monitorare costantemente. La piattaforma consente di ricevere notifiche di allerta on-call in tempo reale.
Funzionalità e integrazioni distintive di PagerDuty:
Le funzionalità che mi hanno colpito di più sono completamente dedicate ad avvisare i team nel caso in cui sistemi, nodi o servizi applicativi vadano in errore e includono avvisi email, notifiche mobili, analisi della causa principale, notifiche in tempo reale e prioritizzazione. Puoi anche programmare ed escalationare automaticamente i problemi.
Le integrazioni includono plugin preconfigurati per AWS, ServiceNow, Salesforce, Zendesk, Atlassian, Datadog, Slack, Splunk e altri ancora.
Pros and Cons
Pros:
- Consente di assegnare la gestione degli incidenti alla persona o al team più appropriato
- Gli avvisi personalizzabili possono essere inviati via email, telefono, SMS o notifiche push
- Filtra le notifiche per dare priorità agli avvisi di maggior rilievo che indicano reali minacce, riducendo al contempo i falsi allarmi
Cons:
- Cercare avvisi storici può essere difficile a meno di disporre dell'ID esatto
- Utilizza una dashboard convenzionale che potrebbe essere più personalizzabile in base a esigenze e preferenze specifiche
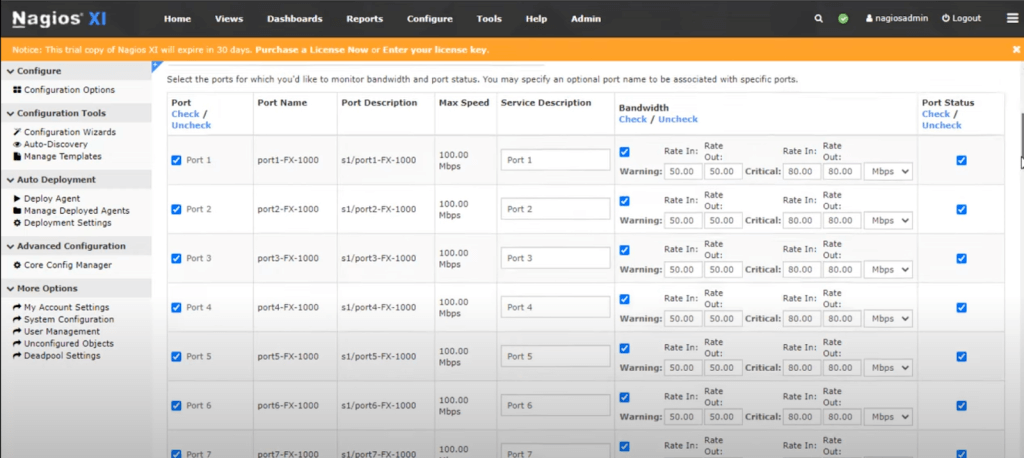
Nagios è un'applicazione software open-source che monitora costantemente le reti di traffico. Può tracciare l'utilizzo della larghezza di banda per porta per il traffico in entrata e in uscita, rilevare interruzioni di rete, identificare porte sovraccariche e scoprire abusi nella rete.
Perché ho scelto Nagios: Invece di esporre i miei sistemi a vulnerabilità o preoccuparmi delle prestazioni lente della rete, Nagios fornisce al mio team DevOps una visibilità immediata della nostra rete. Inoltre, mi è piaciuto che registri informazioni come problemi di infrastruttura di rete e processi falliti per porta.
Caratteristiche principali e integrazioni di Nagios
Le funzionalità offerte da Nagios garantiscono la sicurezza delle porte di rete. Queste includono monitoraggio SNMP, monitoraggio di switch e router, monitoraggio di rete e monitoraggio ping, che mi aiutano a mantenere l'integrità e la sicurezza della mia infrastruttura di rete.
Le integrazioni pre-integrate includono Amazon SNS, Prometheus, PagerDuty, Dynatrace e altro ancora. Inoltre, Nagios dispone di oltre 3.000 plugin ufficiali e della community che gli sviluppatori possono aggiungere allo stack.
Pros and Cons
Pros:
- La versione open source è completamente gratuita
- Leggero per un utilizzo minimo delle risorse
- Aumenta la disponibilità dell'intera infrastruttura di rete per i guasti di protocollo e le interruzioni di rete
Cons:
- Sono necessarie licenze separate per le funzionalità di sicurezza e di visibilità della rete
- Utilizza file invece di database per memorizzare i file di configurazione nel backend
Ideale per il monitoraggio delle prestazioni di siti web e mobile
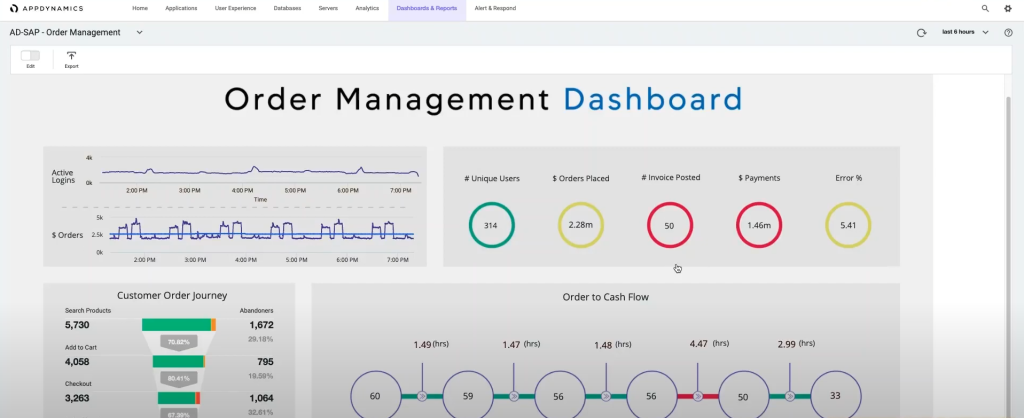
AppDynamics è uno strumento di gestione delle prestazioni delle applicazioni completo. Utilizza algoritmi di apprendimento automatico per individuare i problemi di prestazione, confrontarli con metriche di riferimento e generare avvisi quando necessario.
Perché ho scelto AppDynamics: Ho scelto AppDynamics perché si concentra sulle prestazioni delle applicazioni utilizzando il monitoraggio per garantire un'esperienza utente ottimale. Che tu stia gestendo un sito web o un'app mobile, AppDynamics assicura che i tuoi clienti non incontrino problemi come timeout o tempi di caricamento lenti delle pagine.
Caratteristiche e integrazioni distintive di AppDynamics:
Funzionalità che ho trovato eccellenti in AppDynamics per il monitoraggio delle prestazioni includono il monitoraggio delle prestazioni delle applicazioni (APM) e la visibilità dell'infrastruttura con visibilità sui database. Inoltre, il monitoraggio degli utenti finali ha attirato la mia attenzione poiché garantisce la massima velocità possibile delle applicazioni per i tuoi clienti.
Integrazioni con cui AppDynamics collabora includono plugin preconfigurati come LoadRunner, Sainapse e NeoLoad per le prestazioni e la consegna continua. AppDynamics collabora anche con SquaredUp, Medallia e Quantum Metric per monitorare l'esperienza del cliente.
Pros and Cons
Pros:
- Fornisce informazioni in tempo reale sui processi che consumano CPU e memoria
- Profondità nel monitoraggio di applicazioni web e infrastruttura notevole
- La visibilità della rete permette di vedere la quantità di banda utilizzata per nodo
Cons:
- La funzionalità può risultare eccessiva per le piccole aziende
- Nessuna scansione automatica delle applicazioni; devono essere definite in un file di configurazione
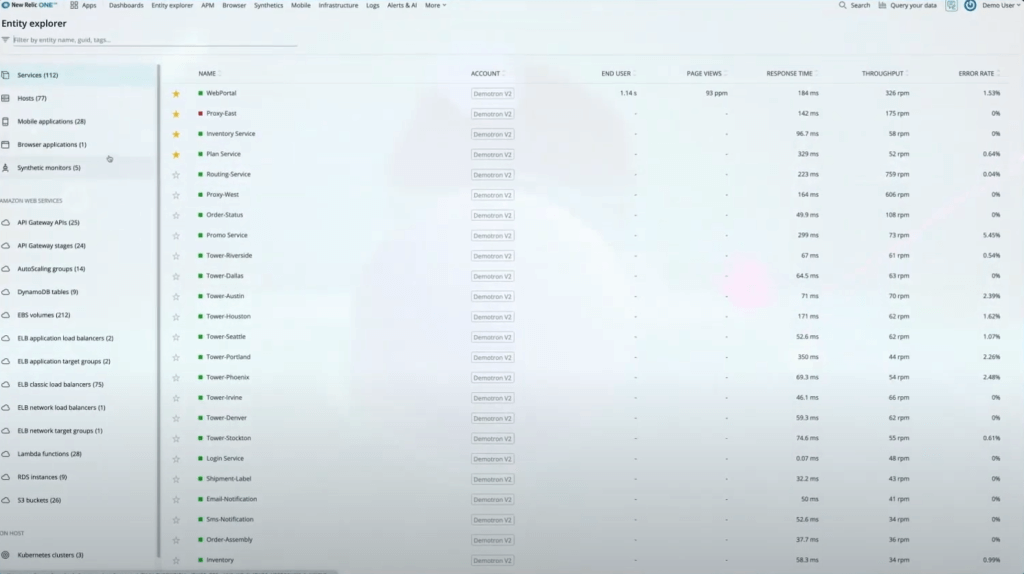
New Relic è uno strumento di monitoraggio e analisi web che osserva in tempo reale ogni componente applicativo distribuito su database e server.
Perché ho scelto New Relic: Ho scelto New Relic perché offre una soluzione 'tutto in uno' che monitora e analizza ogni aspetto dello stack tecnologico. Avere una visibilità completa end-to-end permette ai team di ottenere informazioni utili quando si verificano problemi e di affrontarli e risolverli con tempestività.
Caratteristiche principali e integrazioni di New Relic:
Funzionalità che rendono New Relic ideale per il monitoraggio full-stack includono il monitoraggio delle applicazioni e dei database. Inoltre, è disponibile il monitoraggio della disponibilità per assicurarsi che i sistemi funzionino in luoghi pubblici o privati 24 ore su 24.
Integrazioni disponibili con plugin preconfigurati come AWS, Kubernetes, Azure, Google Cloud Platform e Prometheus. È anche possibile utilizzare integrazioni native come SQL Server per inviare query a New Relic.
Pros and Cons
Pros:
- Estremamente ricco di funzionalità e consente di scrivere query personalizzate sui dati raccolti dai sistemi di strumentazione
- Offre informazioni su metriche e prestazioni anche sotto carichi e stress elevati
- Installazione semplice dell'agente che consente di visualizzare i dati sulla dashboard in pochi minuti
Cons:
- Il costo può essere considerato elevato, soprattutto per startup e anche per aziende di medie dimensioni
- L'interfaccia può risultare un po' complessa a causa dell'elevato numero di opzioni visualizzate

Splunk è uno strumento software che acquisisce e indicizza i dati, organizzandoli in un archivio ricercabile. Consente la generazione di avvisi, report e visualizzazioni da grandi insiemi di dati.
Perché ho scelto Splunk: Ho scelto Splunk per la sua capacità di scalare e gestire grandi volumi di dati. Con la crescente complessità delle applicazioni moderne e dei sistemi distribuiti, la scalabilità di Splunk garantisce una gestione e un'analisi efficaci dei log provenienti da molteplici fonti senza compromettere le prestazioni.
Caratteristiche principali e integrazioni di Splunk:
Le funzionalità di Splunk sono progettate per offrire ai team una maggiore visibilità sulle loro applicazioni. Ritengo che le sue capacità di indicizzazione e raccolta dati, gestione dei carichi di lavoro, toolkit di apprendimento automatico e strumenti intuitivi di esplorazione dei dati lo rendano uno strumento eccellente per i team.
Le integrazioni sono disponibili tramite plugin predefiniti per Docker, Jenkins, Kubernetes, Ansible, AWS, Azure e ServiceNow. Inoltre, Splunk fornisce informazioni sulle funzionalità di ciascuna integrazione, permettendoti di vedere se le tue integrazioni possono fornirti tracce, log, metriche o metadati con Splunk.
Pros and Cons
Pros:
- Salva le tue ricerche e riconosce automaticamente i dati importanti
- Altamente scalabile e facile da implementare
- Crea report analitici e visualizza i dati con grafici, tabelle e diagrammi
Cons:
- Può essere costoso, specialmente se i tuoi servizi richiedono risorse intensive
- Ottimizzare le ricerche per la velocità può essere difficile
- Visita il sito web (si apre in una nuova finestra)

Prometheus è uno strumento open source per il monitoraggio dei sistemi e la gestione degli avvisi che consente di raccogliere e archiviare metriche. Ti aiuta a monitorare dati critici in serie temporali, come il consumo di memoria, l'utilizzo delle risorse, i tassi di errore e le richieste in arrivo.
Perché ho scelto Prometheus: Ho scelto Prometheus per la sua eccellenza nella raccolta, archiviazione e interrogazione delle metriche dagli endpoint HTTP. Permette di esporre, raccogliere e interrogare facilmente i dati per sapere se la tua infrastruttura o i tuoi servizi stanno funzionando correttamente o meno.
Caratteristiche salienti e integrazioni di Prometheus
Le caratteristiche che rendono Prometheus uno dei migliori strumenti sul mercato sono i suoi avvisi e l'aggregazione dei dati. Posso beneficiare del monitoraggio dei log, del controllo degli avvisi, della raccolta di serie temporali e dell'archiviazione e osservazione delle metriche.
Le integrazioni includono principalmente piattaforme remote preconfigurate per endpoint e storage, come Elasticsearch, InfluxDB e Kafka. È anche possibile integrare webhook di Alertmanager per notifiche su applicazioni come Discord, GitLab e Zoom.
Pros and Cons
Pros:
- Utilizza metriche pull per analizzare i dati senza installare programmi aggiuntivi sui tuoi container
- Schemi di metriche intuitivi per un'interrogazione dati semplice
- Avvisi personalizzabili
Cons:
- La documentazione può essere poco chiara o confusa a volte
- Potrebbe essere necessario imparare PromQL per interrogare le metriche.
Altri strumenti di monitoraggio DevOps
Ecco alcuni altri strumenti che non sono arrivati nella top 12 ma valgono comunque la pena di essere valutati:
- Grafana Cloud
Ideale per il monitoraggio, l'analisi e la visualizzazione dei dati
- Buddy
Ideale per il monitoraggio di siti web e app mobili per piccole imprese
- InfluxDB
Ideale per il monitoraggio di dati in serie temporale in un unico database polivalente
- Sensu
Ideale per il monitoraggio di ambienti cloud
- ChaosSearch
Ideale per centralizzare dati di log ed eventi nel cloud
- Dynatrace
Ideale per il monitoraggio delle prestazioni end-to-end per grandi aziende
- Dotcom Monitor
Ideale per monitorare i flussi di lavoro critici


Recensioni correlate di software e strumenti
Se qui non hai ancora trovato ciò che cerchi, dai un'occhiata anche a queste altre tipologie di strumenti che abbiamo testato e valutato.
- Software di monitoraggio della rete
- Software di monitoraggio dei server
- Soluzioni SD-Wan
- Strumenti di monitoraggio dell'infrastruttura
- Packet Sniffer
- Strumenti di monitoraggio delle applicazioni
Criteri di selezione degli strumenti di monitoraggio DevOps
Nella scelta dei migliori strumenti di monitoraggio DevOps da includere in questo elenco, ho considerato le esigenze più comuni degli acquirenti e le criticità, come la gestione di infrastrutture complesse e la necessità di rilevare i problemi in tempo reale. Ho inoltre utilizzato il seguente quadro di valutazione per mantenere l'analisi strutturata ed equa:
Funzionalità principali (25% del punteggio totale)
Per essere inclusa nella lista, ogni soluzione doveva soddisfare questi casi d'uso comuni:
- Monitoraggio delle prestazioni del sistema
- Rilevamento e segnalazione di problemi
- Fornire dati in tempo reale
- Monitoraggio dello stato delle applicazioni
- Supporto all'integrazione con altri strumenti
Funzionalità speciali aggiuntive (25% del punteggio totale)
Per aiutare a restringere ulteriormente la selezione, ho anche cercato funzionalità uniche come:
- Analisi basate su intelligenza artificiale
- Dashboard personalizzabili
- Capacità di manutenzione predittiva
- Compatibilità multipiattaforma
- Funzionalità avanzate di sicurezza
Usabilità (10% del punteggio totale)
Per valutare l'usabilità di ciascun sistema, ho preso in considerazione i seguenti aspetti:
- Interfaccia utente intuitiva
- Facilità di navigazione
- Opzioni di personalizzazione
- Velocità delle prestazioni
- Curva di apprendimento minima
Onboarding (10% del punteggio totale)
Per valutare l'esperienza di onboarding di ciascuna piattaforma, ho considerato i seguenti punti:
- Disponibilità di video formativi
- Tour interattivi del prodotto
- Documentazione completa
- Accesso a webinar
- Forum della community di supporto
Assistenza clienti (10% del punteggio totale)
Per valutare i servizi di assistenza clienti di ciascun fornitore di software, ho considerato quanto segue:
- Disponibilità di supporto 24/7
- Reattività alle richieste
- Qualità della documentazione di supporto
- Accesso alla chat dal vivo
- Disponibilità di account manager dedicati
Rapporto qualità-prezzo (10% del punteggio totale)
Per valutare il rapporto qualità-prezzo di ciascuna piattaforma, ho considerato quanto segue:
- Prezzi competitivi
- Flessibilità nei piani tariffari
- Funzionalità offerte per ogni fascia di prezzo
- Sconti per impegni annuali
- Disponibilità di periodi di prova
Recensioni dei clienti (10% del punteggio totale)
Per avere una panoramica sulla soddisfazione generale dei clienti, ho tenuto conto dei seguenti aspetti durante la lettura delle recensioni:
- Valutazioni complessive di soddisfazione
- Principali vantaggi e svantaggi menzionati
- Feedback sull'efficacia delle funzionalità
- Esperienze sulla qualità del supporto
- Raccomandazioni di miglioramento
Come scegliere gli strumenti di monitoraggio DevOps
È facile perdersi tra lunghe liste di funzionalità e strutture di prezzo complesse. Per aiutarti a rimanere concentrato durante il processo di selezione del software più adatto alle tue esigenze, ecco un elenco di fattori da tenere a mente:
| Fattore | Cosa considerare |
|---|---|
| Scalabilità | Assicurati che lo strumento sia in grado di gestire carichi di lavoro crescenti e un numero maggiore di utenti senza perdere in prestazioni. Le soluzioni cloud con auto-scaling aiutano a gestire la crescita. |
| Integrazioni | Verifica che lo strumento si integri con il tuo stack DevOps esistente, inclusi pipeline CI/CD, servizi cloud e piattaforme di gestione degli incidenti. |
| Personalizzazione | Cerca la possibilità di regolare le impostazioni di monitoraggio, le soglie degli avvisi e i dashboard per adattarli ai flussi di lavoro e alle priorità del tuo team. |
| Facilità d'uso | Lo strumento dovrebbe offrire un'interfaccia chiara e controlli intuitivi, in modo che il tuo team possa individuare rapidamente i problemi e intervenire. Configurazioni complicate possono rallentare i tempi di risposta. |
| Budget | Confronta i costi di abbonamento, le licenze e i costi extra per funzionalità avanzate o limiti di dati maggiori. Fai attenzione ai costi nascosti. |
| Sicurezza | Cerca la presenza di crittografia, controlli di accesso e trasmissione sicura dei dati per proteggere le informazioni sensibili e prevenire violazioni. |
| Avvisi in tempo reale | Lo strumento dovrebbe fornire avvisi istantanei su problemi di prestazioni o interruzioni, permettendo al team di agire rapidamente e ridurre i tempi di inattività. |
| Conservazione dei dati e reportistica | Assicurati che lo strumento conservi dati storici abbastanza a lungo da consentire analisi e identificazione di tendenze significative. I report esportabili sono utili per le revisioni di team. |
Tendenze negli strumenti di monitoraggio DevOps
Nella mia ricerca, ho consultato numerosi aggiornamenti di prodotto, comunicati stampa e log delle release di vari fornitori di strumenti di monitoraggio DevOps. Ecco alcune delle tendenze emergenti che sto monitorando:
Rilevamento avanzato delle anomalie: I nuovi modelli di machine learning stanno migliorando il rilevamento delle anomalie, aiutando i team a individuare schemi irregolari in tempo reale e a ridurre i falsi positivi.
Osservabilità full-stack: I fornitori si stanno spingendo oltre il monitoraggio di base per offrire una visione completa di infrastruttura, applicazioni ed esperienza utente in un unico luogo. Questo rende più semplice individuare e risolvere i problemi. Quando valuti le piattaforme di osservabilità, cerca soluzioni che offrano funzionalità di monitoraggio complete.
Approfondimenti guidati dall’IA: Sempre più strumenti utilizzano l’intelligenza artificiale per analizzare i dati e prevedere i problemi di prestazioni prima che si verifichino. Questo aiuta i team ad agire in modo proattivo invece di reagire ai guasti.
Tracciamento distribuito: Gli strumenti stanno aggiungendo funzionalità di tracciamento che permettono ai team di monitorare le richieste tra microservizi e container. Questo aiuta a individuare dove si verificano ritardi o errori.
Sistemi auto-riparanti: Alcuni strumenti ora offrono il rimedio automatico, in cui il sistema può rilevare un problema e risolverlo senza intervento umano. Questo riduce i tempi di inattività e i tempi di risposta.
Cosa Sono gli Strumenti di Monitoraggio DevOps?
Gli strumenti di monitoraggio DevOps sono soluzioni software specializzate progettate per tracciare e analizzare in tempo reale le prestazioni e lo stato di salute di applicazioni e infrastruttura. Questi strumenti sono utilizzati principalmente da ingegneri DevOps, amministratori di sistema e professionisti IT per garantire il funzionamento senza intoppi e la distribuzione dei prodotti software.
Gli strumenti di monitoraggio DevOps aiutano ad automatizzare il processo di monitoraggio, fornire approfondimenti sulle prestazioni del sistema e identificare e risolvere rapidamente i problemi prima che impattino sull’ambiente di produzione. Funzionalità come gli avvisi in tempo reale, strumenti di osservabilità dei dati e analisi predittiva supportano tutte un approccio proattivo nella risoluzione dei problemi e migliorano l’efficienza operativa.
Caratteristiche
Ecco alcune delle caratteristiche più importanti che cerco negli strumenti di monitoraggio DevOps durante la valutazione per la mia lista:
- Avvisi e notifiche in tempo reale: Questa funzione garantisce la consapevolezza immediata dei problemi non appena si presentano. È essenziale per mitigare rapidamente i problemi, evitando che piccoli inconvenienti si trasformino in gravi interruzioni.
- Cruscotti completi: I cruscotti offrono una visione unificata di tutte le metriche e i log. Sono fondamentali per visualizzare lo stato della pipeline di sviluppo e lo stato di salute delle applicazioni, rendendo più semplice identificare tendenze e potenziali problemi.
- Metriche personalizzabili: Opzioni di personalizzazione per monitorare metriche specifiche. Adattare le metriche alle proprie esigenze consente un monitoraggio più mirato, garantendo che i team possano tenere traccia degli indicatori di prestazione più rilevanti per i loro progetti.
- Gestione e analisi dei log: Gestione efficace dei log e capacità analitiche. Analizzare i log aiuta a diagnosticare i problemi e comprendere il comportamento delle applicazioni, aspetto fondamentale per la risoluzione dei problemi e l’ottimizzazione.
- Scalabilità: La capacità di scalare le soluzioni di monitoraggio man mano che i progetti crescono. La scalabilità assicura che lo strumento di monitoraggio possa gestire carichi crescenti, evitando un degrado delle prestazioni nel tempo.
- Capacità di integrazione: La capacità di integrarsi con una vasta gamma di strumenti di monitoraggio API e piattaforme. Questa funzione consente una collaborazione fluida tra gli strumenti utilizzati nella pipeline di sviluppo, migliorando l’efficienza del flusso di lavoro e la coerenza dei dati.
- Caratteristiche di sicurezza e conformità: Misure di sicurezza integrate e report di conformità. Queste funzionalità aiutano a proteggere i dati sensibili e garantire che la pipeline di sviluppo soddisfi i requisiti normativi.
- Gestione automatizzata degli incidenti: Automazione del processo di risposta agli incidenti. Gestendo automaticamente gli incidenti, i team possono ridurre i tempi di inattività e migliorare i tempi di risposta, aumentando così l’affidabilità delle applicazioni.
- Supporto cloud-native: Ottimizzato per il monitoraggio degli ambienti cloud. Poiché molte applicazioni sono ormai ospitate nel cloud, il supporto nativo garantisce che il monitoraggio sia efficiente ed efficace in questi ambienti.
- Visibilità end-to-end: La capacità di monitorare ogni aspetto della pipeline di sviluppo. Questa funzione offre una visione olistica della pipeline, dai commit del codice al deployment, cruciale per comprendere l’impatto dei cambiamenti e individuare i colli di bottiglia.
Benefici
Gli strumenti di monitoraggio svolgono un ruolo fondamentale nell’ecosistema DevOps. Non solo aiutano a identificare e risolvere rapidamente i problemi, ma forniscono anche informazioni che possono portare a decisioni più informate e a un miglioramento generale delle prestazioni. Ecco alcuni vantaggi più specifici di questi strumenti per il tuo team DevOps:
- Maggiore Efficienza Operativa: Gli strumenti di monitoraggio DevOps automatizzano il tracciamento e l'analisi di vari parametri e log lungo tutta la pipeline di sviluppo. Questa automazione libera tempo prezioso per i team, consentendo loro di concentrarsi su attività più strategiche invece che su monitoraggio e risoluzione dei problemi manuali.
- Migliore Affidabilità del Sistema: Fornendo avvisi e notifiche in tempo reale, questi strumenti permettono ai team di rilevare e gestire tempestivamente i problemi prima che si trasformino in questioni più gravi. Questa capacità di risposta immediata riduce significativamente i tempi di inattività e assicura che i sistemi rimangano stabili e affidabili.
- Risoluzione Proattiva dei Problemi: L'utilizzo di analisi predittive e rilevamento delle anomalie aiuta le organizzazioni ad anticipare i problemi prima che si verifichino. Identificando potenziali criticità in anticipo, i team possono applicare soluzioni in modo proattivo, prevenendo interruzioni e mantenendo le operazioni fluide.
- Performance Ottimizzata: Gli strumenti Database DevOps offrono informazioni sulle prestazioni di applicazioni e infrastruttura, identificando i colli di bottiglia e le aree di miglioramento. Queste informazioni permettono ai team di ottimizzare i sistemi per ottenere migliori performance, migliorando l'esperienza utente e l'efficienza operativa.
- Maggiore Sicurezza: Grazie alle funzionalità mirate al monitoraggio delle metriche di sicurezza e degli standard di conformità, questi strumenti svolgono un ruolo cruciale nell'identificare vulnerabilità e garantire che i sistemi rispettino le migliori pratiche di sicurezza. Questo rafforzamento della postura di sicurezza protegge da violazioni e mantiene l'integrità dei dati e dei sistemi dell'organizzazione.
Costi & Prezzi
Con una varietà di opzioni di piano disponibili, comprendere i prezzi e le funzionalità di ciascuno può aiutare i responsabili dell'acquisto del software a prendere una decisione informata che sia in linea con le proprie esigenze e il budget. Dalle versioni gratuite pensate per piccoli progetti ai piani enterprise con funzionalità avanzate, esistono strumenti di monitoraggio per ogni dimensione operativa.
Tabella Comparativa dei Piani per Strumenti di Monitoraggio DevOps
Di seguito è riportata una panoramica dettagliata delle opzioni di piano più comuni e dei relativi prezzi per gli strumenti di monitoraggio DevOps, pensata per aiutare chi si avvicina a questa categoria di software a orientarsi meglio nelle scelte disponibili.
| Tipologia Piano | Prezzo Medio | Funzionalità Comuni |
|---|---|---|
| Gratuito | $0 | Funzionalità di monitoraggio di base, metriche e log limitati, supporto della community, accesso ai forum |
| Base | $20-$50/user/month | Funzionalità di monitoraggio avanzate, maggiori metriche e log, supporto via email, integrazione con altri strumenti |
| Standard | $50-$100/user/month | Suite di monitoraggio completa, analisi avanzate, supporto 24/7, dashboard personalizzabili, opzioni di integrazione |
| Premium | $100-$200/user/month | Funzionalità premium tra cui analisi predittive, capacità di machine learning, supporto dedicato, integrazioni personalizzate |
| Enterprise | Custom pricing | Tutte le funzionalità Premium più opzioni di scalabilità, account manager dedicato, sicurezza di livello enterprise |
Domande frequenti sugli strumenti di monitoraggio DevOps
Ecco alcune risposte alle domande più comuni sugli strumenti di monitoraggio DevOps:
Come gestiscono gli strumenti di monitoraggio DevOps infrastrutture su larga scala?
Gli strumenti di monitoraggio DevOps possono tracciare le prestazioni su diversi ambienti?
Come aiutano gli strumenti di monitoraggio DevOps nella risposta agli incidenti?
Qual è la differenza tra il monitoraggio dell'infrastruttura e il monitoraggio delle applicazioni?
Come riducono i falsi positivi gli strumenti di monitoraggio DevOps?
Gli strumenti di monitoraggio DevOps supportano metriche personalizzate?
Ecco cosa fare dopo:
Se stai ricercando strumenti di monitoraggio DevOps, connettiti con un consulente SoftwareSelect per raccomandazioni gratuite.
Basta compilare un modulo e sostenere una breve chiamata in cui esporrai le tue esigenze specifiche. Riceverai poi una shortlist di software da valutare. Potrai anche ricevere assistenza durante tutto il processo d'acquisto, incluse le trattative di prezzo.