Guide To The 10 Best Monitoring Tools Of 2026

10 Best Monitoring Tools Shortlist


Infrastructure monitoring software helps you track the health and performance of your systems, whether you’re managing servers, networks, applications, or virtual machines.
Many teams look for these tools when they’re dealing with blind spots in their infrastructure, struggling to detect issues early, or wasting time juggling different dashboards. Picking the wrong tool or relying on one that’s outdated can lead to missed alerts, downtime, or limited visibility.
I’ve helped teams select and set up monitoring platforms that fit their needs and actually make troubleshooting easier, not harder. This guide is based on that hands-on experience so you can find software that gives you clarity without the hassle.
Why Trust Our Software Reviews
We’ve been testing and reviewing software since 2023. As tech leaders ourselves, we know how critical and difficult it is to make the right decision when selecting software.
We invest in deep research to help our audience make better software purchasing decisions. We’ve tested more than 2,000 tools for different tech use cases and written over 1,000 comprehensive software reviews. Learn how we stay transparent & our software review methodology.
Best Monitoring Tools Summary
This comparison chart summarizes pricing details for my top monitoring tools selections to help you find the best one for your budget and business needs.
| Tool | Best For | Trial Info | Price | ||
|---|---|---|---|---|---|
| 1 | Best for real-time network visibility | 14-day free trial + free demo available | Pricing upon request | Website | |
| 2 | Best for proactive issue detection | 30-day free trial + free demo available | From $129/technician/month (billed annually) | Website | |
| 3 | Best open-source solution | Free plan available | Pricing upon request | Website | |
| 4 | Best for monitoring across all platforms | 30-day free trial | From $179/month (billed annually) | Website | |
| 5 | Best for real-time performance tracking | 30-day free trial + free demo + free plan availabl | From $199/year | Website | |
| 6 | Best for AI-assisted anomaly detection | Free trial available | From $7/host/month | Website | |
| 7 | Best for real-time application error tracking | Free plan + free trial + free demo available | From $26/month (billed annually) | Website | |
| 8 | Best for cloud-scale monitoring | Free plan available | From $15/host/month (billed annually) | Website | |
| 9 | Best for complete network management | Free demo available | From $245/25 devices | Website | |
| 10 | Best for proactive monitoring | 30-day free trial + free demo available | From $10/month (billed annually) | Website |

-

TestDevLab
Visit Website -
Site24x7
Visit WebsiteThis is an aggregated rating for this tool including ratings from Crozdesk users and ratings from other sites.4.7 -
GitHub Actions
Visit WebsiteThis is an aggregated rating for this tool including ratings from Crozdesk users and ratings from other sites.4.8


Best Monitoring Tools Reviews
Below are my detailed summaries of the best monitoring tools that made it onto my shortlist. My reviews offer a detailed look at the key features, pros & cons, integrations, and ideal use cases of each tool to help you find the best one for you.

Auvik is a network management platform that enhances your network's visibility and performance. It offers monitoring tools to help you keep your network in check and running smoothly.
Why I Picked Auvik: One of the reasons I chose Auvik as a top monitoring tool is its ability to provide real-time device monitoring. This feature lets you keep a constant eye on your network's health, ensuring that you can catch and address issues as they arise. Another compelling feature is automated network mapping, which visually represents your network's layout and connections. This helps you understand how different devices interact, making it easier to manage and troubleshoot. Another feature that stands out is performance metrics tracking. With this, you can gather valuable data about your network's performance, allowing you to make informed decisions to optimize its functionality. The platform also offers customizable alerts that notify you of potential issues, so you can address them before they escalate.
Standout Features & Integrations:
Features include configuration backups that ensure you never lose critical settings, remote device management that allows you to control devices from anywhere, and global alert settings that provide consistent monitoring across your network. These features work together to provide a comprehensive solution for managing and monitoring your network.
Integrations include Cisco, Datto, Microsoft Intune, Slack, ServiceNow, ConnectWise, Dell, Fortinet, Palo Alto Networks, Cisco Meraki, Okta, and Jamf.
Pros and Cons
Pros:
- Configuration backups and comparison automation
- Automated network mapping and discovery
- Real-time visibility into network performance
Cons:
- Limited offline management capability
- Pricing details not publicly available
New Product Updates from Auvik
Auvik Adds Aurora Troubleshooting Assistance
Auvik introduces Aurora Troubleshooting Assistance with AI-powered troubleshooting guidance, possible root causes, conversation downloads, and feedback tools. The open beta helps IT teams diagnose network issues faster with contextual recommendations tailored to specific devices and alerts. For more information, visit Auvik's official site.
 .
.
Atera is an all-in-one IT management platform designed for Managed Service Providers (MSPs) and IT professionals. It helps you monitor, manage, and automate IT operations across devices and networks, with a strong focus on reducing manual workload through AI and automation. Atera offers real-time visibility into system performance, network health, and device status, making it easier to proactively manage IT environments.
Why I Picked Atera: I chose Atera because it stands out for its remote monitoring and management (RMM) capabilities, which let you keep tabs on performance, uptime, and network health in real time. This makes it easier to catch and resolve issues before they escalate. I also value Atera’s AI-driven automation tools, which help speed up ticket resolution and free up time for more strategic IT work. Its customizable dashboards further enhance usability by giving you full control over how you view your environment.
Standout Features & Integrations:
Atera’s features include patch management to ensure systems stay secure and current, along with network discovery tools that provide a clear picture of all connected devices. Advanced reporting helps you analyze performance trends, while its built-in ticketing system centralizes issue tracking. Integrations include Salesforce, HubSpot, Microsoft Teams, Zendesk, Jira Software Cloud, Acronis Cyber Protect Cloud, Asana, ServiceNow, and WhatsApp Notifications, among others.
Pros and Cons
Pros:
- Effective IT management and issue resolution
- Combines remote monitoring, ticketing, and automation
- Affordable pricing which charges per technician rather than per device
Cons:
- Lacking some advanced customization options
- May require a slight learning curve
New Product Updates from Atera

Atera Adds Multiple API Tokens With Access Controls
Atera now supports multiple API tokens with configurable expiration dates, IP restrictions, and permission scopes, giving teams tighter control and safer delegation of API access. For more information, visit Atera's official site.

Icinga is an open-source monitoring solution that helps you keep an eye on your entire IT infrastructure. It's designed to handle complex environments, offering a wide range of features to ensure your systems are running smoothly.
Why I Picked Icinga: It allows you to monitor everything from servers and networks to applications and databases. You can automatically import data from sources like Active Directory or cloud platforms like AWS and Azure, keeping your monitoring setup in sync with your infrastructure. I also like that it provides monitoring automation, allowing you to manage repetitive processes more easily. And, with its metrics and logs, you can gather and analyze data to gain valuable insights into your systems.
Standout Features & Integrations:
Other key features include distributed and agent-based monitoring to support coverage across multiple locations and customizable alerts and notifications to help you resolve issues quickly. Its analytics tools also let you create custom dashboards and reports, helping you identify bottlenecks and track historical uptime.
Some of Icinga's integrations include Grafana, AWS, Azure, Puppet, Ansible, Chef, Terraform, Jira, PagerDuty, ServiceNow, BigPanda, and Stackstorm.
Pros and Cons
Pros:
- Free to use with no setup fees
- Scalable for both small and large environments
- Highly customizable for various IT infrastructure needs
Cons:
- Occasional performance issues reported during high-load scenarios
- Setup and configuration comes with a learning curve
New Product Updates from Icinga
Icinga Adds OpenTelemetry Support
Icinga introduces OpenTelemetry metrics support, HTTP response streaming, and key system updates. These improvements enhance performance, scalability, and integration with modern monitoring tools. For more information, visit Icinga’s official site.
 .
.
PRTG Network Monitor is a comprehensive tool that helps you keep an eye on your entire IT infrastructure. It monitors systems, devices, traffic, and applications, providing real-time insights into your network's health. With PRTG, you can identify and address issues before they become critical.
Why I Picked PRTG: I chose PRTG for its ability to unify the monitoring of various technologies through integrated protocols like SNMP, WMI, SSH, and more. This means you can oversee a wide range of platforms, devices and systems within your network, ensuring all components are functioning properly. Additionally, PRTG offers customizable reporting, allowing you to generate detailed reports tailored to your needs. Another valuable aspect of PRTG is its real-time alerting system. You receive immediate notifications about potential issues, enabling you to respond promptly and minimize downtime.
Standout Features & Integrations:
Other key features include detailed statistics for applications running in your network, helping you manage resources effectively. Additionally, its distributed monitoring feature allows you to monitor multiple networks in different locations, all from a single interface. It also has real-time maps and dashboards that visualize your network's status, making it easier to identify and address issues. Integrations include AWS, Cisco, Dell Technologies, HPE, VMware, ServiceNow, Check Point, Sonicwall, NetApp, Fujitsu, Lansweeper, and Martello.
Pros and Cons
Pros:
- Supports multiple monitoring technologies
- Customizable dashboards and real-time alerts
- Provides a comprehensive overview of network infrastructure
Cons:
- Licensing based on sensors can become expensive for larger networks
- Initial setup can be time-consuming
New Product Updates from PRTG
PRTG Introduces New Monitoring Sensors In Beta
This week, PRTG introduces three BETA sensors that broaden your monitoring scope for Proxmox VE clusters and SIMATIC S7-300/400 PLCs, giving you deeper operational insights. For more information, visit PRTG’s official site.
 .
.Best for real-time performance tracking

ManageEngine Applications Manager is a tool that helps you monitor the performance of your applications and IT infrastructure. It keeps an eye on various components like servers, databases, and cloud services to ensure they're running smoothly. By doing so, it helps your team identify and fix issues before they affect your users.
Why I Picked ManageEngine Applications Manager: One reason I chose ManageEngine Applications Manager is its ability to monitor a wide range of technologies. It supports over 150 technologies, including application servers, databases, and cloud platforms. This means you can oversee your entire IT environment from a single console, making it easier to spot and address potential problems. Another useful feature is its real-time performance tracking. The tool provides insights into metrics like CPU and memory usage, response times, and transaction details. With this information, your team can quickly identify performance bottlenecks and take corrective actions to maintain optimal application performance.
Standout Features & Integrations:
Features include synthetic transaction monitoring, which allows you to simulate user interactions with your applications to identify potential issues before they impact real users. Additionally, real user monitoring provides insights into the actual experiences of your users, helping you understand how your applications perform under real-world conditions.
Integrations include ManageEngine ServiceDesk Plus, ServiceNow, Site24x7, AlarmsOne, Slack, Prometheus, AWS, Google Cloud, Microsoft Azure, Oracle, and MySQL.
Pros and Cons
Pros:
- Monitors a wide range of applications and infrastructure components
- Real-time alerting system helps teams respond promptly to issues
- Simplifies management of applications and their relationships
Cons:
- Setting up the tool to meet specific needs can be challenging
- The tool can be resource-intensive
New Product Updates from ManageEngine Applications Manager
Oracle Cloud Application Monitoring Now Available in ManageEngine Applications Manager
ManageEngine Applications Manager introduces Oracle Cloud Application Monitoring, Oracle Cloud Function Monitoring, and Oracle Cloud NAT Gateway Monitoring. These new capabilities help teams monitor Oracle Cloud applications, serverless workloads, and network resources from a single platform. For more information, visit ManageEngine Applications Manager's official site.
 .
.
Dynatrace is a performance monitoring tool designed to oversee the entirety of a digital ecosystem. Its sophisticated AI capabilities enable it to not only monitor but also proactively identify anomalies within a system.
This particular focus on AI-driven insights makes it especially suited for those in search of a solution for anomaly detection.
Why I Picked Dynatrace: In my search for monitoring solutions, Dynatrace captured my attention because of its pronounced emphasis on AI. The decision to select it was influenced by how its unique AI capabilities facilitate rapid anomaly detection, often preempting issues before they escalate.
My judgment, after comparing various tools, led me to believe that Dynatrace is unparalleled in its offering of AI-assisted anomaly detection.
Standout Features & Integrations:
Dynatrace offers real-time anomaly detection and root cause determination, attributes that are vital for quick issue resolution. It is full-stack monitoring, from applications to infrastructure, ensures comprehensive coverage.
When it comes to integrations, Dynatrace ties in with cloud platforms, CI/CD tools, and major IT operations platforms, making it adaptable to varied IT environments.
Pros and Cons
Pros:
- Rich integration environment with popular cloud and IT operation platforms.
- Comprehensive full-stack monitoring.
- Advanced AI capabilities for real-time anomaly detection.
Cons:
- The lack of transparent pricing can be a deterrent for some potential users.
- The vast array of features might require dedicated training sessions.
- Can be complex for users unfamiliar with AI-driven tools.
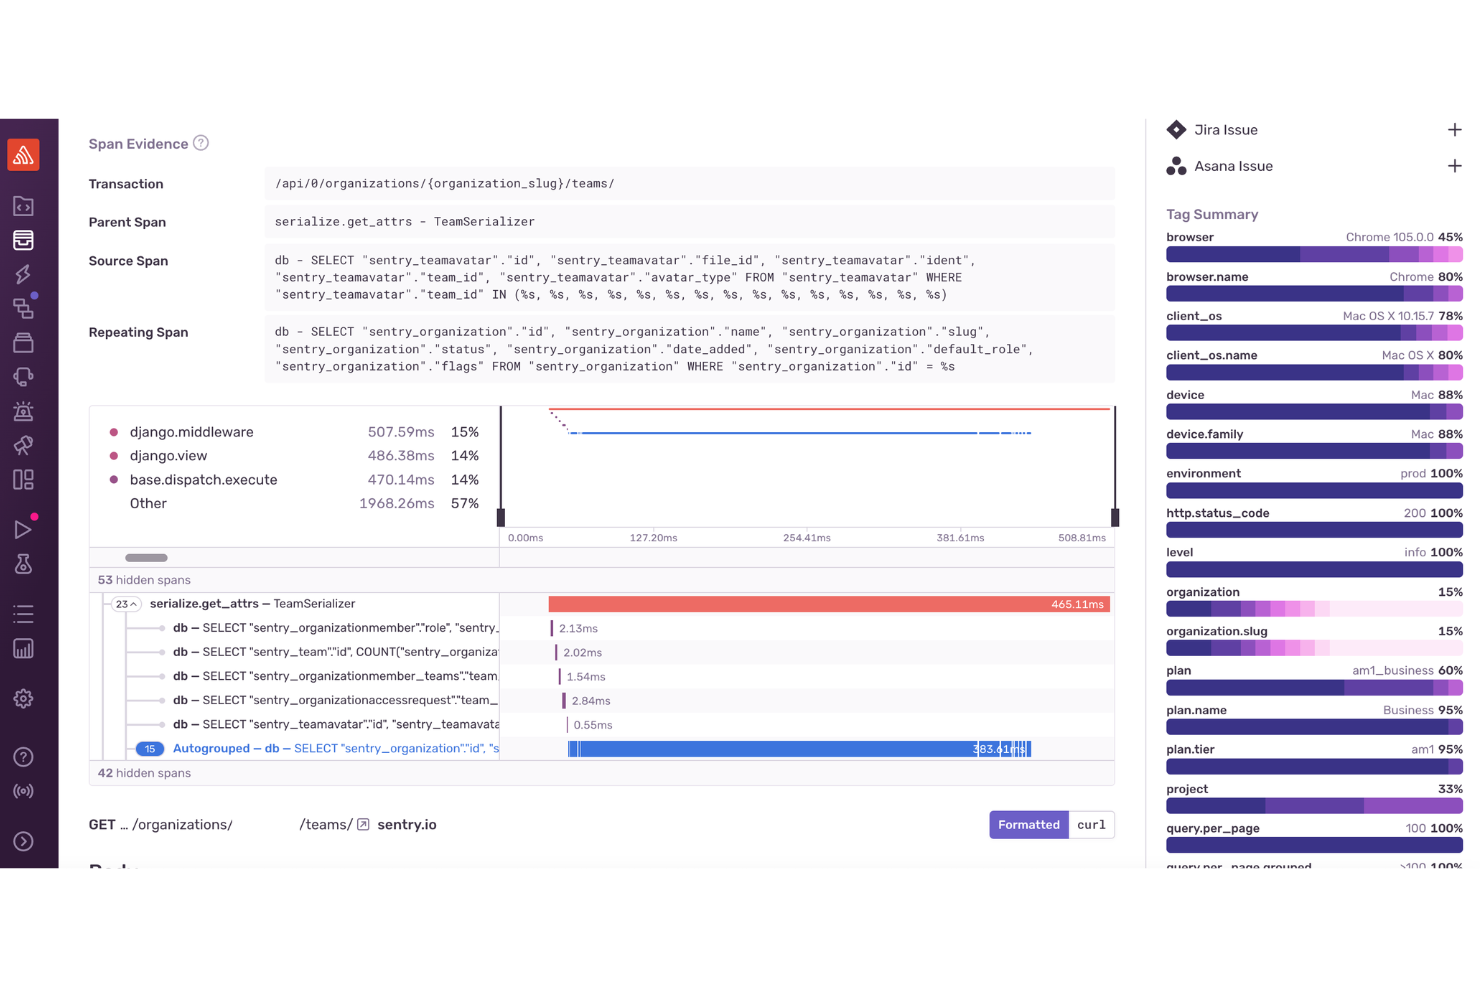
For developers and businesses seeking a monitoring tool that provides immediate insights into application performance and errors, Sentry stands out as a comprehensive solution. It is particularly appealing to those in web and mobile development, e-commerce, and enterprise sectors, addressing the critical need for real-time error tracking and performance optimization during high-traffic periods.
Why I Picked Sentry
I picked Sentry for its robust error monitoring and performance tracking capabilities. The tool excels at real-time error tracking, immediately alerting your team to issues and enabling swift resolution. Sentry's distributed tracing feature provides a detailed view of transaction performance, helping you identify slow operations and optimize them. Additionally, the session replay functionality offers visual context for debugging, making it easier to understand user interactions and address issues effectively.
Sentry Key Features
In addition to real-time application error tracking, Sentry offers:
- Mobile App Crash Reporting: Provides insights into mobile app crashes with detailed stack traces.
- Gaming Analytics: Provides performance monitoring tailored for gaming applications, highlighting latency and frame-rate issues.
- AI Code Review: Leverages AI to suggest potential fixes for detected issues, streamlining the debugging process.
- Security and Compliance: Ensures user data protection through industry-standard security measures, making it suitable for applications handling sensitive information.
Sentry Integrations
Sentry offers a wide range of native integrations to enhance workflow efficiency, including GitHub, Bitbucket, GitLab, Slack, Microsoft Teams, Jira, Asana, Trello, Datadog, and PagerDuty.
Pros and Cons
Pros:
- Offers real-time error tracking across web, mobile, and backend apps
- Advanced error grouping helps prioritize issues for fast resolution
- Distributed tracing shows transaction-level performance insights
Cons:
- Limited alerts and applications insights in lower-tier plans
- Not all integrations are available natively, relying on third-party APIs for some
New Product Updates from Sentry

Sentry Adds Log Export in CSV and JSONL
Sentry now supports exporting up to 10,000 log lines from Explore → Logs in CSV or JSON Lines, with downloads available in-browser or as background downloads and email. For more information, visit Sentry's official site.
 .
.
Datadog is a comprehensive monitoring and analytics platform that offers a unified view of IT infrastructure. Its emphasis on cloud-scale monitoring enables organizations to gain insights into their operations across various cloud environments. This close alignment with cloud-scale operations is what makes Datadog an optimal choice for such a purpose.
Why I Picked Datadog: In my process of selecting a tool for this list, Datadog consistently emerged as a top contender. I judged its capabilities based on its specialized approach to cloud-centric monitoring, which is not commonly seen in other tools.
This specific focus led me to determine that Datadog is indeed the best for those requiring cloud-scale monitoring solutions.
Standout Features & Integrations:
Datadog is known for its real-time performance dashboards, which can be tailored to display metrics, traces, and logs. Additionally, its anomaly detection can proactively identify issues before they impact users.
In terms of integrations, Datadog supports over 400 integrations, including but not limited to AWS, Google Cloud Platform, Azure, Slack, and Docker.
Pros and Cons
Pros:
- Proactive anomaly detection helps in early issue identification.
- Supports a wide array of integrations for maximum compatibility.
- Tailored dashboards provide a comprehensive view of operations.
Cons:
- Some users may face a learning curve in the beginning.
- Pricing can become substantial for larger teams.
- Might be over-complex for small-scale operations.

ManageEngine OpManager is a robust tool that specializes in providing an integrated approach to network management. It offers functionalities that span from monitoring network performance to automating network configurations, aligning it perfectly as a solution for comprehensive network management.
Why I Picked ManageEngine OpManager: When it came to choosing a tool for all-encompassing network management, ManageEngine OpManager emerged at the forefront of my evaluations. Its distinct suite of features caters specifically to those who seek a holistic perspective on their network's operations and health.
Based on these assessments, I formed the opinion that ManageEngine OpManager is best positioned for complete network management tasks.
Standout Features & Integrations:
OpManager is distinguished by its physical and virtual server monitoring capabilities. Its network configuration management allows administrators to backup, restore, and automate tasks, providing peace of mind against configuration errors.
On the integration front, ManageEngine OpManager supports integration with popular ITOM solutions and third-party IT management apps, enriching its functionality.
Pros and Cons
Pros:
- Extensive integration capabilities with other IT management solutions.
- Features a comprehensive suite for network configuration management.
- Offers both physical and virtual server monitoring.
Cons:
- Licensing model may not be favorable for all types of businesses.
- Its wide array of features might be overwhelming for small-scale operations.
- Might have a steep learning curve for beginners.
New Product Updates from ManageEngine OpManager
ManageEngine OpManager Vendor Templates and NCM XML Import
ManageEngine OpManager introduces enhanced vendor template integration and device template import for the NCM module using XML files. This update helps teams improve device classification and speed up configuration workflows. For more information, visit ManageEngine OpManager’s official site.
 .
.
Site24x7 is a cloud-based monitoring solution designed for DevOps and IT operations teams. It offers comprehensive monitoring capabilities for websites, servers, applications, and network devices, providing real-time insights into performance and availability.
Why I Picked Site24x7: I like Site24x7 for its robust application performance monitoring (APM). It supports various programming languages, including Java, .NET, Ruby, PHP, and Node.js. Another notable aspect is Site24x7's real user monitoring (RUM). This feature enables you to analyze the actual experience of users interacting with your website or web applications. By segmenting performance data by browser, platform, geography, and more, you can gain valuable insights into how different factors affect user experience and make informed decisions to improve it. Overall, these features help you proactively monitor various components of your IT infrastructure.
Standout Features & Integrations:
Other features include synthetic web transaction monitoring, which lets you record and simulate multi-step user interactions in a real browser, helping you optimize critical user journeys like login forms and shopping carts. Additionally, Site24x7's log management consolidates and indexes logs from various sources, aiding in efficient troubleshooting and issue resolution.
Integrations include ServiceNow, PagerDuty, Opsgenie, Jira, ManageEngine AlarmsOne, ManageEngine ServiceDesk Plus, Slack, Microsoft Teams, Zoho Cliq, Amazon EventBridge, Zapier, and Webhooks.
Pros and Cons
Pros:
- Comprehensive monitoring capabilities across various IT infrastructure components
- Reliable real-time alerts that enable prompt issue resolution
- Flexible customization options for dashboards and reports
Cons:
- Configuration complexity can be challenging for new users
- Limited integration options with certain third-party tools
New Product Updates from Site24x7
Site24x7 Adds Synchronization Statuses for MSPs
Site24x7 now provides MSPs enhanced alerts and synchronization statuses in a centralized notification center to spot configuration sync issues sooner and accelerate incident response. For more information, visit Site24x7's official site.

Other Monitoring Tools
Below is a list of additional monitoring tools that I shortlisted, but did not make it to the top 10. They are definitely worth checking out.
- New Relic
For application performance insights
- Nagios XI
For comprehensive infrastructure monitoring
- Prometheus
For real-time alerting and multi-dimensional data collection
- SolarWinds Observability SaaS
Good for real-time database health monitoring
- Micro Focus SiteScope
For agentless application monitoring
- Sensu
For flexible monitoring workflows
- Observium
For network and server hardware health checks
- Checkmk
For unified monitoring solutions
- Dotcom Monitor
For building multi-step scripts
- Splunk Enterprise
Good for large-scale infrastructure data analytics
- AppDynamics
Good for deep application performance insights
- LogicMonitor
Good for cloud-based infrastructure monitoring
- Netdata
Good for real-time system performance troubleshooting
- Centreon
Good for IT operation analytics in complex networks
- Atera
For integrated remote IT management


How I Evaluate Monitoring Tools
I split my evaluation into two layers: the baseline features a tool needs to handle 3am alerts and trace failures across distributed services, and the differentiators that separate good from great.
Core Functionality (Table Stakes For This List)
When I'm selecting tools for my list, I rank each one on a scale from 0 (does not offer the functionality) to 5 (excels in this area) for each core functionality listed below. Then, I calculate the tool's total score into a percentage. Each tool needs to achieve a minimum total score of 75% to be considered for inclusion.
- Real-Time Monitoring: I check how quickly each tool surfaces live metrics—whether it's CPU spikes on a host or latency shifts across a Kubernetes cluster during a deployment.
- Alerting & Notifications: Each tool's alert system should support configurable thresholds, anomaly-based triggers, and routing to channels like Slack, PagerDuty, or email.
- Multi-Source Data Collection: I evaluate whether the tool ingests metrics, logs, and traces from servers, containers, cloud services, and applications rather than covering just one telemetry type.
- Dashboards & Visualization: The ability to build custom dashboards matters—think a single pane showing API error rates alongside database query times during an incident.
- Historical Data & Reporting: Trend analysis over weeks or months is essential for capacity planning, so I look at retention windows and the depth of reporting options.
- Integrations & Extensibility: A tool should connect to the broader stack—CI/CD pipelines, ITSM platforms, cloud providers—via native integrations, APIs, or open standards like OpenTelemetry.
Once I have a list of tools that meet this criteria, I consider what sets each platform apart.
Differentiating Factors (What Sets Vendors Apart)
Here's how I compare and contrast different vendors:
Standout Features
Distributed tracing is a major differentiator—when a checkout flow spans five microservices, I want to see exactly where latency builds up. Auto-discovery and topology mapping also matters for teams managing dynamic environments where containers spin up constantly. I look at synthetic monitoring too, which lets you simulate user transactions and API calls to catch failures before real users are impacted.
Beyond Features
Pricing predictability is something I evaluate closely—monitoring costs can spiral when data ingestion spikes during incidents, so I check whether a vendor's model stays manageable as your environment grows. Security and compliance certifications like SOC 2 and ISO 27001 also factor in, especially for teams in regulated industries. I consider time-to-value too: pre-built dashboards, auto-instrumentation, and lightweight agents make a real difference when you need visibility on day one.
How to Choose Monitoring Tools
It’s easy to get bogged down in long feature lists and complex pricing structures. To help you stay focused as you work through your unique software selection process, here’s a checklist of factors to keep in mind:
| Factor | What to Consider |
|---|---|
| Scalability | Can the tool grow with your business? Consider future needs and whether the tool can handle increased data and users without performance issues. Look for flexible scaling options. |
| Integrations | Does it connect with your existing systems? Ensure compatibility with your current tech stack, like CRM, ERP, or cloud services, to avoid costly workarounds. |
| Customizability | Can you tailor the tool to your workflows? Check if you can modify dashboards, alerts, and reports to fit your team's specific processes and needs. |
| Ease of use | Is the tool intuitive for your team? Evaluate the learning curve and whether your team can quickly adopt the tool without extensive training. Look for user-friendly interfaces. |
| Implementation and onboarding | How smooth is the setup process? Consider the time and resources needed to get the tool up and running. Look for vendors offering comprehensive onboarding support and resources. |
| Cost | Does the pricing fit your budget? Compare the tool's cost against its features and benefits. Watch for hidden fees or charges for additional users or features. |
| Security safeguards | Does it protect your data? Assess the security measures in place, such as encryption and compliance with industry standards, to ensure your data remains safe. |
| Support availability | Is help accessible when needed? Check the support options available, such as 24/7 help, live chat, or dedicated account managers, to ensure assistance is there when you need it. |
What Are Monitoring Tools?
Monitoring tools are software that track the performance and health of systems, networks, and applications. They're used by IT teams, DevOps engineers, and system admins to find issues early, reduce downtime, and keep systems running smoothly. Metrics tracking, alerting, and dashboards help with spotting trends, troubleshooting problems, and keeping teams informed. Hardware monitoring software gives teams the visibility they need to manage systems without surprises.
Features
When selecting monitoring tools, keep an eye out for the following key features:
- Real-time alerts: Notify users instantly when issues arise, allowing for quick response and resolution.
- Customizable dashboards: Tailor the interface to display metrics and data that are most relevant to your team.
- Integration capabilities: Connect seamlessly with existing systems and software to provide a unified view of operations.
- Automated root cause analysis: Identify the underlying cause of issues without manual intervention, saving time and effort.
- Predictive analytics: Forecast potential problems before they occur, helping to maintain system stability.
- Scalability: Adapt to growing data and user demands, ensuring the tool remains effective as your business expands.
- Security safeguards: Protect sensitive data with encryption and compliance with industry standards.
- Comprehensive reporting: Generate detailed reports to analyze performance trends and support decision-making.
- Multi-cloud support: Monitor applications across different cloud environments, providing a comprehensive view of operations.
- User-friendly interface: Ensure ease of use, allowing team members to navigate and utilize the tool efficiently.
Benefits
Implementing monitoring tools alongside network mapping tools provides several benefits for your team and your business. Here are a few you can look forward to:
- Improved system performance: Real-time alerts and automated root cause analysis help you quickly address issues, keeping systems running smoothly.
- Enhanced decision-making: Comprehensive reporting and predictive analytics offer insights that support informed business decisions.
- Increased efficiency: Customizable dashboards and integration capabilities save time by delivering relevant data in an accessible format.
- Scalability: As your business grows, scalability ensures the tool adapts to increased demands without performance issues.
- Data security: Security safeguards protect your sensitive information, ensuring compliance with industry standards.
- Cost savings: Early issue detection and resolution reduce downtime and associated costs, benefiting your bottom line.
- Cross-platform visibility: Multi-cloud support provides a unified view of operations across different environments, enhancing overall transparency.
Costs & Pricing
Selecting monitoring tools requires an understanding of the various pricing models and plans available. Costs vary based on features, team size, add-ons, and more. The table below summarizes common plans, their average prices, and typical features included in monitoring tools solutions:
Plan Comparison Table for Monitoring Tools
| Plan Type | Average Price | Common Features |
|---|---|---|
| Free Plan | $0/user/month | Basic monitoring, limited alerting, and community support. |
| Personal Plan | $5-$25/user/month | Real-time alerts, customizable dashboards, and basic analytics. |
| Business Plan | $30-$75/user/month | Advanced reporting, integration capabilities, and multi-user access. |
| Enterprise Plan | $100-$300/user/month | Predictive analytics, 24/7 support, and full customization options. |
Monitoring Tools FAQs
Here are some answers to common questions about monitoring tools:
How does a monitoring tool work?
A monitoring tool tracks various metrics like CPU load, network bandwidth, and disk space. It helps detect issues and alerts administrators before users are affected. These tools ensure systems run smoothly by providing insights into performance and potential problems.
What skills are needed to use monitoring tools?
You’ll need statistical and analytical skills to gather and analyze data. These skills help you understand the impact of monitoring and make informed decisions. Being comfortable with data interpretation and having a basic understanding of IT systems will also be beneficial.
How to select application monitoring tools?
Consider your application’s type and complexity. Evaluate how easy the tool is to deploy and manage, and ensure it meets your security standards. Look for features that align with your specific needs and provide the most value to your team.
How do network monitoring tools work?
Network monitoring tools track aspects like traffic, bandwidth utilization, and uptime. They detect devices on the network and provide status updates. This helps in managing network performance and identifying potential issues before they affect users.
What are common challenges when using monitoring tools?
Users often face challenges like data overload, which can make it hard to identify key issues. Integration with existing systems can also be tricky. It’s important to configure alerts properly to avoid unnecessary notifications that can lead to alert fatigue.
How can monitoring tools improve system performance?
Monitoring tools provide real-time insights into system performance, helping you identify and address issues quickly. By analyzing trends and alerting you to potential problems, these tools help maintain optimal system health and reduce downtime.
What’s Next:
If you're in the process of researching monitoring tools, connect with a SoftwareSelect advisor for free recommendations.
You fill out a form and have a quick chat where they get into the specifics of your needs. Then you'll get a shortlist of software to review. They'll even support you through the entire buying process, including price negotiations.