Your Guide To The 10 Best API Monitoring Tools of 2026

10 Best API Monitoring Tools Shortlist


API monitoring tools help you track the performance and health of your APIs so you can catch issues early and keep your services running smoothly.
Many teams start looking for these tools when they hit problems like downtime they didn’t catch in time, bugs caused by changes to external APIs, or gaps in monitoring across environments. Without the right solution, it’s easy to miss warning signs until users complain.
I’ve tested these tools across both on-prem and cloud setups, with a close eye on how well they handle real-world traffic and alerts. In this guide, I’ll share what stood out, what fell short, and how to find a tool that fits your stack and workflow.
Why Trust Our Software Reviews
We’ve been testing and reviewing software since 2023. As tech leaders ourselves, we know how critical and difficult it is to make the right decision when selecting software.
We invest in deep research to help our audience make better software purchasing decisions. We’ve tested more than 2,000 tools for different tech use cases and written over 1,000 comprehensive software reviews. Learn how we stay transparent & our software review methodology.
Best API Monitoring Tools Summary
| Tool | Best For | Trial Info | Price | ||
|---|---|---|---|---|---|
| 1 | Best for cloud-scale synthetic monitoring | 14-day free trial | From $15/host/month (billed annually) | Website | |
| 2 | Best for multi-gateway API monitoring | Free demo available | Pricing upon request | Website | |
| 3 | Best for multi-step transaction monitoring | 30-day free trial + free demo available | From $10/month (billed annually) | Website | |
| 4 | Best for uptime monitoring and detailed reports | 30-day free trial + demo available | From $10/month | Website | |
| 5 | Best for actionable insights with intelligent alerting | Free trial available | Pricing upon request | Website | |
| 6 | Best for enterprise-grade API lifecycle management | 30-day free trial + free demo available | Pricing upon request | Website | |
| 7 | Best for real-time data visualization and search capabilities | 7-day free trial available | Pricing upon request | Website | |
| 8 | Best for developer-friendly API testing and monitoring | Free plan available | From $9/month (billed annually) | Website | |
| 9 | Best for application experience insights | Free demo available | From $50/user/month (billed annually) | Website | |
| 10 | Best for behavior analytics on API usage | Not available | From $79/user/month | Website |
-

TestDevLab
Visit Website -
Site24x7
Visit WebsiteThis is an aggregated rating for this tool including ratings from Crozdesk users and ratings from other sites.4.7 -
GitHub Actions
Visit WebsiteThis is an aggregated rating for this tool including ratings from Crozdesk users and ratings from other sites.4.8


Best API Monitoring Tools Reviews
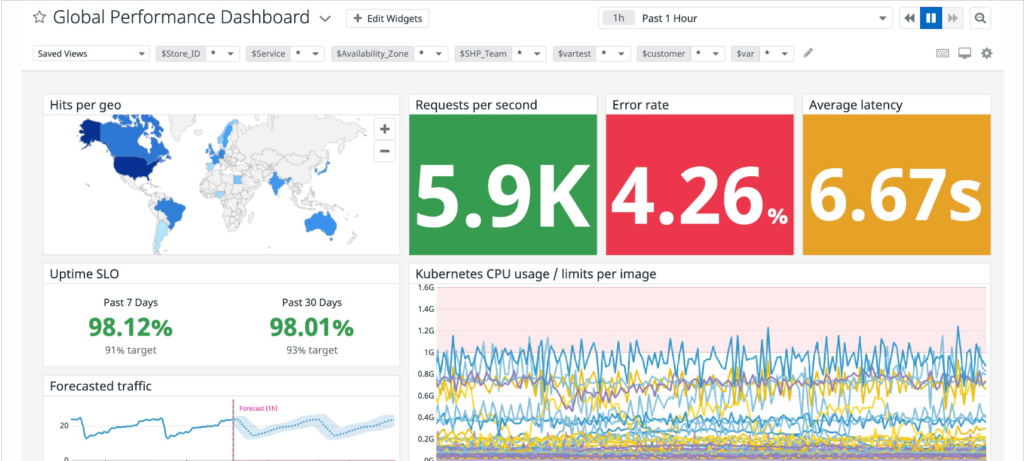
Datadog offers an impressive platform primarily centered around cloud monitoring. Its synthetic monitoring feature stands out, helping businesses to simulate user interactions and track application and API performance at a cloud scale.
Why I Picked Datadog: In my search for cloud-focused monitoring solutions, Datadog's capabilities were hard to overlook. Its emphasis on cloud-scale synthetic monitoring and the breadth of its feature set made it a clear choice. It is my opinion that Datadog is the top choice for businesses needing to simulate and monitor performance in cloud environments.
Standout Features & Integrations:
Datadog’s synthetic monitoring can simulate interactions from global locations, ensuring performance consistency worldwide. The tool’s visualizations, including flame graphs, provide deep insights into application performance.
Integration-wise, Datadog supports a myriad of platforms including AWS, Azure, Google Cloud, and numerous third-party integrations.
Pros and Cons
Pros:
- Powerful visualization tools for performance analysis
- Wide range of cloud integrations
- Advanced synthetic monitoring capabilities
Cons:
- Some configurations can require advanced technical know-how
- The vastness of features might be daunting for beginners
- Can be pricey for smaller organizations
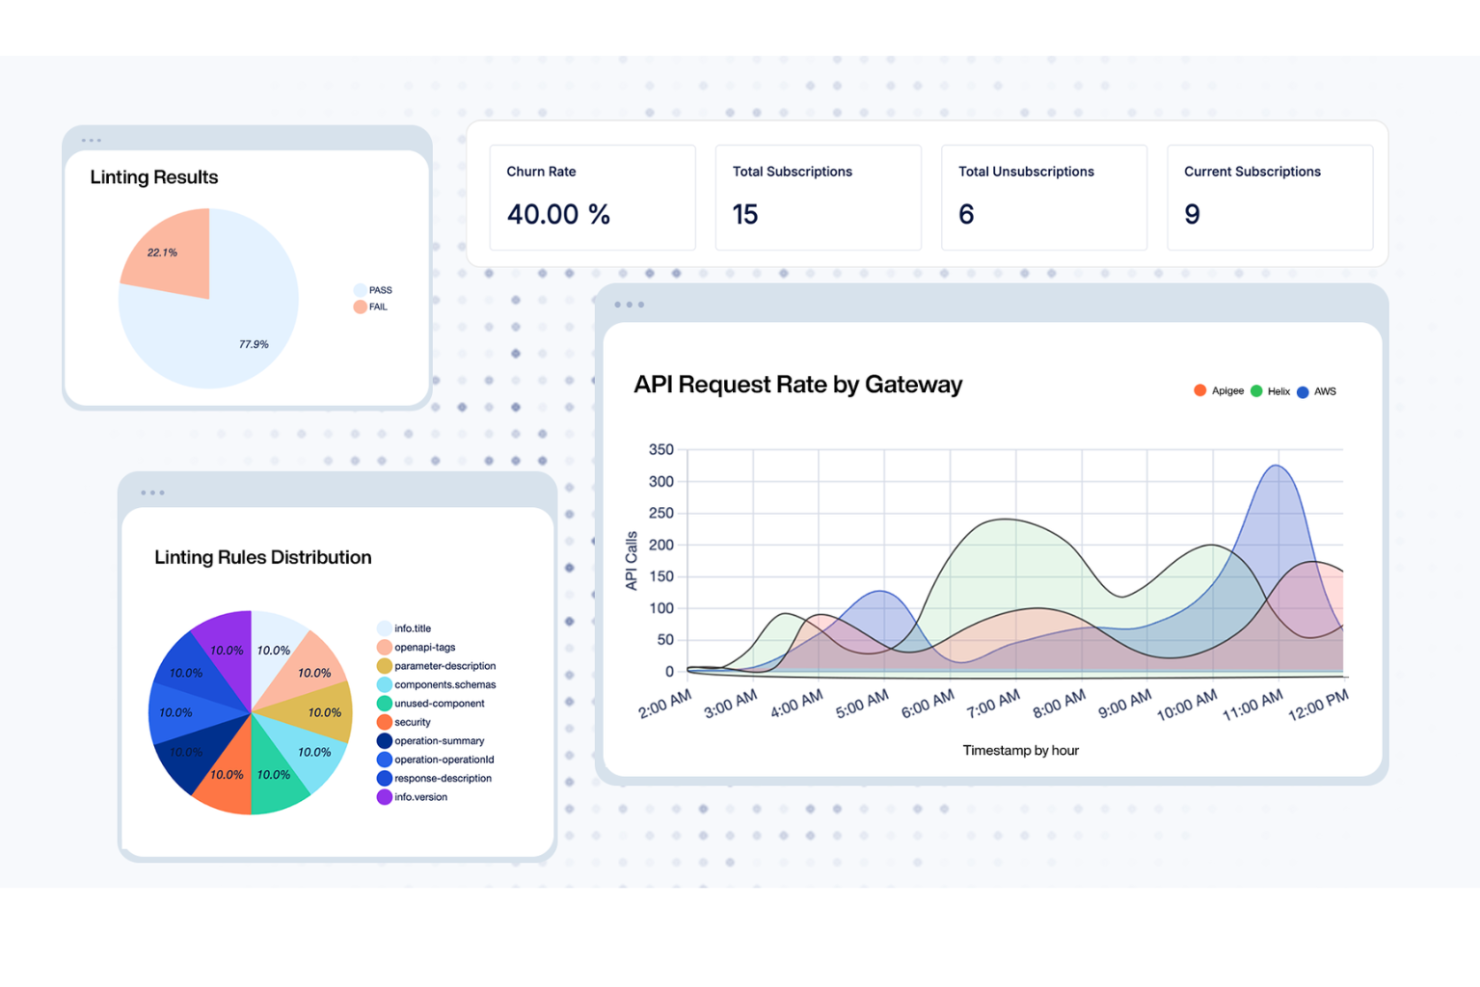
DigitalAPI provides a versatile platform for businesses that want to improve how they manage APIs, covering everything from discovery to monetization. Built with regulated industries like healthcare and banking in mind, it offers a unified control system and a developer portal that simplifies API deployment. This makes it a solid option for enterprises that need strong governance and security across their API operations.
Why I Picked DigitalAPI
I chose DigitalAPI for its centralized API governance and detailed analytics, both of which are essential for effective monitoring. The unified control system lets you manage APIs across multiple gateways while maintaining consistency and security. Its analytics provide clear visibility into API performance, making it easier to spot and resolve issues quickly. Together, these capabilities make DigitalAPI a strong choice for teams focused on improving API monitoring.
DigitalAPI Key Features
In addition to its governance and analytics capabilities, I also found several other features beneficial for API monitoring:
- API Marketplace: Enables API monetization through an external platform, helping expand revenue opportunities.
- Developer Portal: Offers a central hub where developers can access APIs, making integration and management more straightforward.
- One-Click Deployment: Streamlines API deployment across multiple gateways, reducing time and operational effort.
- AI Integration: Adds artificial intelligence capabilities to APIs, supporting advanced functionality and automation.
DigitalAPI Integrations
Native integrations are not currently listed by DigitalAPI.
Pros and Cons
Pros:
- Helix Gateway supports full lifecycle
- Detailed analytics for API performance
- Centralized governance across multiple gateways
Cons:
- Pricing details not publicly available
- No listed native integrations
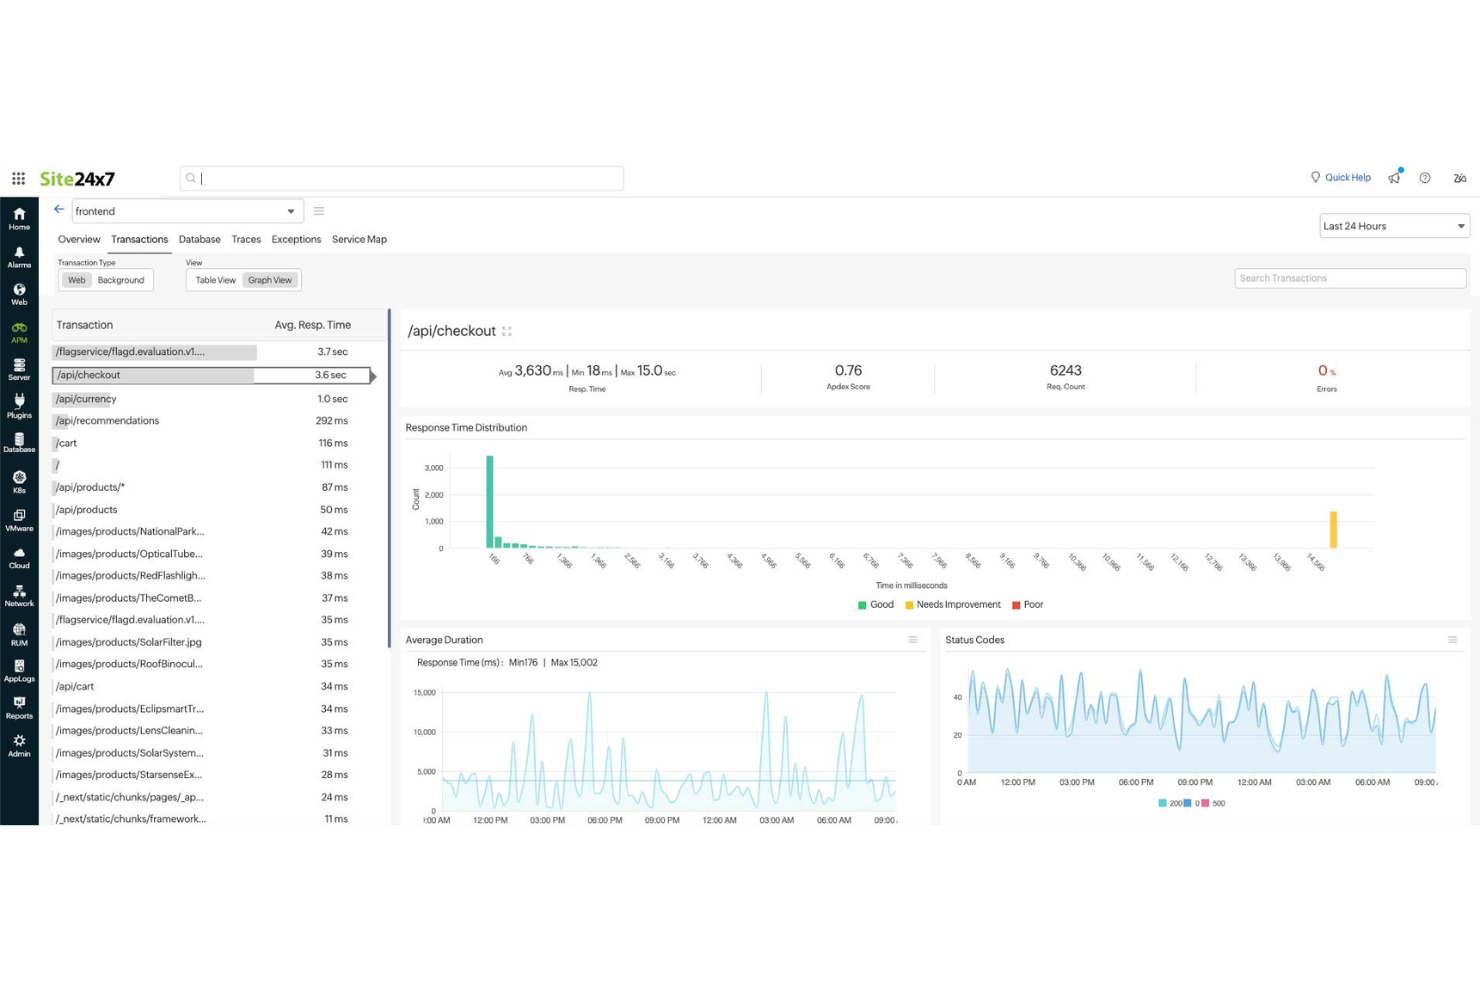
Site24x7 is an ideal solution for businesses seeking to ensure their APIs run smoothly and reliably, with support for multi-step transaction monitoring to track API workflows more effectively. If you're in an industry where consistent application performance is important, Site24x7's API monitoring tools help you observe and troubleshoot API behavior in real time, addressing issues before they affect users. By using its capabilities, you can maintain service availability and keep your team focused on delivering reliable digital experiences.
Why I Picked Site24x7
I picked Site24x7 for its multi-step transaction monitoring, which helps track API workflows across sequential requests. The platform also supports monitoring REST, SOAP, gRPC, and WebSocket APIs, allowing you to observe response times and error rates. Its alerting system notifies you when performance issues occur, helping teams address problems early. These capabilities make Site24x7 useful for businesses that depend on stable API integrations.
Site24x7 Key Features
In addition to multi-step transaction monitoring, Site24x7 offers:
- Global Monitoring Locations: With over 130 locations worldwide, you can ensure your APIs perform optimally for users worldwide.
- Content Validation: Site24x7 checks if the API response contains the expected content, ensuring data integrity.
- Instant Notifications: Get immediate alerts for any API performance issues, allowing you to respond swiftly and maintain service quality.
Site24x7 Integrations
Integrations include ServiceNow, PagerDuty, Jira, Slack, Microsoft Teams, AWS, Azure, Kubernetes, and more.
Pros and Cons
Pros:
- Quick setup process covers websites and cloud resource monitoring
- AI-powered full-stack monitoring supports multicloud infrastructure management
- Flexible monitoring integrates easily with multiple infrastructure components
Cons:
- Complex configuration slows initial setup and platform understanding
- Alert bugs cause issues when adding new monitoring configurations
New Product Updates from Site24x7

Site24x7 Adds Discovery Issues for AWS Monitoring
Site24x7 added Discovery Issues for AWS monitoring, helping teams identify why resources are not being discovered across services and regions. The feature surfaces permission gaps, policy restrictions, and blocked API actions to support faster troubleshooting. For more information, visit Site24x7’s official site.
 .
.
Pingdom is primarily recognized for its prowess in uptime monitoring, ensuring that APIs and websites remain operational. Paired with this is its capability to generate in-depth reports, providing users with a detailed understanding of their API's performance.
Why I Picked Pingdom: In my quest for reliable monitoring tools, Pingdom's dedication to uptime monitoring, complemented by its detailed reporting, was undeniable. I appreciated its straightforward approach to delivering timely insights about any downtimes. For teams that prioritize constant uptime and comprehensive reporting, Pingdom is clearly the go-to tool.
Standout Features & Integrations:
Pingdom excels with its real-time monitoring that instantly notifies users of downtimes. Its root cause analysis helps in troubleshooting issues swiftly.
Integration-wise, Pingdom collaborates with platforms such as Slack, Opsgenie, and PagerDuty.
Pros and Cons
Pros:
- Flexible alerting system
- Detailed root cause analysis
- Accurate real-time uptime monitoring
Cons:
- Historical data retention varies with pricing tiers
- Advanced features limited to higher-tier plans
- Mobile apps can sometimes lag
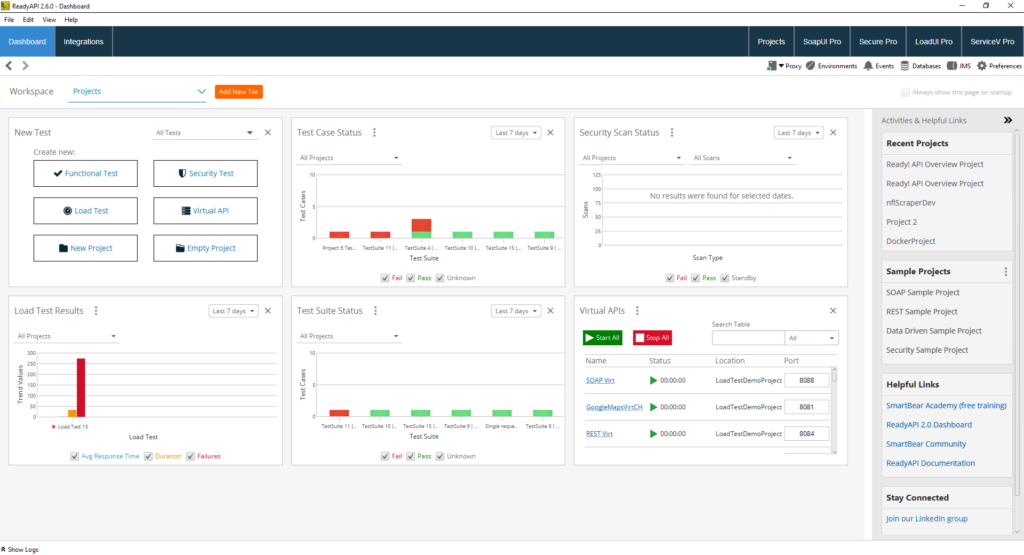
Smartbear has cemented its position in the API world as a sophisticated tool that offers in-depth analytics combined with sharp alerting mechanisms. Converging advanced monitoring with intelligent alerts, aids teams in not just identifying but also acting upon issues efficiently.
Why I Picked Smartbear: In my pursuit of the best monitoring tools, Smartbear's capability to offer actionable insights caught my eye. When choosing, I appreciated its robust alerting system that goes beyond the ordinary, making it a cut above the rest. It's clear to me that Smartbear is the optimal choice for those teams that prioritize actionable insights complemented by intelligent alerting.
Standout Features & Integrations:
Smartbear brings to the table advanced performance monitoring, which includes API uptime, functionality, and data validation checks. Additionally, its synthetic monitoring can simulate complex user scenarios across various endpoints.
For integrations, Smartbear connects effectively with platforms like Slack, JIRA, and PagerDuty.
Pros and Cons
Pros:
- Simulates complex user journeys with ease
- Robust and timely alerting mechanisms
- Deep analytical insights
Cons:
- Some users might find the UI less intuitive
- Limited features in the base plan
- Slightly steep learning curve for beginners

IBM API Connect is a comprehensive solution tailored for businesses that demand enterprise-level management of their API lifecycle. It facilitates the creation, deployment, management, and monitoring of APIs, with a clear focus on catering to large-scale enterprise needs.
Why I Picked IBM API Connect: When evaluating tools for API lifecycle management, IBM API Connect was an evident standout due to its robust features tailored for large-scale operations. My decision was swayed by its reputation for being a trusted choice for enterprises. In my judgment, for businesses that require end-to-end control over their API lifecycle with enterprise-grade robustness, IBM API Connect excels.
Standout Features & Integrations:
IBM API Connect offers a unified dashboard that provides insights into API health, usage, and overall performance. Its in-built developer portal promotes API adoption and collaboration.
For integrations, it supports connectivity with IBM Cloud services, Watson AI, and enterprise databases.
Pros and Cons
Pros:
- Robust analytics and monitoring tools
- Integrated developer portal for increased collaboration
- Comprehensive API lifecycle management
Cons:
- Initial setup and integration can be time-consuming
- The pricing structure can be complex for some users
- Might be overwhelming for small-scale operations

Kibana, a brainchild of the Elastic Stack, plays a crucial role in visualizing Elasticsearch data. Its prowess in real-time data visualization, paired with superior search capabilities, helps tech teams delve deeper into their data than ever.
Why I Picked Kibana: Navigating through the sea of API monitoring tools, Kibana caught my attention due to its intuitive and dynamic visualizations. I selected this tool based on its unique strength in helping users understand and act on their data.
When weighing its merits, it became clear that Kibana is genuinely best for those who value real-time data visualization and potent search mechanisms.
Standout Features & Integrations:
Kibana's dashboard offers a customizable workspace to visualize, navigate, and dissect complex data. Its Lens feature brings drag-and-drop capabilities to data visualization. Moreover, Kibana integrates with Elasticsearch, Logstash, and Beats, enhancing its utility manifold.
Pros and Cons
Pros:
- Powerful search across vast datasets
- Deep integration with the Elastic Stack
- Dynamic real-time data visualization
Cons:
- Advanced features demand a steeper learning curve
- Requires an Elastic Stack setup for maximum benefit
- Might feel overwhelming for beginners

Postman has etched its name in the tech industry as a developer's trusted companion for API testing. With its intuitive design, it facilitates both testing and monitoring, ensuring APIs function as intended.
Why I Picked Postman: Selecting tools for this list demanded a keen eye for utility, and Postman's developer-centric approach was hard to overlook. I chose it because of its user-friendly design that simplifies the complex realm of API testing. My judgment is that for those seeking a blend of simplicity and efficacy in API testing and monitoring, Postman remains a frontrunner.
Standout Features & Integrations:
Postman's collection runs enable automated testing, while its mock servers simulate API responses without any backend. The tool also integrates well with popular CI/CD platforms, ensuring testing in development pipelines. Key integrations include platforms like Jenkins, Travis CI, and CircleCI.
Pros and Cons
Pros:
- Robust integration with CI/CD platforms
- Comprehensive testing tools including mock servers
- Developer-friendly interface
Cons:
- Advanced features may require a learning curve
- Large collections can slow down the app
- Monitoring features can be basically compared to specialized tools

Catchpoint stands out as a beacon for those striving for optimal application experiences. With its robust platform, it transforms raw data into actionable insights, making it the go-to for application performance monitoring.
Why I Picked Catchpoint: Choosing tools for this list meant diving deep into their functionalities and discerning their unique value propositions. Catchpoint emerged as a winner for its unparalleled focus on application experience. I determined that for those chasing the best application insights, nothing beats Catchpoint.
Standout Features & Integrations:
Catchpoint’s Node.js monitoring provides deep insights into app health. Its synthetic monitoring spans various protocols, from HTTP to WebSockets. It smoothly integrates with platforms like Slack, ServiceNow, and Splunk, driving productivity and efficient incident management.
Pros and Cons
Pros:
- The wide array of integration options
- A variety of monitoring tests are available
- Comprehensive application experience monitoring
Cons:
- he vastness of features might be daunting for new users
- More expensive than some competitors
- Initial configuration can be time-consuming

Moesif distinguishes itself by focusing intently on API user behavior analytics. This platform not only tracks API calls but delves deeper into analyzing how users interact, offering a granular view of user behavior.
Why I Picked Moesif: After comparing a plethora of API tools, Moesif's emphasis on behavior analytics resonated with me. My decision was influenced by its unparalleled capability to delve into API usage patterns, something most tools skim over. For businesses keen on understanding the nuances of how their APIs are consumed, Moesif stands unmatched.
Standout Features & Integrations:
Moesif offers detailed user profiles that track individual API usage, enhancing personalization efforts. Its time series metrics, paired with segmentation capabilities, offer profound insights.
On the integration front, Moesif smoothly integrates with platforms like Segment, Datadog, and PagerDuty.
Pros and Cons
Pros:
- Comprehensive time-series metrics
- Individual user tracking for better personalization
- In-depth behavior analytics
Cons:
- Initial setup may require some technical know-how
- Pricing can get steep for larger teams
- Can be overwhelming due to the depth of data
Other API Monitoring Tools
Below is a list of additional API monitoring tools that I shortlisted, but did not make it to the top 10. They are definitely worth checking out.
- Astera
For holistic API management and integration
- APImetrics
For comprehensive API performance insights
- Uptrends
For global perspective with multiple checkpoint locations
- Dotcom Monitor
For multi-step API monitoring
- Treblle
For real-time API performance insights
- AppDynamics
Good for deep dive diagnostics in real-time
- New Relic
Good for application health visualizations
- Splunk
Good for extensive log analysis capabilities
- Sensu
Good for event monitoring in dynamic environments
- Ghost Inspector
Good for automated UI testing and monitoring
- Grafana Cloud
Good for customizable monitoring dashboards
- OpenNMS
Good for network fault and performance management
- Apica
Good for large-scale load testing scenarios
- 3Scale
Good for API traffic control and security
- Runscope
Good for API data validation tests
- Rapid API
Good for vast API marketplace connections
- LoadView
Good for dynamic API load testing
- StatusCake API
Good for comprehensive uptime checks
- APIMatic
Good for SDK generation from API definitions


How I Evaluate API Monitoring Tools
I split my evaluation into two layers: baseline capabilities every tool must cover—like multi-region checks, latency tracking, and assertions—and the differentiators that set the best options apart.
Core Functionality (Table Stakes For This List)
When I'm selecting tools for my list, I rank each one on a scale from 0 (does not offer the functionality) to 5 (excels in this area) for each core functionality listed below. Then, I calculate the tool's total score into a percentage. Each tool needs to achieve a minimum total score of 65% to be considered for inclusion.
- Uptime & Availability Monitoring: I check whether the tool runs HTTP/HTTPS checks from multiple global regions, since a single checkpoint won't catch regional outages or CDN failures.
- Performance & Latency Tracking: Beyond raw response times, I look for waterfall breakdowns (DNS, TLS, TTFB) and historical trend data that help you spot slow degradation before users notice.
- Synthetic API Testing: I evaluate support for all standard HTTP methods, custom headers, authentication flows, and scheduled intervals—think OAuth token refreshes or POST calls with dynamic payloads.
- Multi-Step Workflow Monitoring: Chaining requests matters. I look for the ability to pass variables between steps, like extracting a session token from a login call and injecting it into subsequent requests.
- Alerting & Notifications: I consider channel variety (email, Slack, SMS, PagerDuty, webhooks) and whether the tool supports escalation policies so the right on-call engineer gets paged first.
- Response Validation & Assertions: I look for assertion depth—status codes are table stakes, but JSON path matching, regex checks, and schema validation catch the subtle payload issues that break integrations.
Once I have a list of tools that meet this criteria, I consider what sets each platform apart.
Differentiating Factors (What Sets Vendors Apart)
Here's how I compare and contrast different vendors:
Standout Features
Tools that can import OpenAPI specs or Postman collections save hours of manual monitor setup, especially when you're covering dozens of endpoints. I also look for native CI/CD plugins—running API checks inside a GitHub Actions or GitLab pipeline means you catch breaking changes before they hit production. Distributed tracing integration is another differentiator worth evaluating, since linking a failed monitor to a specific trace across microservices turns a vague alert into an actionable root cause.
Beyond Features
Deployment flexibility matters—if your team monitors internal APIs behind a firewall, you need private agent support, not just cloud-hosted checks. I also evaluate how well each tool fits into existing observability stacks, checking for native integrations with platforms like Datadog, Grafana, and PagerDuty. Security posture is another factor I consider, especially RBAC, encrypted credential storage, and SOC 2 compliance, since API monitors often handle production tokens and sensitive auth flows.
How to Choose API Monitoring Tools
It’s easy to get bogged down in long feature lists and complex pricing structures. To help you stay focused as you work through your unique software selection process, here’s a checklist of factors to keep in mind:
| Factor | What to Consider |
|---|---|
| Scalability | Can the tool handle your expected growth in API calls and users? Look for scalable architecture to avoid bottlenecks as your needs expand. |
| Integrations | Does it easily integrate with your existing systems like CI/CD pipelines or alerting tools? Check compatibility with your tech stack. |
| Customizability | Can you tailor the tool to fit specific monitoring needs or workflows? Look for customizable dashboards and alerts to match your requirements. |
| Ease of use | Is the interface user-friendly for your team? A steep learning curve can slow down adoption, so prioritize intuitive design and clear navigation. |
| Implementation and onboarding | How quickly can your team get up and running with the tool? Consider the availability of training resources and support during the setup phase. |
| Cost | Does the pricing fit your budget? Compare subscription plans and check for hidden fees. Look for free trials to test before committing. |
| Security safeguards | Does it offer encryption and compliance with security standards? Ensure the tool protects sensitive data and meets your security requirements. |
What Are API Monitoring Tools?
API monitoring tools are software that tracks the performance, uptime, and health of APIs. They’re used by developers, DevOps engineers, and QA teams to make sure APIs are working as expected and to catch problems before users notice them.
Alerts, logs, and reporting features help with spotting downtime, debugging slow responses, and confirming SLAs are met. These tools make it easier to maintain reliable services and avoid issues that hurt user experience.
Features
When selecting API monitoring tools, keep an eye out for the following key features:
- Uptime monitoring: Tracks the availability of APIs to ensure they are accessible and functioning properly.
- Response time tracking: Measures how quickly APIs respond to requests, helping to identify performance bottlenecks.
- Alert notifications: Sends alerts when issues are detected, allowing for immediate response to potential problems.
- Customizable dashboards: Provides tailored views of API performance metrics to suit specific monitoring needs.
- Integration capabilities: Easily connects with existing systems like CI/CD pipelines and alerting tools for seamless workflow integration.
- Security compliance: Ensures data protection by adhering to industry security standards and encryption protocols.
- Real-time analytics: Offers immediate insights into API performance, enabling proactive performance management.
- Multi-region testing: Simulates API requests from different locations to assess global performance and latency.
- AI-driven insights: Utilizes artificial intelligence to detect anomalies and predict potential issues before they occur.
Benefits
Implementing API monitoring tools provides several benefits for your team and your business. Here are a few you can look forward to:
- Improved reliability: By monitoring uptime, these tools help ensure that APIs are consistently available and dependable.
- Faster issue resolution: Alert notifications enable your team to quickly address problems, minimizing downtime and service disruptions.
- Enhanced performance: Response time tracking helps identify and fix performance bottlenecks, ensuring efficient API operations.
- Informed decision-making: Real-time analytics provide insights into API usage and performance, supporting data-driven decisions.
- Increased security: Compliance with security standards helps protect sensitive data and maintain user trust.
- Global reach assessment: Multi-region testing allows your team to evaluate API performance across different geographic locations.
- Proactive management: AI-driven insights help predict and address potential issues before they impact users.
Costs & Pricing
Selecting API monitoring tools requires an understanding of the various pricing models and plans available. Costs vary based on features, team size, add-ons, and more. The table below summarizes common plans, their average prices, and typical features included in API monitoring tools solutions:
Plan Comparison Table for API Monitoring Tools
| Plan Type | Average Price | Common Features |
|---|---|---|
| Free Plan | $0 | Basic uptime monitoring, limited alert notifications, and basic analytics. |
| Personal Plan | $5-$25/user/month | Uptime and response time tracking, customizable dashboards, and email alerts. |
| Business Plan | $50-$150/user/month | Multi-region testing, integration capabilities, real-time analytics, and advanced alerts. |
| Enterprise Plan | $200+/user/month | AI-driven insights, advanced security compliance, dedicated support, and full customizability. |
API Monitoring Tools FAQs
Here are some answers to common questions about API monitoring tools:
How do you monitor API usage?
API usage is typically monitored by tracking uptime, which is measured as a percentage of the time the API is available. Most aim for 99.9% or higher uptime. Monitoring tools can alert you to any downtime, helping you quickly address issues.
Which aspects of an API should be monitored?
Key aspects to monitor include access control management, security services, and network firewall security. Tools should also track SSL/TLS orchestration and provide unified management features to ensure comprehensive oversight of your API’s performance and security.
How often should you test your APIs?
Regular testing is crucial, with many tools offering minute-by-minute checks. Frequent tests help catch issues early and maintain reliability. Consider setting your monitoring system to test each API at least every few minutes to ensure consistent performance.
Why are alert notifications important in API monitoring?
Alert notifications are essential because they immediately inform you of any issues, allowing for quick resolution. Without timely alerts, problems can go unnoticed, leading to extended downtime and potentially impacting user experience.
Why do prices vary so much between different tools?
The cost of an API monitoring tool is influenced by various factors: the depth and breadth of features, target audience, scalability, brand reputation, and the level of customer support provided.
What’s Next:
If you're in the process of researching API monitoring tools, connect with a SoftwareSelect advisor for free recommendations.
You fill out a form and have a quick chat where they get into the specifics of your needs. Then you'll get a shortlist of software to review. They'll even support you through the entire buying process, including price negotiations.