Le 10 Migliori Soluzioni di Monitoraggio Server Recensite nel 2026

Migliori strumenti di monitoraggio dei server – Shortlist


I migliori software di monitoraggio dei server aiutano i team a rilevare tempestivamente i problemi di prestazioni, ridurre i tempi di inattività, monitorare l'utilizzo delle risorse e mantenere i sistemi critici funzionanti in modo affidabile. Questi strumenti offrono ai team IT e operativi la visibilità necessaria per comprendere come si comportano i server sotto carico e intervenire prima che gli utenti vengano coinvolti.
I team di solito cercano soluzioni di monitoraggio dei server quando errori di configurazione causano interruzioni, i controlli manuali portano a segnali d'allarme mancati oppure le falle di sicurezza passano inosservate sulle infrastrutture chiave. Questi problemi generano rallentamenti, guasti imprevisti e difficoltà per i team che devono coordinare la risoluzione dei problemi in ambienti complessi.
Con oltre 20 anni di esperienza nel settore come Chief Technology Officer, ho testato e recensito dozzine di piattaforme di software di monitoraggio dei server in ambienti reali per valutarne accuratezza, opzioni di integrazione e facilità d'uso. Questa guida evidenzia i migliori software di monitoraggio dei server che migliorano l’affidabilità del sistema, supportano una risposta più rapida agli incidenti e aiutano i team a mantenere prestazioni prevedibili. Ogni recensione illustra funzionalità, pro e contro, e casi d’uso ideali per aiutarti a scegliere lo strumento più adatto.
Perché Fidarti delle Nostre Recensioni Software
Testiamo e recensiamo software dal 2023. Come leader tecnologici, sappiamo quanto sia cruciale e difficile prendere la decisione giusta nella scelta di un software.
Investiamo in una ricerca approfondita per aiutare il nostro pubblico a effettuare scelte migliori di acquisto software. Abbiamo testato oltre 2.000 strumenti per diversi casi d’uso tecnologici e scritto più di 1.000 recensioni complete. Scopri come restiamo trasparenti e la nostra metodologia di recensione del software.
Riepilogo dei migliori strumenti di monitoraggio dei server
Questo confronto riassume i dettagli sui prezzi dei miei strumenti di monitoraggio dei server migliori per aiutarti a trovare quello più adatto al tuo budget e alle esigenze della tua azienda.
| Tool | Best For | Trial Info | Price | ||
|---|---|---|---|---|---|
| 1 | Best for agentless Windows server monitoring | 14-day free trial + free demo available | Pricing upon request | Website | |
| 2 | Best open-source solution | Free plan available | Pricing upon request | Website | |
| 3 | Best for continuous server tracking | Free demo available | From $245/25 devices | Website | |
| 4 | Best for large-scale server monitoring | Free plan + 30-day free trial available | From $275/month (billed annually) | Website | |
| 5 | Best for real-time server monitoring | 30-day free trial | From $179/month (billed annually) | Website | |
| 6 | Best for extensive server metric tracking | 30-day free trial + free demo available | From $10/month (billed annually) | Website | |
| 7 | Best for AI-powered application performance | Free trial available | From $7/host/month | Website | |
| 8 | Best for distributed tracing and error debugging | Free plan + free trial + free demo available | From $26/month (billed annually) | Website | |
| 9 | Best for cloud-scale infrastructure monitoring | Free plan available | From $15/host/month (billed annually) | Website | |
| 10 | Best for endpoint management and patch compliance | 14-day free trial available | Pricing upon request | Website |
-

TestDevLab
Visit Website -
Site24x7
Visit WebsiteThis is an aggregated rating for this tool including ratings from Crozdesk users and ratings from other sites.4.7 -
GitHub Actions
Visit WebsiteThis is an aggregated rating for this tool including ratings from Crozdesk users and ratings from other sites.4.8


Recensioni dei migliori strumenti di monitoraggio dei server
Di seguito trovi i miei riepiloghi dettagliati dei migliori strumenti di monitoraggio dei server inclusi nella mia shortlist. Le mie recensioni offrono una panoramica approfondita delle funzionalità chiave, pro e contro, integrazioni e casi d’uso ideali di ogni strumento per aiutarti a trovare quello più adatto a te.
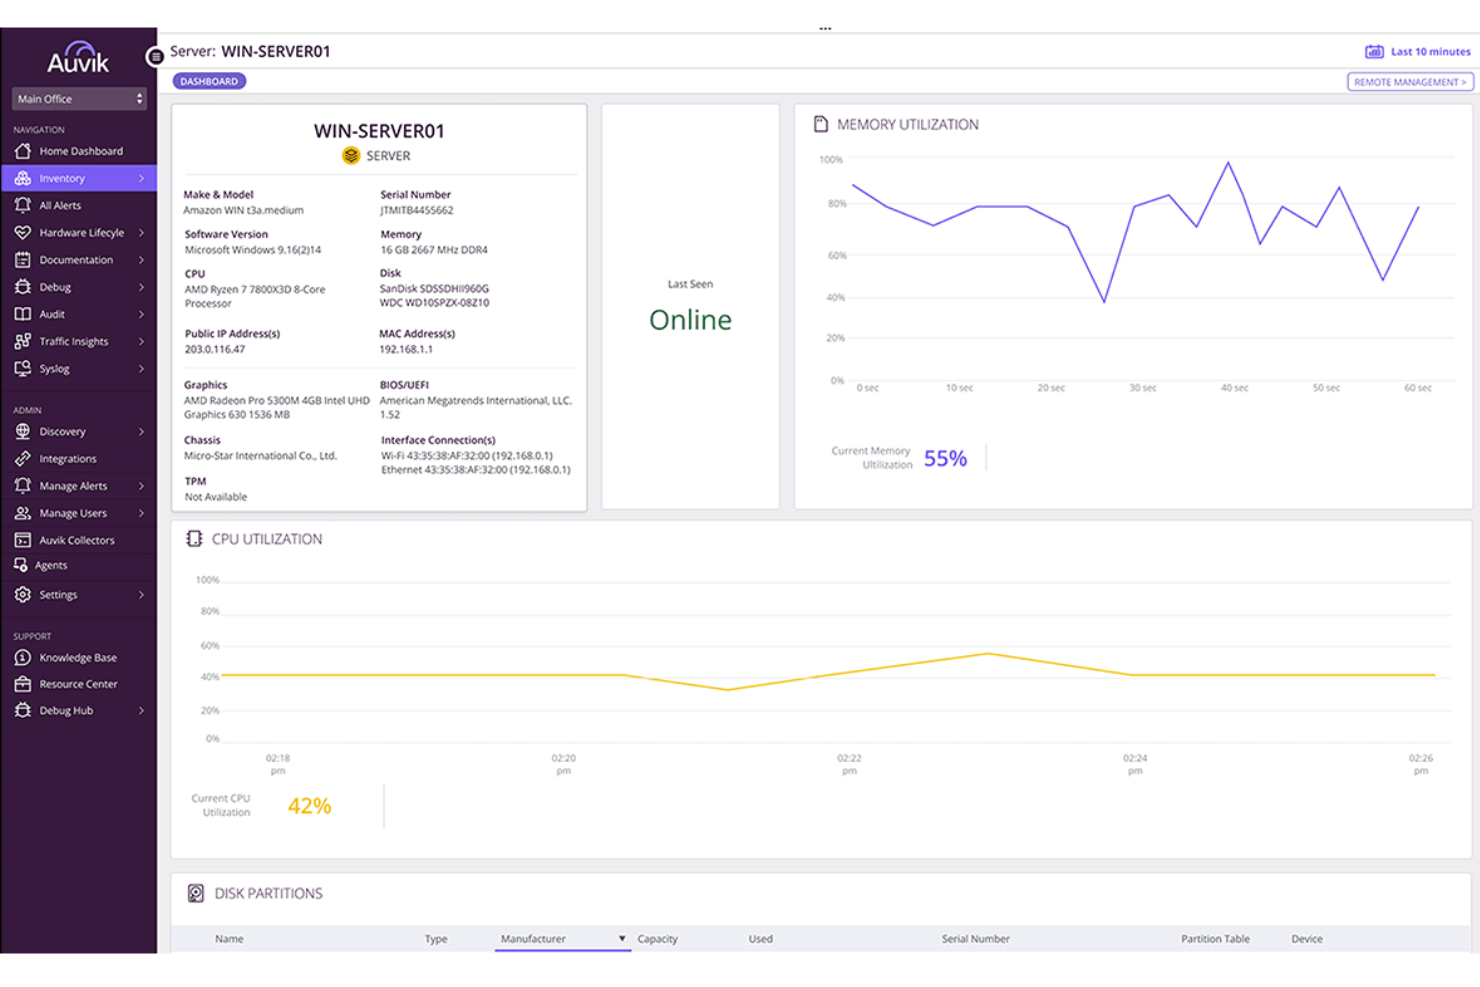
Auvik gives IT teams and managed service providers a way to monitor, map, and manage server and network infrastructure from a single cloud-based dashboard, helping you detect issues and maintain uptime across complex environments.
Who Is Auvik Best For?
Auvik is a strong fit for managed service providers and internal IT teams that need centralized visibility across multi-site or multi-client network and server environments.
Why I Picked Auvik
I picked Auvik as one of the best because I love how it handles Windows server monitoring without requiring you to rip and replace your existing setup. The agentless path via the Auvik Collector gives you real-time visibility into CPU, memory, disk utilization, and online status—without installing software on each server. I also like the Windows Services alerting, where my team can build custom alert rules using Alerts 2.0 to trigger on specific service states, service names, or utilization thresholds, with suppression options to cut down on noise from services that self-recover. The automated software inventory pulls application name, vendor, version, and install date from each monitored server, which is genuinely useful when you're doing a security audit or chasing down a software compliance issue.
Auvik Key Features
- Automated server discovery: Auvik automatically discovers Windows servers and surfaces detailed component and service information within minutes of deployment.
- Performance dashboards: View CPU, memory, and disk utilization trends over time in dedicated server dashboards, with historical data you can use to spot patterns and plan capacity.
- Performance forecasting: Auvik tracks CPU and memory metrics over time to identify usage trends and predict potential issues before they affect server availability.
- Multi-site infrastructure visibility: Monitor servers and network devices across unlimited sites from a single cloud-based dashboard, with all alerts and device data in one place.
Auvik Integrations
Auvik offers native integrations with ConnectWise, Autotask, ServiceNow, Slack, PagerDuty, Freshdesk, Zendesk, Microsoft Teams, and Webex, and also provides an API for custom integrations.
Pros and Cons
Pros:
- Agentless monitoring provides fast setup for Windows servers
- Real-time alerts help teams respond before performance degrades
- Automated configuration backups protect against changes gone wrong
Cons:
- Limited support for Linux and other non-Windows servers
- Advanced features may require additional setup and tuning
New Product Updates from Auvik
Auvik Adds Aurora Troubleshooting Assistance
Auvik introduces Aurora Troubleshooting Assistance with AI-powered troubleshooting guidance, possible root causes, conversation downloads, and feedback tools. The open beta helps IT teams diagnose network issues faster with contextual recommendations tailored to specific devices and alerts. For more information, visit Auvik's official site.
 .
.
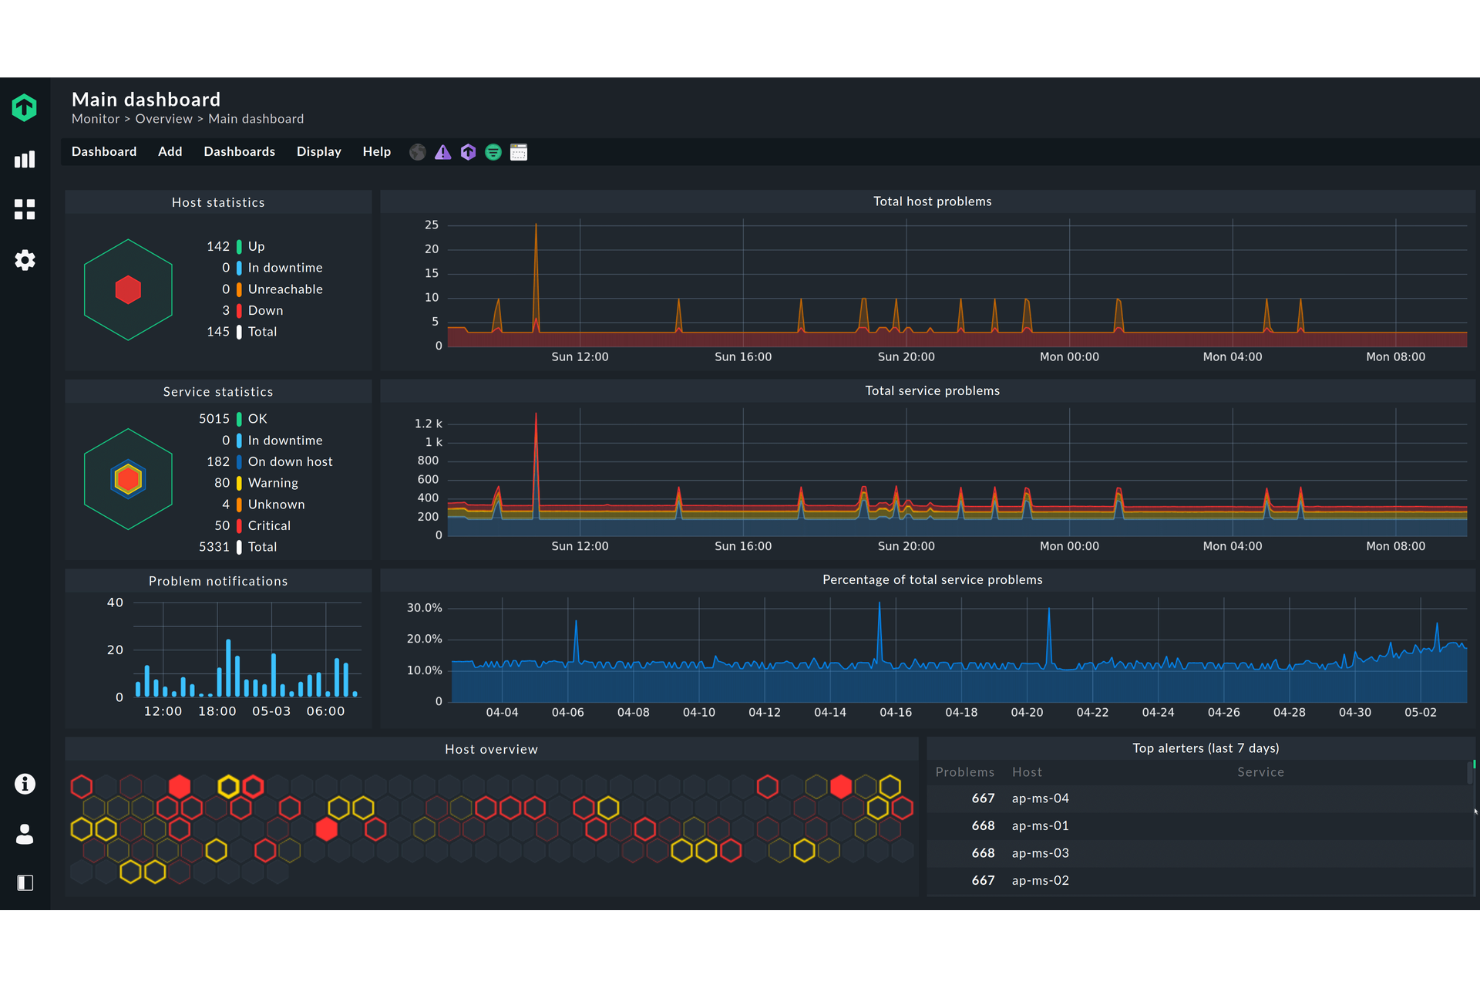
Icinga is a monitoring platform built for IT teams and system administrators who need deep visibility into server health, network performance, and infrastructure status across complex environments.
Who Is Icinga Best For?
Icinga is a strong fit for mid-to-large IT teams that need a highly customizable, open-source monitoring solution they can adapt to complex, multi-environment infrastructure.
Why I Picked Icinga
Icinga earns its spot on my shortlist because it's one of the few genuinely open-source server monitoring platforms that doesn't water down its feature set to push you toward a paid tier. I like how Icinga's check execution engine lets my team define custom monitoring logic using any scripting language, so we're not locked into predefined check templates. The Icinga Director module is particularly useful—it gives us a web-based configuration interface for managing hosts, services, and notifications at scale without touching config files directly. For teams running hybrid or on-premises infrastructure, that level of control is hard to replicate in a closed-source tool.
Icinga Key Features
- Distributed monitoring: Deploy satellite zones to monitor remote networks and data centers from a central Icinga instance.
- Alerting and escalation rules: Configure notification workflows that route alerts to the right team members based on severity and time windows.
- Icinga DB: A high-performance backend that stores and processes monitoring data for fast querying and reporting.
- Graphing and visualization: Integrate with tools like Grafana to display real-time performance metrics and historical server data.
Icinga Integrations
Icinga offers native integrations with Grafana, Jira, Slack, PagerDuty, ServiceNow, InfluxDB, Elasticsearch, Graylog, and has an API for custom integrations.
Pros and Cons
Pros:
- Highly customizable for various IT infrastructure needs
- Scalable for both small and large environments
- Free to use with no setup fees
Cons:
- Setup and configuration comes with a learning curve
- Occasional performance issues reported during high-load scenario
New Product Updates from Icinga
Icinga Adds OpenTelemetry Support
Icinga introduces OpenTelemetry metrics support, HTTP response streaming, and key system updates. These improvements enhance performance, scalability, and integration with modern monitoring tools. For more information, visit Icinga’s official site.
 .
.
ManageEngine OpManager is a network and server monitoring platform built for IT teams and system administrators who need to track server health, performance, and uptime across complex infrastructures.
Who Is ManageEngine OpManager Best For?
ManageEngine OpManager is well-suited to mid-size and large IT teams that manage distributed server environments and need centralized visibility.
Why I Picked ManageEngine OpManager
ManageEngine OpManager earns its spot on my shortlist because of how thoroughly it covers continuous server tracking—monitoring intervals can go as low as 30 seconds, and real-time "heartbeat" monitors can run at 1-second intervals for mission-critical resources. It tracks over 300 dedicated performance metrics across 130+ server vendors, from CPU and memory utilization to disk latency and deadlocks per second. The ML-powered adaptive thresholds are a genuine differentiator—OpManager learns what "normal" looks like for each metric and automatically adjusts alarm thresholds every hour, reducing false positives. This continuous, self-calibrating visibility is hard to replicate with manual threshold configuration.
ManageEngine OpManager Key Features
- Server log monitoring: Tracks Windows event logs, syslogs, and application logs for Exchange, IIS, and MS SQL servers, with rule-based alerting for specific log events.
- Automated workflow builder: Uses a drag-and-drop, code-free interface with 70+ actions to build sequential remediation workflows that can restart services or spin up VMs automatically.
- 3D data center floor views: Lets you map server racks and datacenter floors in 2D or 3D, with real-time device status overlaid on the physical layout.
- Storage capacity forecasting: Analyzes historical and current usage trends to generate reports predicting future storage utilization before capacity issues arise.
ManageEngine OpManager Integrations
ManageEngine OpManager offers native integrations with ServiceDesk Plus, AlarmsOne, Analytics Plus, Applications Manager, NetFlow Analyzer, Network Configuration Manager, and has native integrations across the Microsoft ecosystem, including Microsoft 365 and Azure. An API is available for custom integrations.
Pros and Cons
Pros:
- Scalability for growing networks
- Real-time alerting
- Comprehensive monitoring capabilities
Cons:
- Occasional update issues
- Complex initial setup
New Product Updates from ManageEngine OpManager
ManageEngine OpManager Vendor Templates and NCM XML Import
ManageEngine OpManager introduces enhanced vendor template integration and device template import for the NCM module using XML files. This update helps teams improve device classification and speed up configuration workflows. For more information, visit ManageEngine OpManager’s official site.
 .
.
Checkmk is a monitoring platform built for IT teams and enterprises that need to track server health, performance, and availability across complex, distributed environments.
Who Is Checkmk Best For?
Checkmk is a strong fit for mid-to-large enterprises and managed service providers running extensive server infrastructure across on-premises, cloud, or hybrid environments.
Why I Picked Checkmk
Checkmk earns its spot on my shortlist because of how well it handles large-scale server monitoring without buckling under the weight of complex infrastructure. I particularly like its distributed monitoring architecture, which lets my team scale across hundreds of sites and monitor millions of devices from a single setup. The auto-discovery feature is useful—it detects hosts and services automatically, so onboarding new servers doesn't require manual configuration at every step. The rule-based 1-to-N configuration lets me apply monitoring rules across thousands of hosts at once, rather than configuring each one individually.
Checkmk Key Features
- Predictive monitoring: Uses historical data and algorithms to dynamically adjust thresholds and forecast future resource consumption before issues occur.
- Log monitoring: Collects and filters events from syslog, SNMP traps, Windows event logs, and log files, collapsing duplicate entries to reduce alert noise.
- Agent Bakery: Centrally manages and automates agent deployment and updates across hosts, reducing manual overhead for large server fleets.
- Hardware and software inventory: Automatically identifies and tracks all hardware and software assets, monitoring changes and integrating data into your CMDB view.
Checkmk Integrations
Checkmk offers 20+ native integrations, including ServiceNow, Jira, Grafana, Nagios, Prometheus, VMware vSphere, AWS, Azure, Google Cloud Platform, Slack, and Zapier. An API is available for custom integrations.
Pros and Cons
Pros:
- REST API for integration with third-party tools
- Customizable dashboards
- Scalable monitoring
Cons:
- Potential learning curve for beginners
- Complex setup

PRTG is a monitoring platform built for IT teams and system administrators who need to keep servers, networks, and infrastructure running smoothly with customizable dashboards, automated alerts, and support for a wide range of protocols.
Who Is PRTG Best For?
PRTG is a strong fit for mid-size to large IT teams managing complex, multi-device environments who need centralized visibility across servers, networks, and applications.
Why I Picked PRTG
I picked PRTG as one of the best for real-time server monitoring because of how granular and immediate its sensor-based monitoring is. Each sensor tracks a single measured value—CPU load, memory usage, disk space—and you can configure the scanning interval per sensor, so you're getting live data at whatever cadence your environment demands. PRTG's alerting goes beyond simple up/down notifications: you can set threshold triggers that fire before a server hits a critical state, which means my team can catch a disk filling up or a memory spike before it causes an outage. The AI-driven anomaly detection adds another layer by adapting baselines to your environment automatically, so alerts stay relevant rather than noisy.
PRTG Key Features
- Distributed monitoring: Monitor multiple remote locations from a single dashboard using probes that communicate via TLS encryption.
- Customizable reporting: Build and schedule reports using custom templates to share infrastructure status with stakeholders.
- Maps and dashboards: Design real-time network maps with live status information using the drag-and-drop map designer.
- Mobile app access: Monitor your environment on the go using PRTG's native apps for iOS and Android.
PRTG Integrations
PRTG offers native integrations with Amazon CloudWatch, VMware vSphere, Microsoft Azure, Google Cloud Platform, Cisco, Dell EMC, HPE, NetApp, and has native integrations across the Microsoft ecosystem, including Microsoft 365 and Azure. An API is available for custom integrations.
Pros and Cons
Pros:
- User-friendly visual interface
- Customizable monitoring and alerting
- Scalable for a wide range of network sizes
Cons:
- More advanced features may come with a learning curve
- High costs for larger deployments
New Product Updates from PRTG
PRTG Introduces New Monitoring Sensors In Beta
This week, PRTG introduces three BETA sensors that broaden your monitoring scope for Proxmox VE clusters and SIMATIC S7-300/400 PLCs, giving you deeper operational insights. For more information, visit PRTG’s official site.
 .
.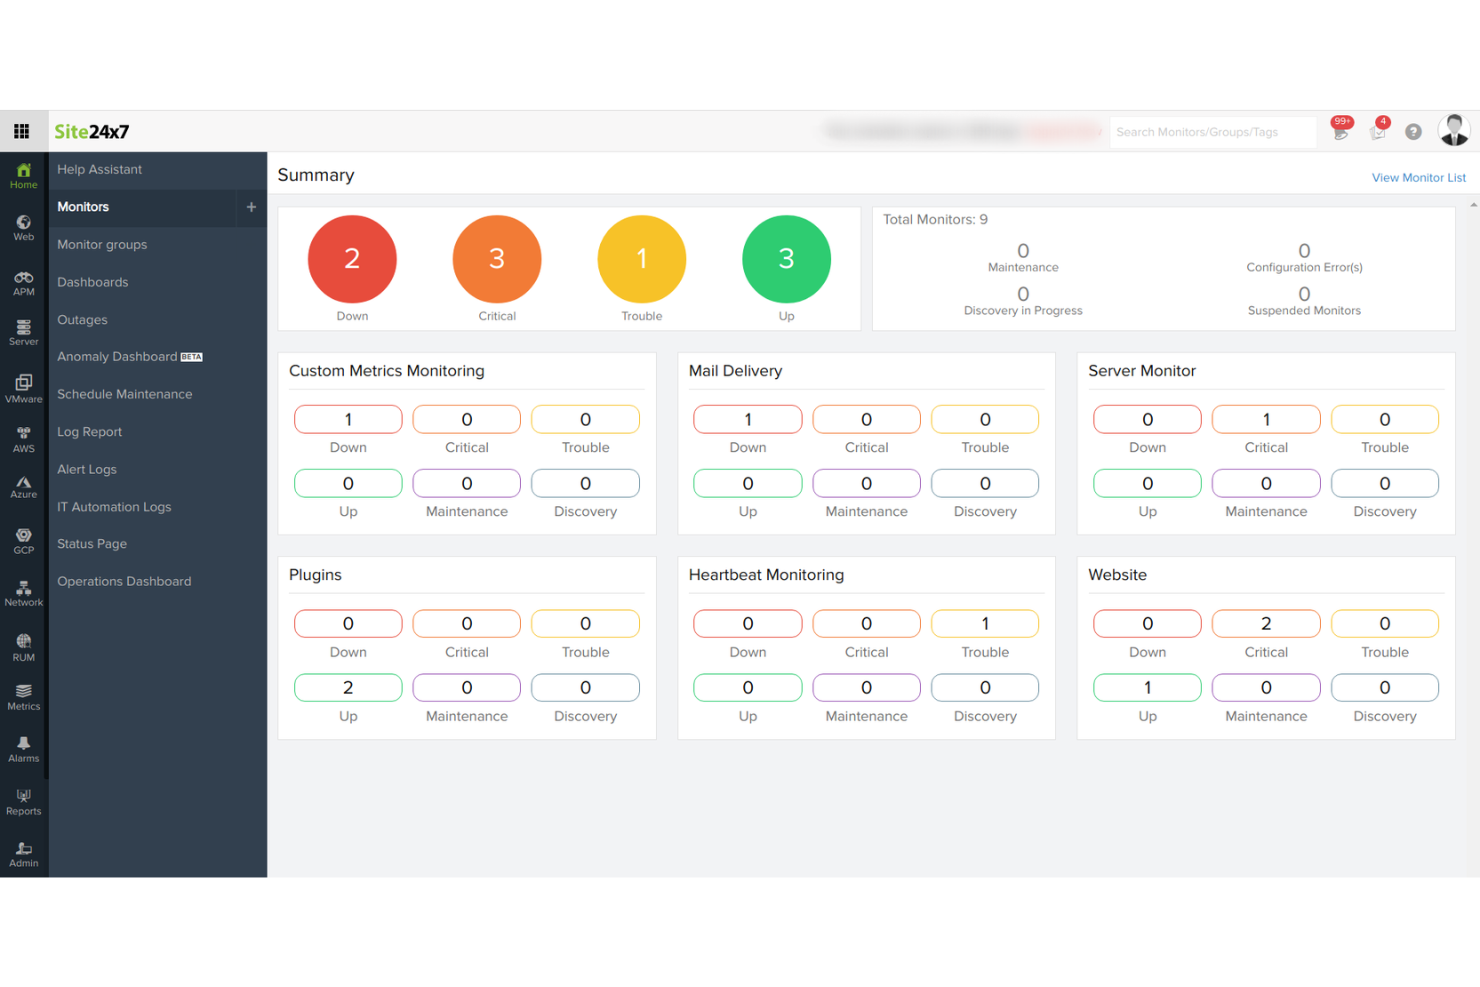
Site24x7 gives IT teams and managed service providers a unified platform to monitor server health, performance, and uptime across cloud and on-premises environments, helping you catch issues before they impact users.
Who Is Site24x7 Best For?
Site24x7 is a good fit for IT teams and MSPs that manage mixed infrastructure environments and need a single tool to monitor servers, applications, and networks together.
Why I Picked Site24x7
Site24x7 earns its spot on my shortlist because of how deep it goes on server metric tracking. I can monitor CPU usage, memory, disk I/O, network throughput, and running processes all from a single dashboard—without needing to stitch together separate tools. I also like the process monitoring feature, which lets me track specific services and get alerted the moment one stops responding. Site24x7's server monitoring reports give me historical performance data I use to spot trends before they turn into incidents.
Site24x7 Key Features
- AI-powered anomaly detection: Site24x7 uses machine learning to flag unusual server behavior and forecast performance degradation before it causes an outage.
- Log management: Collect, search, and analyze server log data directly within the platform to correlate log events with performance metrics.
- VMware and container monitoring: Track VMware ESX/ESXi hosts, Docker containers, and Kubernetes clusters alongside physical servers from one console.
- Customizable alerting: Set threshold-based or anomaly-triggered alerts with escalation policies to route notifications to the right team members.
Site24x7 Integrations
Site24x7 offers 100+ native integrations, including AWS, Azure, Google Cloud Platform, Microsoft Teams, Slack, PagerDuty, Jira, ServiceNow, Opsgenie, Datadog, and Zapier. An API is available for custom integrations.
Pros and Cons
Pros:
- Customizable dashboards and reports
- Real-time alerts and notifications
- Comprehensive monitoring capabilities
Cons:
- Limited customization in alerting mechanisms
- Complexity in initial setup for large environments
New Product Updates from Site24x7
Site24x7 Adds Synchronization Statuses for MSPs
Site24x7 now provides MSPs enhanced alerts and synchronization statuses in a centralized notification center to spot configuration sync issues sooner and accelerate incident response. For more information, visit Site24x7's official site.


Dynatrace gives IT teams and enterprises a unified platform to monitor server health, analyze infrastructure performance, and pinpoint issues across complex cloud and hybrid environments.
Who Is Dynatrace Best For?
Dynatrace is a strong fit for large enterprises and DevOps teams managing complex, multi-cloud or hybrid infrastructures who need deep visibility across their full technology stack.
Why I Picked Dynatrace
Dynatrace earns its spot on my shortlist because of how its Davis AI engine handles root cause analysis. Instead of surfacing a flood of alerts for my team to sort through, Davis automatically pinpoints the exact source of a performance issue—down to the code level—before users are even impacted. I also like the Smartscape dependency graph, which gives a real-time map of how services, processes, and hosts connect, so when an application slows down, I can see exactly which upstream or downstream component is responsible. That combination of causal AI and live topology mapping makes it genuinely different from tools that just collect metrics and leave the diagnosis to you.
Dynatrace Key Features
- OneAgent deployment: A single agent installs on any host and automatically collects metrics, logs, traces, and topology data across your full stack without manual configuration.
- Log monitoring with Grail: Dynatrace's Grail data lakehouse ingests and stores logs in context with traces and metrics, so you can query across all data types without managing schemas or storage tiers.
- AutomationEngine: Connects with incident management and remediation tools to trigger auto-remediation workflows, automatic ticketing, and real-time CMDB updates when issues are detected.
- OpenPipeline: A high-performance stream processing layer that ingests, enriches, and contextualizes data from any source before it reaches storage or analytics.
Dynatrace Integrations
Dynatrace offers 650+ native integrations, including ServiceNow, AWS, Azure, Google Cloud Platform, Kubernetes, VMware, Red Hat OpenShift, Slack, PagerDuty, Jira, and Zapier. An API is available for custom integrations and automation.
Pros and Cons
Pros:
- A wide array of integrations
- Comprehensive application monitoring
- Deep AI-driven insights
Cons:
- The setup might be challenging for novices
- Complexity requires dedicated training

Sentry gives IT teams and developers real-time visibility into server-side errors and performance issues, helping you identify, diagnose, and resolve problems across distributed systems and cloud environments.
Who Is Sentry Best For?
Sentry is a strong fit for engineering and DevOps teams building and maintaining complex, multi-service applications who need deep visibility into errors and performance at the code level.
Why I Picked Sentry
I picked Sentry as one of the best because its distributed tracing goes deeper than most monitoring tools. Where other platforms show you that something is slow, Sentry's Trace Explorer lets you follow a single request across every service, database call, and API hop—so you can pinpoint the exact span causing a latency spike without jumping between tools. I also like how errors and traces are connected in the same view, meaning when a background job fails, I can see what triggered it upstream. Seer—Sentry's AI debugging agent—analyzes stack traces, logs, replays, and trace data together to automatically root-cause issues and even suggest a fix.
Sentry Key Features
- Real-time error monitoring: Captures and groups exceptions as they occur across your server-side applications, with full stack traces and contextual data attached to each issue.
- Performance monitoring: Tracks transaction throughput, latency percentiles, and slow database queries to surface bottlenecks in backend services.
- Session replay: Records user sessions so you can reproduce the exact conditions that led to a server-side error or crash.
- Custom alerting: Lets you configure threshold- or anomaly-based alerts on error rates, latency, and performance metrics across specific projects or environments.
Sentry Integrations
Sentry offers 100+ native integrations, including GitHub, GitLab, Jira, Slack, Trello, PagerDuty, Datadog, AWS, Azure DevOps, Google Cloud Platform, and Zapier. An API is available for custom integrations and automation with CI/CD workflows.
Pros and Cons
Pros:
- Strong error tracking with per-user exception tracking
- Comprehensive monitoring, including performance and crash reporting
- Effective frontend observability with session replay features
Cons:
- Less coverage for infrastructure-level monitoring
- Complex implementation especially for diverse platform stacks
New Product Updates from Sentry

Sentry Adds Log Export in CSV and JSONL
Sentry now supports exporting up to 10,000 log lines from Explore → Logs in CSV or JSON Lines, with downloads available in-browser or as background downloads and email. For more information, visit Sentry's official site.
 .
.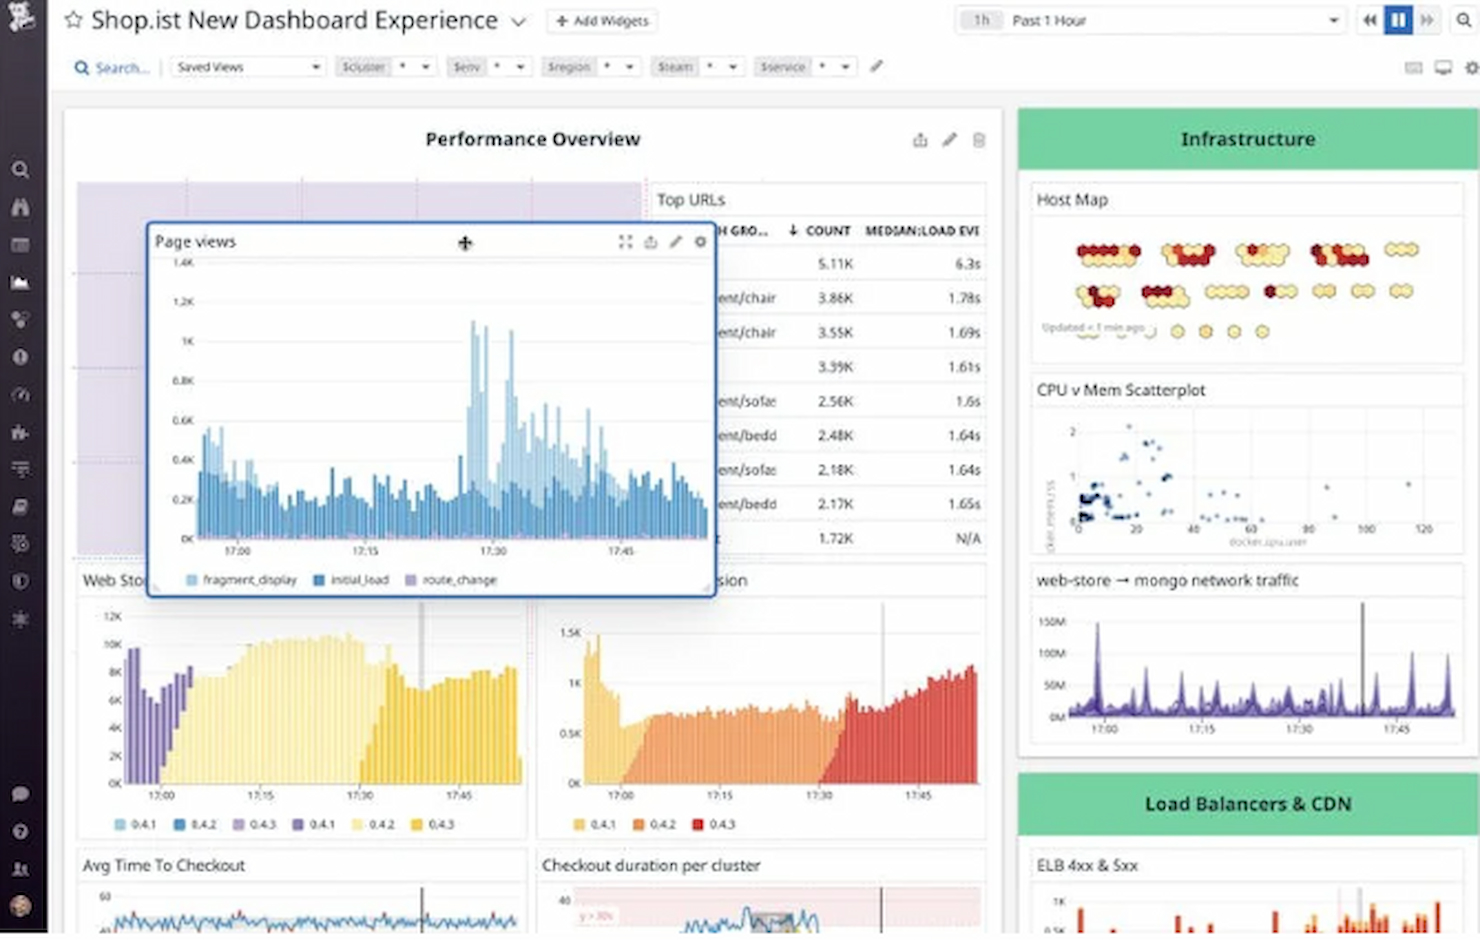
Datadog gives IT teams and DevOps professionals a unified platform to monitor server health, track performance metrics, and troubleshoot issues across complex cloud and hybrid environments.
Who Is Datadog Best For?
Datadog is a strong fit for mid-size to enterprise engineering teams running cloud-native or hybrid infrastructure at scale.
Why I Picked Datadog
Datadog earns its spot on my shortlist because of how well it handles monitoring at cloud scale, where the sheer volume of hosts, containers, and services makes most tools buckle. I like that it tracks tens of thousands of infrastructure metrics out of the box, with continuous historical records that persist even after infrastructure is decommissioned—something that's genuinely useful when you're doing post-incident analysis on ephemeral cloud resources. I also use the tag-based search and analytics to slice across multi-cloud environments without writing complex queries, which saves real time when you're managing hundreds of hosts across AWS, Azure, and GCP simultaneously. The AIOps-driven alert correlation is another feature I rely on heavily—it surfaces the signal from the noise instead of flooding on-call engineers with redundant alerts.
Datadog Key Features
- Live process monitoring: View real-time CPU, memory, and I/O consumption at the individual process level across all your hosts.
- Network performance monitoring: Track request volume, latency, and errors between services and infrastructure components across your environment.
- Log management: Collect, parse, and search logs from servers and services, with the ability to correlate them directly with metrics and traces.
- Custom dashboards: Build visualizations that combine metrics, logs, and traces from across your infrastructure into a single view.
Datadog Integrations
Datadog offers 600+ native integrations, including AWS, Azure, Google Cloud Platform, Kubernetes, Docker, Slack, PagerDuty, Jira, GitHub, ServiceNow, and Zapier. An API is available for custom integrations.
Pros and Cons
Pros:
- Extensive integrations list
- Comprehensive monitoring and alerting
- Tailored for cloud environments
Cons:
- Additional costs for extra features
- The learning curve for advanced features
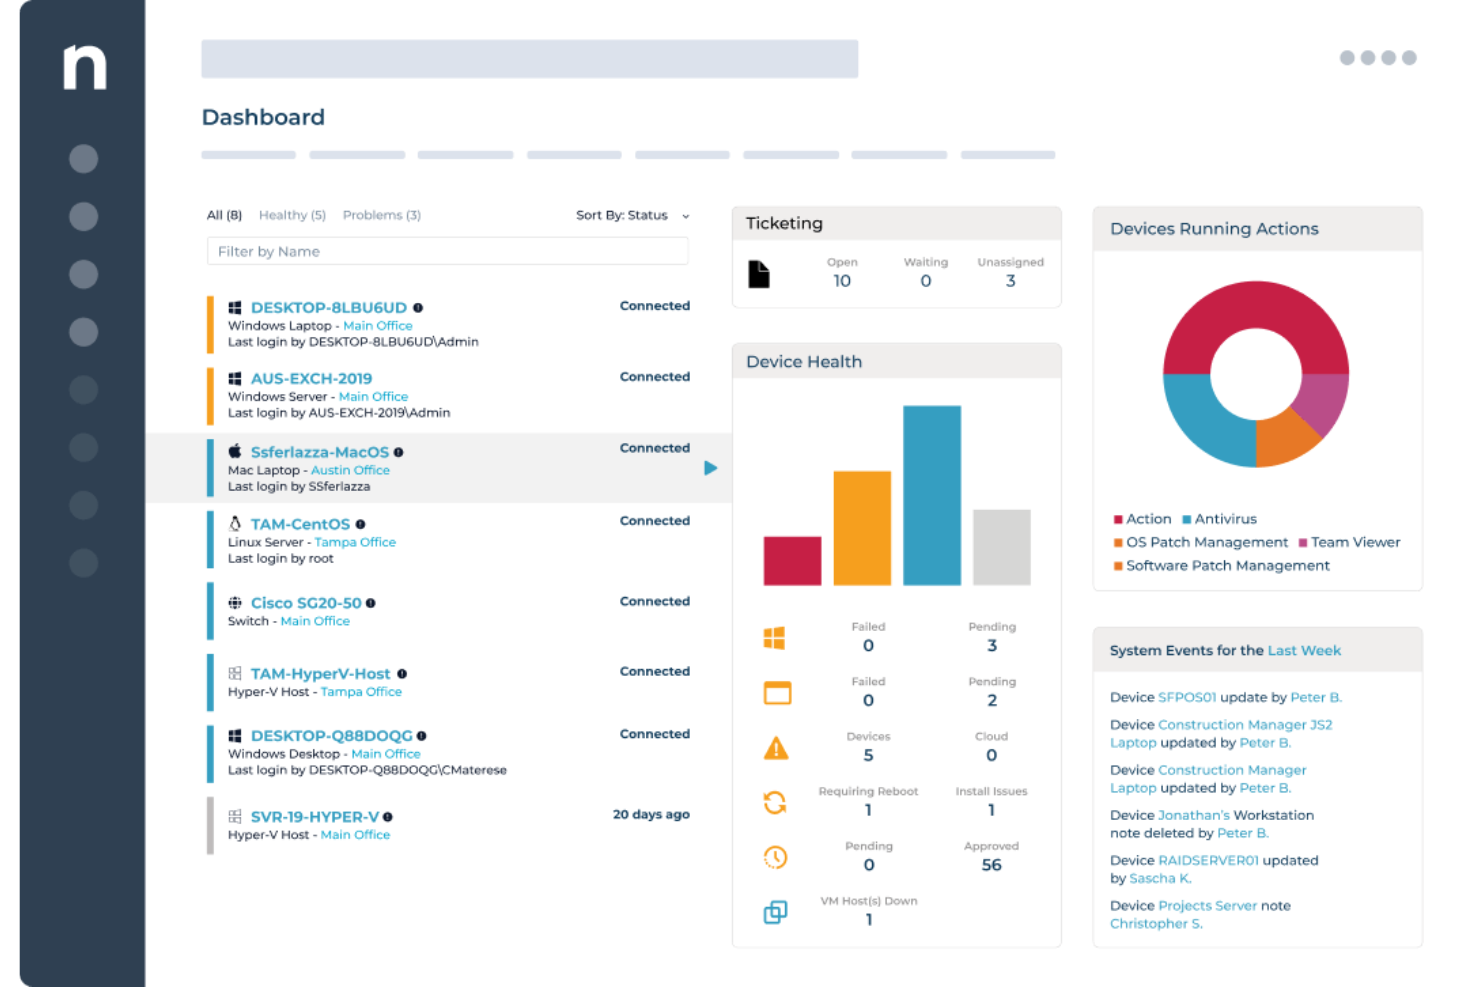
NinjaOne gives IT teams and managed service providers a unified platform to monitor servers, automate patching, and manage endpoints across distributed environments, helping reduce downtime and simplify infrastructure oversight.
Who Is NinjaOne Best For?
NinjaOne is a strong fit for MSPs and internal IT teams managing large fleets of servers and endpoints across multiple locations or client environments.
Why I Picked NinjaOne
I picked NinjaOne as one of the best because its patch management handles the full compliance lifecycle, not just deployment. The Patch Intelligence feature analyzes telemetry and deployment signals to automatically flag unstable updates and pause risky patches before they cause disruption. You can set device-role-based patching policies so servers running different workloads are patched on different schedules without manual intervention. Additionally, the patch compliance reporting gives a clear, on-demand view of what's been patched, what hasn't, and where vulnerabilities lie across every endpoint.
NinjaOne Key Features
- Real-time endpoint monitoring: View device health, configurations, and compliance status across all endpoints from a single cloud-native console.
- Automated endpoint remediation: Use condition-based scripting to detect and fix endpoint issues automatically without technician intervention.
- Software and OS deployment: Roll out Windows software, updates, and configurations across endpoints using repeatable, automation-driven workflows.
- Hardware and software inventory: Get a live view of every device in your environment, including hardware specs, installed software, and warranty status.
NinjaOne Integrations
NinjaOne offers native integrations with ConnectWise, Autotask, Zendesk, Webroot, Bitdefender, TeamViewer, Splashtop, Acronis, and the Microsoft ecosystem, including Microsoft 365 and Azure. An API is available for custom integrations.
Pros and Cons
Pros:
- Automated endpoint discovery
- Flexible reporting with custom metrics
- Comprehensive API documentation
Cons:
- Complexity in setting up alerts for non-standard events
- Occasional delays in patch deployment
New Product Updates from NinjaOne
NinjaOne Adds Windows Agent Deployment to Network Discovery
NinjaOne adds Windows agent deployment directly from Network Discovery. This update helps IT teams move from discovering unmanaged Windows devices to monitoring, patching, and managing them faster. For more information, visit NinjaOne’s official site.
 .
.Altri strumenti di monitoraggio dei server
Ecco alcune opzioni aggiuntive di strumenti di monitoraggio dei server che non sono entrate nella mia shortlist, ma che vale comunque la pena considerare:
- Nagios
For comprehensive IT infrastructure monitoring
- LogicMonitor
For hybrid infrastructure monitoring
- AppDynamics
For end-to-end business transaction tracking
- New Relic
For real-time application analytics
- Dotcom Monitor
For simulating real user interactions
- Sumo Logic
Good for log management and analysis
- Atera
Good for integrated RMM and PSA solution
- Zabbix
For scalability with large networks
- WhatsUp Gold
Good for network monitoring and visualization
- Netdata
Good for real-time performance troubleshooting
- Prometheus
For powerful query language capabilities
- Sensu
Good for flexible monitoring via plugins
- ManageEngine
For integrated IT management


How I Evaluate Server Monitoring Software
I evaluate server monitoring tools in two layers: baseline capabilities—like sub-minute polling and hybrid coverage—that qualify a tool, and differentiators that determine the best fit.
Core Functionality (Table Stakes For This List)
When I'm selecting tools for my list, I rank each one on a scale from 0 (does not offer the functionality) to 5 (excels in this area) for each core functionality listed below. Then, I calculate the tool's total score into a percentage. Each tool needs to achieve a minimum total score of 75% to be considered for inclusion.
- Real-Time Resource Monitoring: I check how granularly each tool tracks CPU, memory, disk I/O, and network throughput, and whether polling intervals are fast enough to catch brief spikes.
- Multi-OS & Environment Support: A tool should cover Windows, Linux, and Unix hosts across on-prem, virtual, and cloud environments so hybrid fleets don't require separate solutions.
- Alerting & Notification Options: I evaluate whether thresholds are customizable per metric and whether alerts route to channels teams actually use, like Slack, PagerDuty, or email.
- Uptime & Availability Checks: Consistent ping, HTTP, and TCP checks with downtime logging matter here, especially for teams tracking SLA commitments across customer-facing services.
- Historical Data & Reporting: I look at retention depth and whether dashboards support trend analysis for capacity planning, like spotting a disk volume that's been filling steadily over months.
- Agent & Agentless Collection: Flexible deployment options matter. Some environments can't run agents on legacy hosts, so support for SNMP, WMI, SSH, or API-based polling is important.
Once I have a list of tools that meet this criteria, I consider what sets each platform apart.
Differentiating Factors (What Sets Vendors Apart)
Here's how I compare and contrast different vendors:
Standout Features
Auto-discovery and dependency mapping save serious time when you're onboarding hundreds of servers. I look for tools that detect new hosts and visualize how services connect. Root cause analysis builds on that by correlating events across the stack, so you're fixing the actual problem instead of chasing symptoms during an outage. For teams running containerized workloads, native Kubernetes and Docker monitoring alongside traditional server metrics keeps everything in one place.
Beyond Features
Pricing structure matters a lot here. Per-host, per-metric, and data-ingestion models scale very differently, and surprise overages can hit hard when you're monitoring thousands of endpoints. I also evaluate integration depth with incident management and ITSM platforms like ServiceNow and PagerDuty, since monitoring data only helps if it feeds directly into your response workflows. Deployment flexibility is another factor I consider, especially for teams in regulated environments that need self-hosted options alongside cloud convenience.
Come scegliere gli strumenti di monitoraggio dei server
È facile lasciarsi sopraffare da lunghe liste di funzionalità e strutture di prezzi complesse. Per aiutarti a rimanere concentrato durante il tuo personale processo di selezione del software, ecco una checklist di fattori da tenere in considerazione:
| Fattore | Cosa Considerare |
| Scalabilità | Assicurati che lo strumento possa crescere insieme alla tua azienda. Cerca software di monitoraggio aziendale in grado di gestire un aumento di dati e utenti senza cali di prestazioni, specialmente se sei in fase di espansione. |
| Integrazioni | Verifica la compatibilità con i sistemi esistenti. Lo strumento dovrebbe integrarsi facilmente con l'attuale pila software, come AWS, Azure o Slack, per risparmiare tempo e fatica. |
| Personalizzazione | Scegli strumenti che permettono di personalizzare dashboard e report. In questo modo il tuo team riceve le informazioni specifiche di cui ha bisogno senza elementi inutili. |
| Facilità d'Uso | Valuta l'intuitività dell'interfaccia. Il tuo team dovrebbe poterla navigare senza difficoltà, riducendo la curva di apprendimento e velocizzando l'adozione. |
| Budget | Confronta i piani tariffari per rispettare i tuoi vincoli finanziari. Considera il costo totale, incluse eventuali spese nascoste o componenti aggiuntivi necessari, per evitare sforamenti di budget. |
| Tutele di Sicurezza | Dai priorità a strumenti con forti misure di sicurezza. Garantisci la cifratura dei dati, i controlli di accesso e la conformità agli standard di settore per proteggere le informazioni sensibili. |
| Affidabilità | Cerca garanzie comprovate di uptime. Uno strumento affidabile assicura un monitoraggio continuo senza frequenti interruzioni, mantenendo fluide le tue operazioni. |
| Opzioni di Supporto | Valuta la disponibilità e la qualità del supporto clienti. È fondamentale poter accedere a supporto 24/7, account manager dedicati e risorse di assistenza complete. |
Tendenze negli Strumenti di Monitoraggio Server
Nella mia ricerca, ho analizzato innumerevoli aggiornamenti di prodotto, comunicati stampa e log delle versioni dei diversi fornitori di strumenti di monitoraggio server. Ecco alcune delle tendenze emergenti che sto osservando:
- Approfondimenti guidati dall’AI: Molti strumenti ora utilizzano l’intelligenza artificiale per fornire analisi predittive, permettendo di anticipare i problemi prima che si verifichino. Questa tendenza rende il monitoraggio più proattivo, con fornitori alternativi a Nagios come Dynatrace che integrano l’AI per avvisi e diagnosi più intelligenti.
- Osservabilità Full-Stack: Gli utenti desiderano visibilità su tutto lo stack tecnologico, non solo sui server. Strumenti come New Relic si stanno espandendo per offrire informazioni approfondite su applicazioni, infrastrutture ed esperienze utente in un unico punto, per una visione olistica.
- Visualizzazione dati in tempo reale: Con la crescita dei dati, cresce la necessità di visualizzazione immediata. I fornitori stanno migliorando le dashboard per mostrare flussi di dati dal vivo, consentendo ai team di reagire istantaneamente ai cambiamenti dei loro ambienti.
- Monitoraggio Cloud-Native: Con sempre più aziende che migrano sul cloud, gli strumenti di monitoraggio si stanno evolvendo per supportare architetture native del cloud. Soluzioni come Datadog offrono funzionalità specifiche per ambienti cloud, garantendo compatibilità ed efficienza.
- Monitoraggio della sicurezza avanzato: La sicurezza è una preoccupazione crescente e gli strumenti offrono ora funzionalità di sicurezza potenziate. Le soluzioni di monitoraggio stanno integrando rilevamento delle minacce e controlli di conformità per proteggere i dati, rispondendo così alla domanda di sistemi più sicuri.
Cosa sono gli Strumenti di Monitoraggio Server?
Gli strumenti di monitoraggio server tracciano costantemente la salute e le prestazioni dei server—CPU, memoria, disco, I/O, processi, servizi e rete—così che i team IT e DevOps possano rilevare i problemi tempestivamente, risolvere gli incidenti più rapidamente e mantenere gli SLO in ambienti on-premise, cloud e ibridi.
Avvisi in tempo reale, metriche di prestazione e capacità di visualizzazione dati aiutano nel monitoraggio proattivo e nella risoluzione rapida dei problemi, similmente a come gli strumenti di monitoraggio dei siti web tracciano disponibilità e performance.
Funzionalità degli Strumenti di Monitoraggio Server
Quando selezioni strumenti di monitoraggio server, presta attenzione alle seguenti caratteristiche chiave:
- Monitoraggio in tempo reale: Ricevi aggiornamenti istantanei sullo stato di salute e sulle prestazioni del tuo server. Il monitoraggio in tempo reale ti consente di individuare i problemi mentre si verificano, così puoi intervenire e risolverli prima che diventino criticità maggiori.
- Avvisi automatici: Ricevi notifiche via email, SMS o avvisi nel dashboard quando i tuoi server raggiungono soglie impostate per CPU, memoria, spazio su disco o altre metriche. Non dovrai sorvegliare manualmente i tuoi server; il sistema ti avviserà quando sarà il momento di intervenire.
- Tracciamento dell'utilizzo delle risorse: Monitora statistiche dettagliate come l’utilizzo della CPU, il consumo di memoria, l’attività del disco e il traffico di rete su tutti i tuoi server. Questo ti aiuta a prendere decisioni più intelligenti su aggiornamenti, scalabilità o bilanciamento del carico.
- Dati storici e report: Accedi a log e report che tracciano le prestazioni del server nel tempo. L’analisi delle tendenze storiche ti aiuta a identificare problemi ricorrenti o periodi in cui potrebbe essere necessario potenziare i server.
- Dashboard personalizzabili: Personalizza il tuo dashboard di monitoraggio per mostrare le informazioni più rilevanti per te. I widget drag-and-drop ti permettono di visualizzare le metriche chiave e avere una panoramica immediata che si adatta al tuo flusso di lavoro.
- Monitoraggio di processi e servizi: Tieni sotto controllo processi o servizi specifici in esecuzione sui tuoi server. Saprai immediatamente se un’attività fondamentale smette di funzionare, così potrai ripristinare tutto rapidamente.
- Supporto multipiattaforma: Monitora server indipendentemente dal sistema operativo—che sia Windows, Linux o macOS. Puoi gestire ambienti misti senza dover cambiare strumenti.
- Integrazione con sistemi di notifica: Collega il tuo strumento di monitoraggio ad app di collaborazione come Slack o a sistemi di ticketing. Questo ti fa risparmiare email inutili e aiuta il tuo team ad agire rapidamente quando qualcosa richiede attenzione.
- Sicurezza e controlli di accesso: Controlla chi può visualizzare o modificare le configurazioni di monitoraggio. Funzionalità di sicurezza avanzate aiutano a prevenire modifiche non autorizzate e a proteggere le informazioni sensibili del server.
- Scalabilità: Aggiungi facilmente nuovi server e servizi man mano che la tua azienda cresce. In questo modo la tua soluzione di monitoraggio si espande insieme alle tue esigenze senza perdere colpi.
Funzionalità comuni di intelligenza artificiale per gli strumenti di monitoraggio dei server
Gli strumenti moderni di monitoraggio dei server spesso sfruttano l'intelligenza artificiale per migliorare le prestazioni e semplificare la gestione. Ecco alcune comuni funzionalità alimentate dall’IA da tenere d’occhio:
- Rilevamento delle anomalie: Gli algoritmi di intelligenza artificiale identificano automaticamente schemi insoliti o deviazioni nelle prestazioni del server, aiutandoti a individuare i problemi prima che peggiorino.
- Analisi predittiva: I modelli di machine learning prevedono potenziali guasti del server o carenze di risorse, permettendoti di agire preventivamente e ridurre i tempi di inattività.
- Analisi automatica della causa principale: L’IA individua rapidamente l’origine dei problemi di prestazioni, riducendo il tempo e lo sforzo necessari per la risoluzione dei problemi.
- Avvisi intelligenti: Sistemi intelligenti riducono i falsi positivi apprendendo il comportamento normale del tuo server e notificandoti solo quando qualcosa richiede davvero attenzione.
- Pianificazione della capacità: L’IA analizza le tendenze di utilizzo per raccomandare l'allocazione ottimale delle risorse e le strategie di scaling, assicurando che i tuoi server possano soddisfare le esigenze future.
- Automazione auto-riparativa: Alcuni strumenti utilizzano l’IA per risolvere automaticamente problemi comuni—come il riavvio dei servizi o la riallocazione delle risorse—senza intervento umano.
- Soglie di monitoraggio adattive: L'IA regola dinamicamente le soglie degli avvisi in base ai dati storici e ai modelli di utilizzo, mantenendo rilevanti le notifiche mentre l’ambiente evolve.
Vantaggi
L’implementazione di strumenti di monitoraggio dei server offre diversi vantaggi per il tuo team e per la tua azienda. Eccone alcuni a cui puoi guardare con fiducia:
- Risoluzione proattiva dei problemi: Avvisi in tempo reale e analisi predittiva consentono al tuo team di affrontare le problematiche prima che si aggravino, riducendo i tempi di inattività.
- Prestazioni ottimizzate: Il monitoraggio delle metriche di prestazione aiuta a mantenere le operazioni dei server al massimo dell’efficienza.
- Decisioni più informate: Dashboard personalizzabili e report automatici offrono spunti che guidano le scelte strategiche del tuo team.
- Sicurezza aumentata: Le funzionalità di monitoraggio della sicurezza individuano minacce e garantiscono la conformità, proteggendo i tuoi dati da eventuali violazioni.
- Supporto alla scalabilità: Gli strumenti progettati per la scalabilità crescono insieme alla tua azienda, gestendo senza problemi l’aumento di dati e utenti.
- Visibilità completa: L’osservabilità full-stack offre al tuo team una visione completa dell’infrastruttura, potenziando le capacità di monitoraggio.
Costi e prezzi
La scelta degli strumenti per il monitoraggio dei server richiede la comprensione dei diversi modelli e piani tariffari disponibili. I costi variano in base alle funzionalità, alla dimensione del team, ai componenti aggiuntivi e ad altri fattori. La tabella seguente riassume i piani più comuni, i relativi prezzi medi e le principali caratteristiche incluse nelle soluzioni di monitoraggio dei server:
Tabella di Confronto dei Piani per Strumenti di Monitoraggio Server
| Tipo di Piano | Prezzo Medio | Funzionalità Comuni |
| Piano Gratuito | $0 | Monitoraggio di base, dashboard limitate e avvisi standard. |
| Piano Personale | $5-$25/user/month | Metrica delle prestazioni, dashboard personalizzabili e reportistica di base. |
| Piano Business | $30-$75/user/month | Analisi avanzate, avvisi in tempo reale e capacità di integrazione. |
| Piano Enterprise | $100-$300/user/month | Osservabilità a livello completo, analisi predittive e supporto dedicato. |
Domande frequenti sugli strumenti di monitoraggio dei server
Ecco alcune risposte alle domande più comuni sugli strumenti di monitoraggio dei server:
Perché il monitoraggio dell'inventario è importante nella sicurezza informatica?
Il monitoraggio dell’inventario è fondamentale per la sicurezza informatica perché consente di identificare, monitorare e gestire ogni dispositivo e risorsa software nell’ambiente IT. Con un inventario completo, puoi individuare dispositivi non autorizzati, tracciare le vulnerabilità e assicurarti che il software sia sempre conforme alle normative. Un monitoraggio accurato aiuta a ridurre le violazioni dei dati evidenziando lacune nella sicurezza o nella gestione delle patch e fornisce una panoramica chiara per audit e risposta agli incidenti.
In che modo il software di gestione dell'inventario IT aiuta durante gli audit di conformità?
Il software di gestione dell’inventario IT supporta gli audit di conformità mantenendo registri accurati di tutte le risorse hardware e software. Puoi generare rapidamente report, tracciare la cronologia delle risorse e dimostrare dettagli su licenze o configurazioni quando richiesto. La documentazione automatica e i log delle modifiche ti aiutano a essere sempre pronto per gli audit, riducendo la necessità di gestione manuale e semplificando i controlli normativi.
Quali integrazioni dovrei cercare negli strumenti di gestione dell'inventario IT?
Cerca strumenti di inventario IT che si integrino con i tuoi sistemi esistenti come software di help desk, database di gestione delle configurazioni (CMDB), software per application server e soluzioni di gestione degli endpoint. Le integrazioni con strumenti di sicurezza, servizi di directory e fornitori di cloud ottimizzano i flussi di lavoro e assicurano che i dati dell’inventario restino aggiornati in tutto il tuo stack IT. Gli strumenti di monitoraggio dei server tracciano continuamente lo stato di salute e le prestazioni dei server—CPU, memoria, disco, I/O, processi, servizi e rete—così i team IT e DevOps possono rilevare problemi in anticipo, risolvere gli incidenti più rapidamente e mantenere gli SLO su ambienti on-premise, cloud e ibridi.
In che modo questi strumenti supportano ambienti di lavoro da remoto o ibridi?
La maggior parte delle piattaforme moderne di gestione inventario IT offre accesso cloud, installazione di agenti da remoto e sincronizzazione in tempo reale. Puoi monitorare i dispositivi ovunque — sia a casa che in diversi uffici — monitorare l’hardware assegnato ai lavoratori remoti e automatizzare gli aggiornamenti. In questo modo si riducono i punti ciechi e si può intervenire più rapidamente sui problemi, ovunque si trovi il tuo team.
Quali funzionalità aiutano a ridurre la perdita di hardware o il furto di dispositivi?
Molti strumenti di gestione dell’inventario IT offrono etichettatura delle risorse, geolocalizzazione, registri di check-in/check-out e avvisi per attività sospette. Queste funzionalità ti consentono di tracciare l’assegnazione dei dispositivi, registrare i movimenti e recuperare più velocemente l’hardware perso. Puoi anche impostare promemoria automatici per la restituzione o la manutenzione dei dispositivi, riducendo al minimo il rischio di perdita o furto.
Come funziona la rilevazione automatica delle risorse nelle piattaforme moderne di gestione inventario?
La rilevazione automatica delle risorse esegue scansioni della rete per trovare tutti i dispositivi collegati e i software installati. Il sistema aggiorna continuamente il tuo inventario, rileva nuove risorse o dispositivi non autorizzati e ti aiuta a mantenere un database delle risorse accurato. Questo ti fa risparmiare tempo, aumenta la sicurezza e riduce gli errori derivanti dal monitoraggio manuale.
Cosa succede ora
Se stai cercando un software per il monitoraggio dei server, contatta un consulente SoftwareSelect per ricevere consigli gratuiti.
Compila un modulo e programma una chiamata per condividere le tue esigenze specifiche. Riceverai una shortlist di software da valutare e supporto durante tutto il processo di acquisto, incluse le trattative sul prezzo.