Le 10 migliori soluzioni per il monitoraggio dei sistemi recensite nel 2026

10 La Migliore Shortlist di Strumenti di Monitoraggio del Sistema


Gli strumenti di monitoraggio del sistema ti aiutano a tenere sotto controllo la salute e le prestazioni della tua infrastruttura, così puoi individuare e risolvere i problemi prima che abbiano un impatto sugli utenti.
Molti team si affidano a questi strumenti quando si trovano ad affrontare interruzioni impreviste, sistemi lenti o una visibilità limitata sull'attività di rete. Senza la soluzione giusta, è difficile capire cosa non va o persino dove cercare.
Ho lavorato con team SaaS e MSP per valutare e implementare piattaforme di monitoraggio in grado di ridurre i tempi di inattività e velocizzare i tempi di risposta. Questa guida raccoglie ciò che ho imparato per aiutarti a trovare uno strumento adatto al tuo sistema e al tuo flusso di lavoro.
Table of Contents
- I migliori strumenti – Sintesi
- Perché fidarsi di noi
- Confronto specifiche
- Recensioni
- Altri strumenti per il monitoraggio dei sistemi
- Recensioni correlate
- Criteri di selezione
- Come scegliere
- Cosa sono gli strumenti per il monitoraggio dei sistemi?
- Funzionalità
- Vantaggi
- Costi e prezzi
- Domande frequenti
Perché Fidarti delle Nostre Recensioni Software
Testiamo e recensiamo software dal 2023. Come leader tecnologici, sappiamo quanto sia cruciale e difficile prendere la decisione giusta nella scelta di un software.
Investiamo in una ricerca approfondita per aiutare il nostro pubblico a effettuare scelte migliori di acquisto software. Abbiamo testato oltre 2.000 strumenti per diversi casi d’uso tecnologici e scritto più di 1.000 recensioni complete. Scopri come restiamo trasparenti e la nostra metodologia di recensione del software.
Riepilogo Dei Migliori Strumenti di Monitoraggio del Sistema
Questa tabella comparativa riassume i dettagli dei prezzi delle mie migliori scelte di strumenti di monitoraggio del sistema per aiutarti a trovare quello più adatto al tuo budget e alle esigenze della tua azienda.
| Tool | Best For | Trial Info | Price | ||
|---|---|---|---|---|---|
| 1 | Ideale per il monitoraggio e la gestione remota | Prova gratuita di 30 giorni + demo gratuita disponibile | Da $129/tecnico/mese (fatturato annualmente) | Website | |
| 2 | Il migliore con gestione integrata degli asset IT | Prova gratuita di 14 giorni + demo gratuita disponibile | Da $19/agente/mese (fatturazione annuale) | Website | |
| 3 | Migliore soluzione open-source | Piano gratuito disponibile | Prezzo su richiesta | Website | |
| 4 | Ideale per il monitoraggio degli errori in tempo reale | No | A partire da $26/mese (fatturato annualmente) | Website | |
| 5 | Ideale per il monitoraggio di reti distribuite | Demo gratuita disponibile | Da $245/25 dispositivi | Website | |
| 6 | Ideale per il monitoraggio semplice e centralizzato dei sistemi | Prova gratuita di 30 giorni | A partire da $179/mese (fatturazione annuale) | Website | |
| 7 | Ideale per un monitoraggio full-stack guidato dall’intelligenza artificiale | No | Prezzi su richiesta | Website | |
| 8 | Ideale per le metriche delle prestazioni applicative | No | Da $15/host/mese (fatturazione annuale) | Website | |
| 9 | Ideale per il monitoraggio dell’infrastruttura full-stack | Prova gratuita di 30 giorni + demo gratuita disponibile | A partire da $10/mese (fatturazione annuale) | Website | |
| 10 | Ideale per soluzioni di monitoraggio scalabili | No | Open-source | Website |


-

TestDevLab
Visit Website -
Site24x7
Visit WebsiteThis is an aggregated rating for this tool including ratings from Crozdesk users and ratings from other sites.4.7 -
GitHub Actions
Visit WebsiteThis is an aggregated rating for this tool including ratings from Crozdesk users and ratings from other sites.4.8


Recensioni dei Migliori Strumenti di Monitoraggio del Sistema
Di seguito troverai i miei riepiloghi dettagliati dei migliori strumenti di monitoraggio del sistema che sono entrati nella mia shortlist. Le mie recensioni offrono uno sguardo approfondito alle caratteristiche principali, ai pro e contro, alle integrazioni e ai casi d’uso ideali di ciascuno strumento per aiutarti a trovare quello più adatto a te.
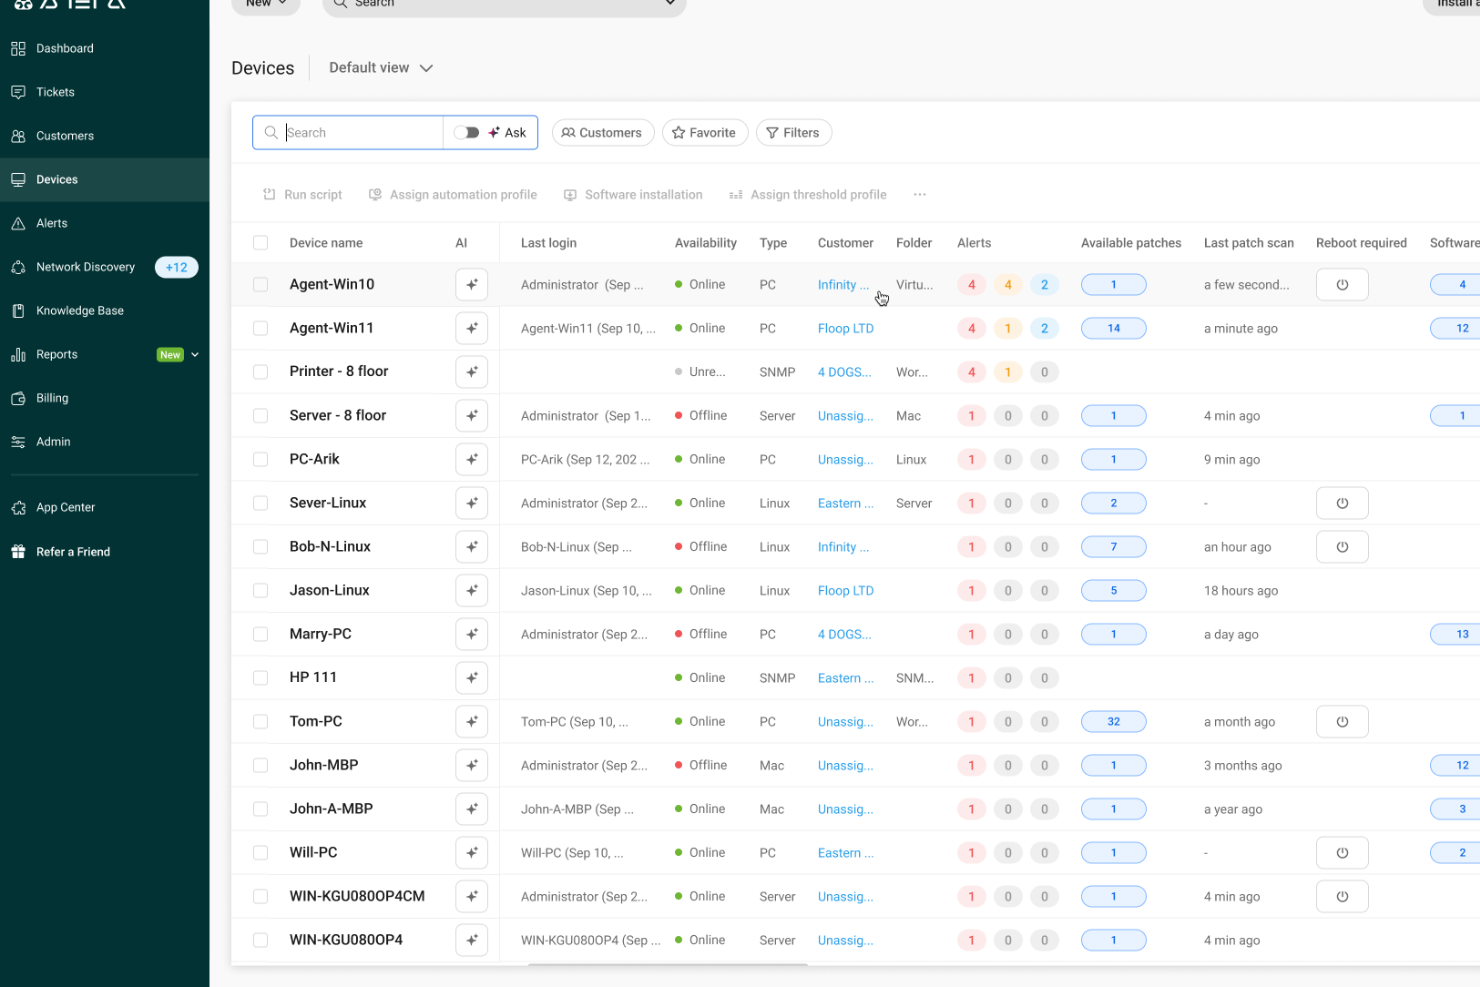
Atera è una piattaforma di gestione IT tutto-in-uno progettata per i provider di servizi gestiti (MSP) e i dipartimenti IT che devono monitorare, gestire e supportare endpoint e reti da un'unica dashboard.
Per chi è meglio Atera?
Atera è particolarmente adatto a MSP e team IT interni che gestiscono molteplici endpoint in ambienti distribuiti.
Perché ho scelto Atera
Ho scelto Atera come uno dei migliori strumenti per il monitoraggio e la gestione remota perché il suo agente RMM fornisce visibilità in tempo reale su endpoint distribuiti. L’agente monitora continuamente CPU, RAM, utilizzo del disco, larghezza di banda di rete ed eventi di Windows, attivandosi online in circa 1,2 secondi, riducendo il ritardo quando un dispositivo necessita attenzione. La gestione degli avvisi di Atera consente di impostare soglie personalizzate e ricevere notifiche istantanee prima che i problemi impattino gli utenti, offrendo un approccio proattivo nella gestione dei dispositivi su più sedi. Le opzioni di accesso remoto integrate—Splashtop, AnyDesk, TeamViewer e ScreenConnect—permettono al mio team di avviare sessioni remote senza dover passare da uno strumento all'altro.
Caratteristiche principali di Atera
- Automazione IT: Pianifica ed esegui script automatici sui dispositivi per attività come onboarding, distribuzione software e manutenzione ordinaria.
- Monitoraggio SNMP: Monitora router, firewall, stampanti e altri dispositivi di rete tramite monitoraggio automatico degli OID su sistemi basati su Linux.
- Gestione delle patch: Automatizza le patch software Windows, macOS e Linux su tutti gli endpoint gestiti da un'unica dashboard.
- AI Copilot: Ricevi riepiloghi dei problemi generati dall’AI e risoluzioni suggerite per passare più rapidamente dall’avviso alla soluzione durante incidenti attivi.
Integrazioni di Atera
Le integrazioni includono Splashtop, TeamViewer, AnyDesk, ScreenConnect, Webroot, Bitdefender, Acronis, QuickBooks, Xero e Domotz.
Pros and Cons
Pros:
- Avvisi per soglie critiche e strumenti di manutenzione remota riducono i tempi di risposta agli incidenti dei dispositivi.
- L’inventario integrato di asset e software offre visibilità sulle distribuzioni hardware e software.
- Consolida la gestione IT in un’unica piattaforma, semplificando le operazioni.
Cons:
- Gestione progetti e monitoraggio SLA complessi relativamente limitati.
- Controllo meno dettagliato per workflow o integrazioni personalizzate molto complesse.
New Product Updates from Atera

Atera Adds Multiple API Tokens With Access Controls
Atera now supports multiple API tokens with configurable expiration dates, IP restrictions, and permission scopes, giving teams tighter control and safer delegation of API access. For more information, visit Atera's official site.

Freshservice è una piattaforma di gestione dei servizi IT che supporta anche il monitoraggio dei sistemi tramite le sue funzionalità ITOM. Non è uno strumento di monitoraggio dedicato, ma funziona bene per i team che desiderano centralizzare avvisi, stato dei servizi, dati sugli asset e flussi di lavoro degli incidenti in un'unica soluzione. Invece di focalizzarsi su metriche infrastrutturali avanzate, aiuta i team a comprendere il significato di un avviso nel contesto dei loro servizi e sistemi.
Per chi è indicato Freshservice?
Freshservice è adatto ai team IT di organizzazioni di medie e grandi dimensioni che già utilizzano un service desk e vogliono collegare i segnali di monitoraggio con la gestione degli incidenti, il tracciamento degli asset e i flussi di lavoro delle modifiche. È particolarmente utile per i team che gestiscono servizi IT interni o ambienti distribuiti dove comprendere l’impatto è importante tanto quanto rilevare i problemi.
Perché ho scelto Freshservice
Ho scelto Freshservice perché aggiunge un contesto utile ai dati di monitoraggio quando arriva un avviso. La possibilità di collegare gli incidenti ad asset specifici e vedere come questi asset si relazionano ad altri sistemi tramite la CMDB facilita la comprensione di cosa è effettivamente coinvolto e consente di rispondere in modo appropriato. È una soluzione ideale per i team che devono coordinare la risposta, non solo rilevare i problemi.
Funzionalità principali di Freshservice
- Avvisi automatici: Ricevi notifiche in tempo reale per incidenti ed eventi di sistema.
- Dashboard personalizzabili: Crea dashboard visive per monitorare le metriche principali e lo stato dei sistemi.
- Gestione delle richieste di servizio: Tieni traccia e gestisci le richieste di servizio IT da un'unica interfaccia.
- Modulo di gestione dei cambiamenti: Pianifica, approva e documenta le modifiche all'ambiente IT.
Integrazioni Freshservice
Freshservice offre integrazioni native con Microsoft Teams, SecPod, Slack, TeamViewer, Jira e Azure AD. Sono disponibili app connettore e API per integrazioni personalizzate e automazione dei flussi di lavoro.
Pros and Cons
Pros:
- CMDB e tracciamento asset più solidi rispetto alla maggior parte degli strumenti di monitoraggio
- Utile per team che vogliono il monitoraggio integrato nei flussi ITSM
- Collega avvisi con incidenti, asset e contesto di servizio
Cons:
- Si basa sulle integrazioni per la maggior parte della raccolta dati di monitoraggio
- Non è una piattaforma di monitoraggio completa per log, tracce o metriche infrastrutturali avanzate
New Product Updates from Freshservice
 Experience)
Freshservice Introduces a Reimagined IT Asset Management (ITAM) Experience
Freshservice introduces a reimagined IT Asset Management (ITAM) experience with continuous infrastructure discovery, dependency mapping, IPAM, and Software License Management. This update helps teams improve asset visibility and manage connected IT environments more effectively. For more information, visit Freshservice’s official site.
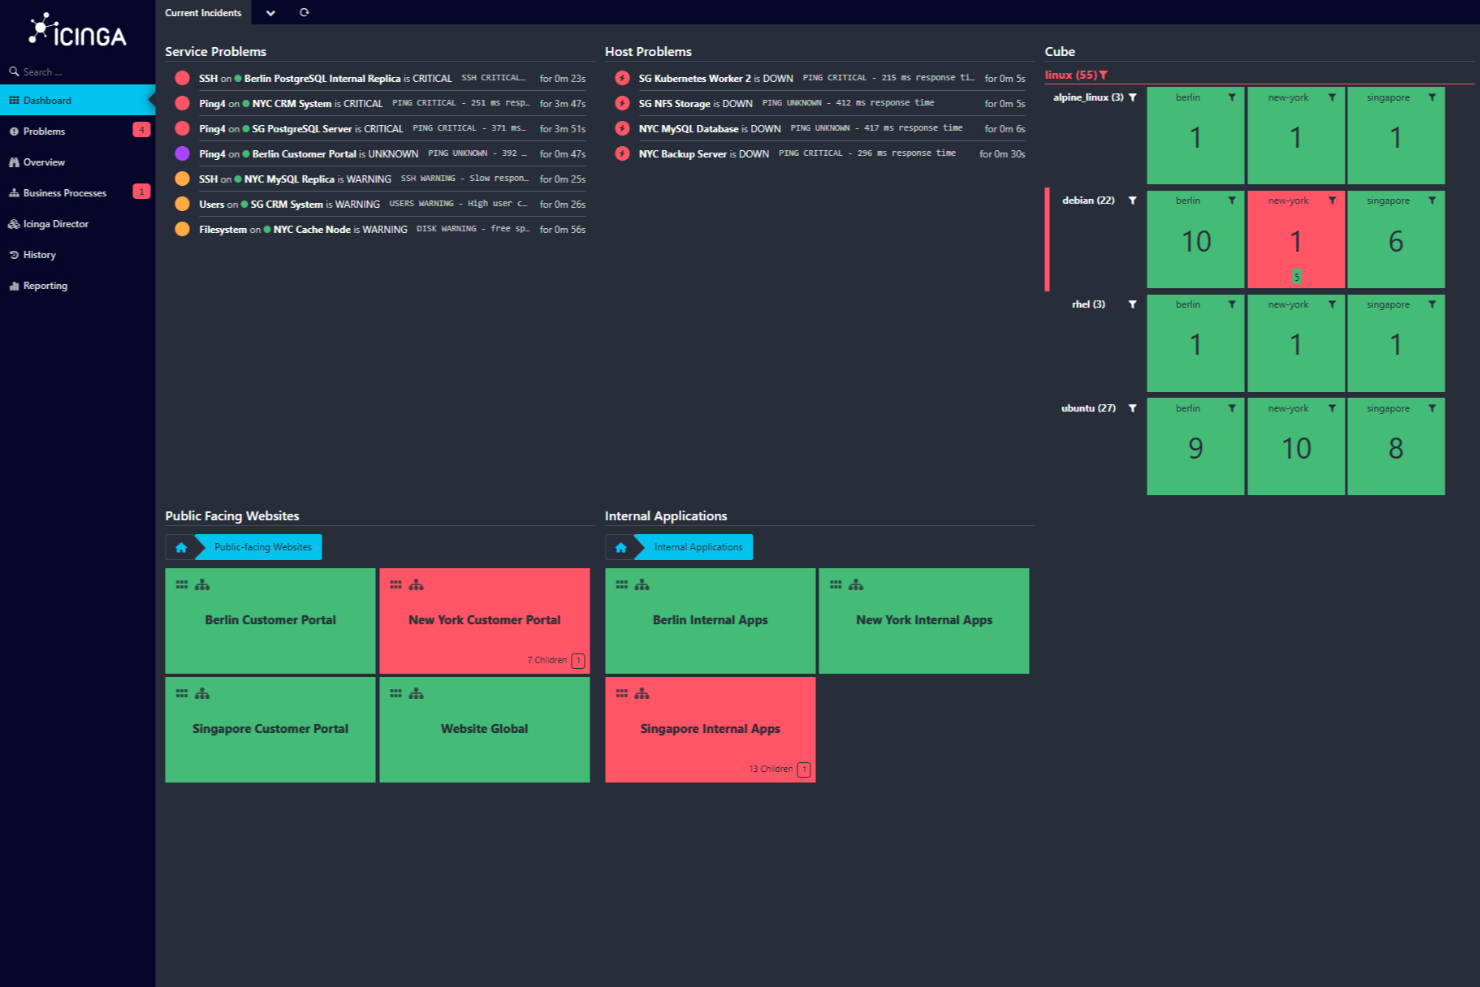
Icinga è una soluzione di monitoraggio open-source progettata per ambienti IT complessi. Offre uno stack di monitoraggio completo che copre l'infrastruttura, il cloud e l'applicazione, rendendolo una scelta versatile per aziende di diversi settori.
Perché ho scelto Icinga: Ho scelto Icinga per le sue funzionalità di automazione della configurazione pensate per il monitoraggio dei sistemi. Con il tracciamento delle configurazioni versionate e la possibilità di annullare le modifiche, il tuo team può testare i cambiamenti in sicurezza, sapere chi ha modificato cosa e tornare indietro se necessario—perfetto per gestire installazioni complesse. Inoltre, il director di Icinga automatizza la creazione di oggetti host e di servizio importando dati da inventari o da CMDB, assicurando che i tuoi controlli siano sempre aggiornati.
Offre anche supporto per ambienti cloud—privati, pubblici o ibridi. Moduli dedicati si collegano a vSphere, AWS, Azure, GCP e OpenStack, così i tuoi agenti funzionano sempre allo stesso modo ovunque siano distribuiti.
Funzionalità e integrazioni principali:
Altre funzionalità includono la gestione integrata di log e metriche tramite moduli come icingabeat, elasticsearch, logstash e graphite writers, per integrare i contesti dei log e dei dati di performance nelle dashboard di monitoraggio. Offre anche dashboard personalizzabili con editor di filtri e widget per concentrarsi su specifici contesti e tendenze.
Alcune delle integrazioni di Icinga includono Grafana, AWS, Azure, Puppet, Ansible, Chef, Terraform, Jira, PagerDuty, ServiceNow, BigPanda e Stackstorm.
Pros and Cons
Pros:
- Altamente personalizzabile per le esigenze di infrastrutture IT diverse
- Scalabile sia per piccoli che per grandi ambienti
- Gratuito, senza costi di configurazione
Cons:
- Installazione e configurazione presentano una certa curva di apprendimento
- Segnalati occasionali problemi di performance in scenari ad alto carico
New Product Updates from Icinga
Icinga Adds OpenTelemetry Support
Icinga introduces OpenTelemetry metrics support, HTTP response streaming, and key system updates. These improvements enhance performance, scalability, and integration with modern monitoring tools. For more information, visit Icinga’s official site.
 .
.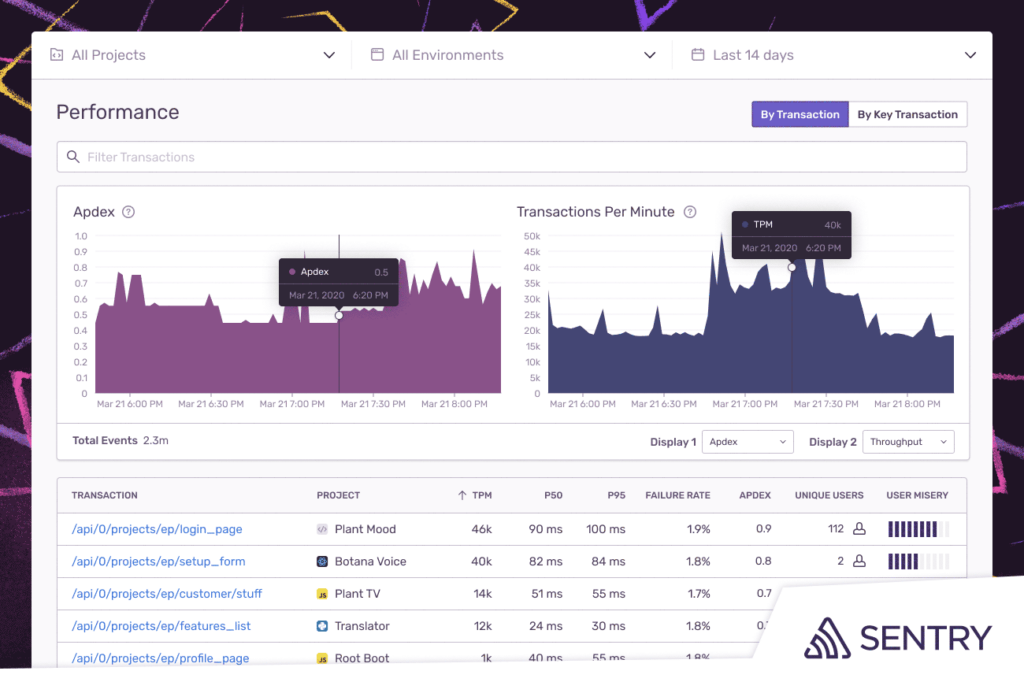
Sentry consente a sviluppatori e team IT di monitorare, diagnosticare e risolvere errori e problemi di prestazioni delle applicazioni su sistemi web, mobile e backend, aiutandoti a individuare i problemi prima che impattino sugli utenti.
Per chi è più indicato Sentry?
Sentry è particolarmente adatto a team di sviluppo software e DevOps che necessitano di una visibilità approfondita sulla salute delle applicazioni attraverso diversi ambienti e codebase.
Perché ho scelto Sentry
Ho scelto Sentry tra i migliori per il modo in cui gestisce il monitoraggio degli errori in tempo reale con il vero contesto, e non solo con semplici dati di log. Quando si verifica un errore in produzione, Sentry cattura l’intera stack trace, variabili locali, breadcrumbs e azioni dell’utente che hanno portato al crash—così il mio team non deve indovinare cosa sia successo. Mi piace anche il monitoraggio dello stato delle release, che tiene traccia in tempo reale delle sessioni senza crash e dell’adozione delle versioni, così puoi individuare subito quando un nuovo deploy inizia a peggiorare. Seer, l’agente di debug AI di Sentry, analizza stack trace, log e cronologia dei commit per individuare automaticamente le cause principali e suggerire correzioni—riducendo il tempo tra 'qualcosa si è rotto' e 'ecco perché'.
Funzionalità principali di Sentry
- Tracing distribuito: Segui una singola richiesta attraverso più servizi con viste a cascata che individuano esattamente dove vengono introdotti latenze o errori.
- Metriche personalizzate e monitoraggio degli span: Definisci e monitora indicatori di prestazione specifici della tua app, come query lente al database o chiamate API non reattive, fino al livello del codice.
- Priorità dell’impatto sull’utente: Evidenzia automaticamente i problemi che interessano il maggior numero di utenti affinché il tuo team possa decidere a cosa dare priorità nella risoluzione.
- Correlazione distribuita dei log: Collega i log direttamente alle tracce e ai problemi specifici che causano cali di prestazioni, eliminando la necessità di ricerche manuali tra i log.
Integrazioni Sentry
Le integrazioni includono GitHub, Jira, Slack, GitLab, Microsoft Teams, PagerDuty, Bitbucket, Discord, Asana e Datadog.
Pros and Cons
Pros:
- Stack trace dettagliate offrono la localizzazione precisa degli errori
- I dati contestuali aiutano a replicare e risolvere i problemi
- Si integra con molti strumenti di sviluppo e comunicazione popolari
Cons:
- Può risultare opprimente per i principianti a causa delle sue numerose funzionalità
- I team più numerosi potrebbero dover fare l’upgrade per gestire più eventi
- Alcuni utenti vorrebbero opzioni di allerta più flessibili
New Product Updates from Sentry

Sentry Adds Log Export in CSV and JSONL
Sentry now supports exporting up to 10,000 log lines from Explore → Logs in CSV or JSON Lines, with downloads available in-browser or as background downloads and email. For more information, visit Sentry's official site.
 .
.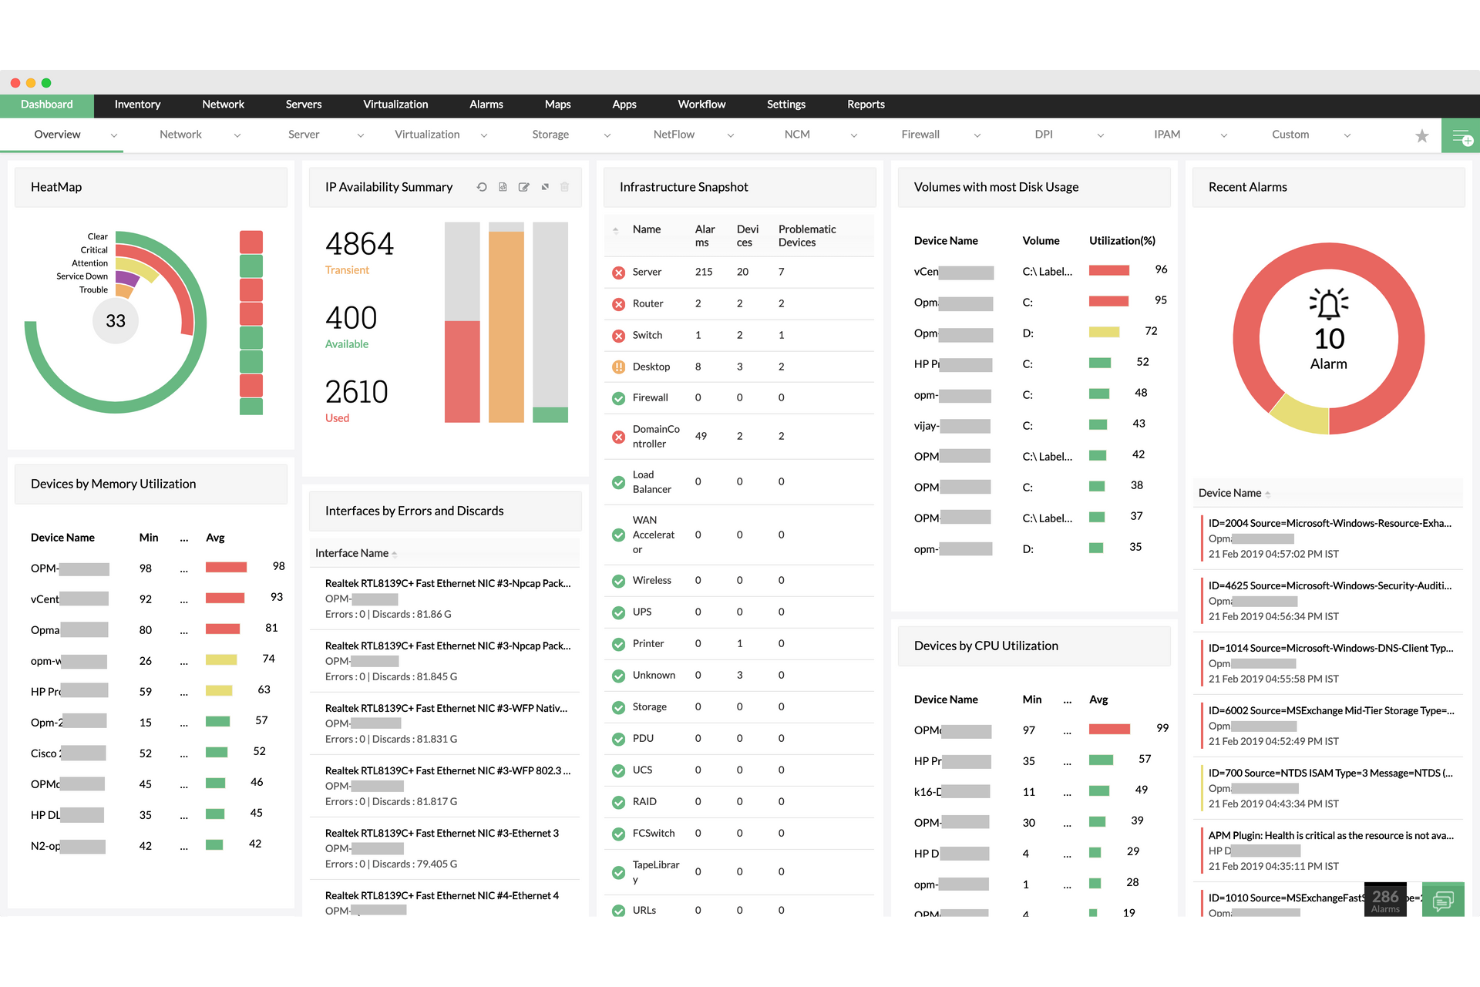
ManageEngine OpManager offre ai team IT e agli amministratori di rete una piattaforma unificata per monitorare dispositivi di rete, server e infrastrutture critiche, aiutando le organizzazioni a rilevare e risolvere rapidamente i problemi di prestazioni in ambienti complessi.
Per chi è consigliato ManageEngine OpManager?
ManageEngine OpManager è particolarmente indicato per medie e grandi imprese che necessitano di una visibilità centralizzata su più sedi, filiali o infrastrutture di rete distribuite geograficamente.
Perché ho scelto ManageEngine OpManager
Ho scelto ManageEngine OpManager tra i migliori per la sua architettura probe-centralizzata, che gestisce in modo eccellente il monitoraggio distribuito della rete su larga scala. Quando si gestiscono infrastrutture su più filiali o data center, OpManager distribuisce probe in ogni sito remoto che si occupano della rilevazione locale, della mappatura e del monitoraggio dei guasti—restituendo poi tutto a un'unica dashboard centrale. Mi piace il fatto che il server centrale offra una visibilità completa sulla salute dei dispositivi, sull'utilizzo di CPU, memoria e disco per ogni probe senza dover accedere separatamente a ogni sito. Inoltre, eventuali modifiche di configurazione o aggiornamenti di policy inviati dal server centrale vengono propagati automaticamente a tutte le probe collegate, riducendo i problemi di drift di configurazione che spesso complicano ambienti multisede.
Funzionalità principali di ManageEngine OpManager
- Mappatura di rete: Genera automaticamente mappe topologiche L1/L2 per visualizzare le relazioni tra i dispositivi e individuare l'origine di interruzioni o degradi delle prestazioni.
- Soglie adattive: Utilizza il machine learning per apprendere i modelli di utilizzo e impostare soglie di allerta dinamiche, riducendo i falsi positivi dovuti a configurazioni di soglia statiche.
- Automazione dei workflow IT: Permette di creare risposte automatiche alle condizioni di errore, come l'esecuzione di script diagnostici o il riavvio di servizi al verificarsi di determinati allarmi.
- Previsione della capacità di archiviazione: Analizza le tendenze di utilizzo storico per prevedere quando le risorse di archiviazione saranno esaurite prima che ciò accada realmente.
Integrazioni di ManageEngine OpManager
Le integrazioni includono ServiceDesk Plus, NetFlow Analyzer, Network Configuration Manager, OpUtils, AlarmsOne, Applications Manager, Firewall Analyzer, Analytics Plus, AssetExplorer e Zoho Creator.
Pros and Cons
Pros:
- Scoperta di rete automatica e programmata
- Supporta ambienti multi-vendor
- Mappe di rete in tempo reale e aggiornate automaticamente
Cons:
- Il prezzo può essere elevato per piccoli team
- La configurazione iniziale può essere complessa
New Product Updates from ManageEngine OpManager
ManageEngine OpManager Vendor Templates and NCM XML Import
ManageEngine OpManager introduces enhanced vendor template integration and device template import for the NCM module using XML files. This update helps teams improve device classification and speed up configuration workflows. For more information, visit ManageEngine OpManager’s official site.
 .
.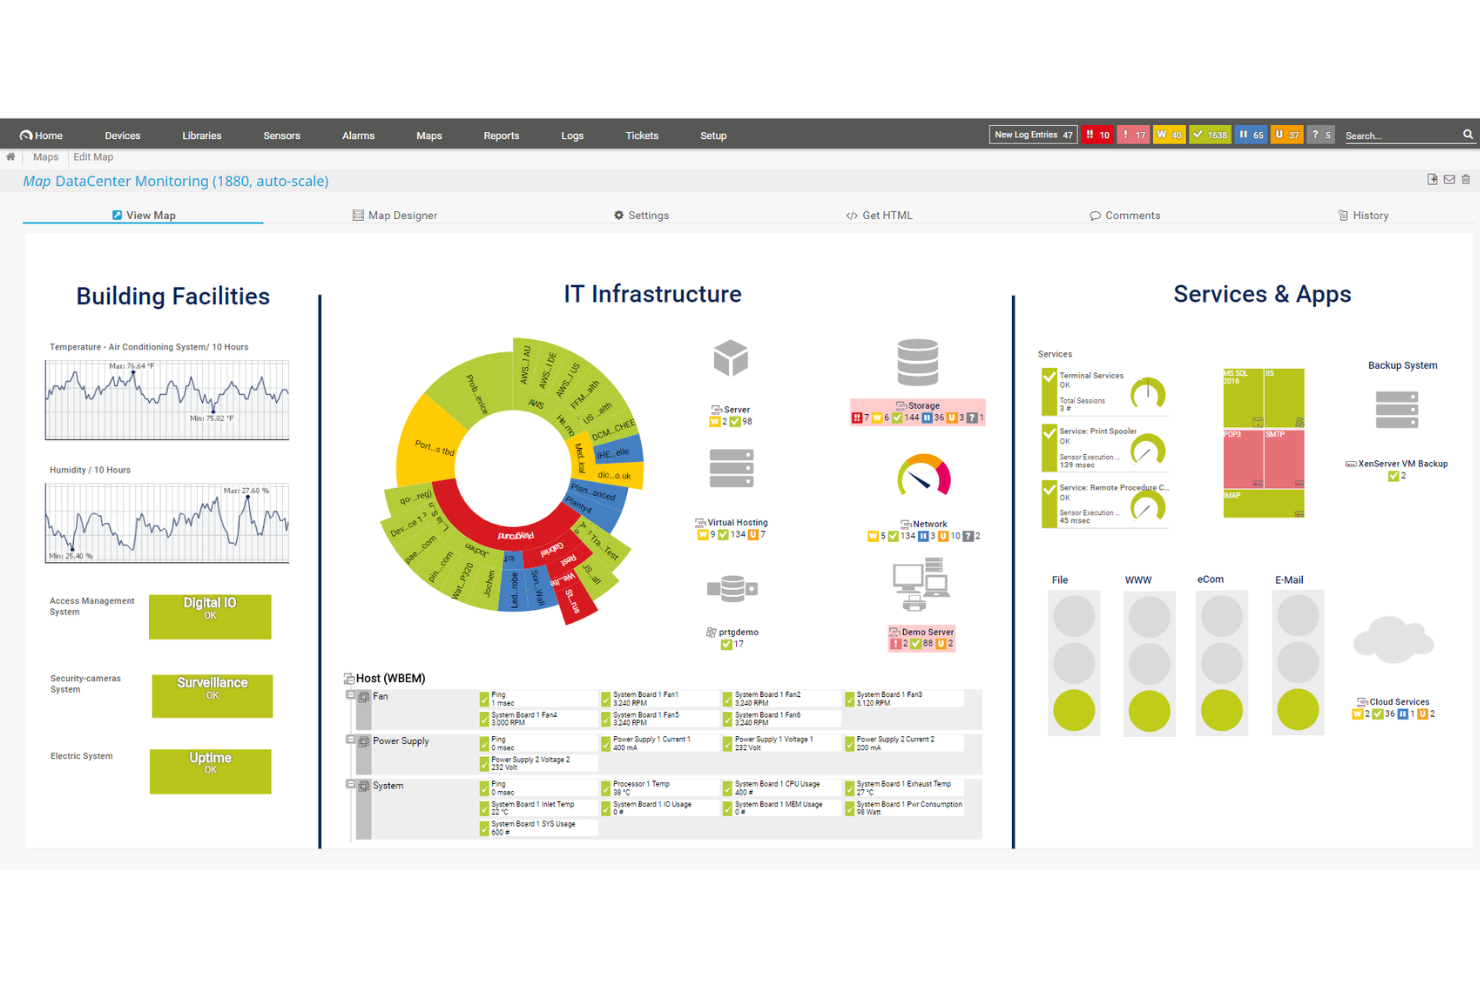
PRTG offre ai team IT e agli amministratori di sistema una piattaforma unificata per monitorare reti, server e applicazioni, aiutando aziende di tutte le dimensioni a rilevare problemi e mantenere un'infrastruttura affidabile.
Per chi è più indicato PRTG?
PRTG è una soluzione adatta ai team IT di piccole e medie imprese che necessitano di un modo semplice per monitorare l'intera infrastruttura da un'unica postazione.
Perché ho scelto PRTG
PRTG si guadagna un posto nella mia shortlist per la capacità con cui centralizza tutto senza richiedere una configurazione complessa. Apprezzo il fatto che la funzione di auto-scoperta scansiona la rete e configura automaticamente i sensori per i dispositivi rilevati, evitando così al mio team di dover aggiungere manualmente server, switch ed endpoint per ore. La libreria di oltre 250 sensori preconfigurati copre tutto, dal traffico SNMP e carico CPU agli ambienti VMware e ai dispositivi IoT basati su MQTT. Inoltre, la funzione di monitoraggio distribuito mi permette di gestire sedi remote e filiali tramite una singola dashboard utilizzando probe remoti che raccolgono dati localmente e li inviano all'installazione centrale di PRTG.
Funzionalità principali di PRTG
- Soglie di avviso personalizzabili: Imposta soglie specifiche per qualsiasi sensore affinché PRTG invii notifiche tramite email, push, SMS o richiesta HTTP quando un parametro supera il limite definito.
- Report personalizzabili: Crea e pianifica report utilizzando modelli personalizzabili che estraggono i dati in tempo reale dei sensori per condividere lo stato dell'infrastruttura con gli stakeholder.
- Rilevamento anomalie guidato dall'IA: PRTG utilizza baseline basate su IA che si adattano all'ambiente per segnalare comportamenti insoliti senza la necessità di configurare manualmente le soglie.
- Mappe e dashboard: Progetta mappe di rete in tempo reale tramite un designer drag-and-drop che mostra lo stato attuale dei dispositivi su tutta l'infrastruttura.
Integrazioni PRTG
Le integrazioni includono Amazon Web Services (AWS), Microsoft Azure, VMware, Cisco, HPE, Dell, NetApp, IBM, Oracle e SAP.
Pros and Cons
Pros:
- Supporta diverse tecnologie di monitoraggio
- Dashboard personalizzabili e avvisi in tempo reale
- Scalabile per soddisfare esigenze di rete in crescita
Cons:
- La configurazione iniziale può richiedere tempo
- La licenza basata sui sensori può diventare costosa per reti di grandi dimensioni
New Product Updates from PRTG
PRTG Introduces New Monitoring Sensors In Beta
This week, PRTG introduces three BETA sensors that broaden your monitoring scope for Proxmox VE clusters and SIMATIC S7-300/400 PLCs, giving you deeper operational insights. For more information, visit PRTG’s official site.
 .
.Ideale per un monitoraggio full-stack guidato dall’intelligenza artificiale

Dynatrace offre alle squadre IT e alle imprese una piattaforma unificata per monitorare infrastruttura, applicazioni ed esperienza utente, aiutando a rilevare, analizzare e risolvere problemi di prestazioni in ambienti moderni e complessi.
Per chi è ideale Dynatrace?
Dynatrace è ideale per grandi aziende e organizzazioni cloud-native che gestiscono ambienti distribuiti complessi e necessitano di un’osservabilità approfondita e automatizzata su tutto il proprio stack tecnologico.
Perché ho scelto Dynatrace
Dynatrace merita un posto nella mia shortlist grazie al suo motore AI, Davis, che va oltre il semplice alerting per offrire automaticamente un’analisi precisa delle cause radice. Quando si verifica un incidente, Davis non mostra solo un elenco di anomalie: traccia la catena causale su tutto lo stack e individua la fonte esatta, riducendo notevolmente il tempo medio di ripristino. Apprezzo anche il modello di distribuzione OneAgent, che consente a un singolo agente installato su un host di raccogliere in continuo metriche, tracce, log e dati di topologia lungo tutta la catena di consegna delle applicazioni, senza necessità di strumentazione manuale. Smartscape crea una mappa delle dipendenze in tempo reale del tuo ambiente, così quando qualcosa va storto hai già il contesto per capire cosa è stato colpito e perché.
Funzionalità chiave di Dynatrace
- Tracciamento distribuito PurePath: Cattura tempi end-to-end e contesto a livello di codice per ogni traccia distribuita su tutto lo stack, senza campionamento.
- Analisi dei log: Acquisisce, indicizza e correla dati di log in tempo reale insieme a metriche e tracce in una singola vista unificata.
- Monitoraggio dell’esperienza digitale: Traccia sessioni utente reali e transazioni sintetiche per misurare le prestazioni front-end su browser e app mobili.
- Ingestione dati OpenPipeline: Elabora, arricchisce e contestualizza i dati di osservabilità in streaming da qualsiasi fonte prima che arrivino a storage o analytics.
Integrazioni Dynatrace
Le integrazioni includono AWS, Azure, Google Cloud, Jira, Slack, GitHub Copilot, PagerDuty, JetBrains, Cursor IDE e Windsurf.
Pros and Cons
Pros:
- L’AI Davis fornisce rilevazione e diagnosi autonoma dei problemi in tempo reale
- Offre una visione olistica degli ambienti digitali, dal cloud all’esperienza utente
- Estese integrazioni con le principali piattaforme cloud
Cons:
- L’assenza di prezzi trasparenti potrebbe scoraggiare alcuni potenziali utenti
- Potrebbe essere troppo completo per piccole imprese o configurazioni semplici
- Alcuni utenti potrebbero trovare inizialmente complessa la configurazione e l’impostazione

Datadog è una piattaforma cloud di monitoraggio e analisi che offre approfondimenti dettagliati sulle prestazioni delle applicazioni. Consolida metriche, tracce e log in un'unica piattaforma, rendendolo particolarmente efficace per il monitoraggio delle performance applicative, grazie alla sua forza nell'analisi delle metriche.
Perché ho scelto Datadog: Nel determinare i migliori strumenti per il monitoraggio, Datadog si è distinto nella mia analisi. Ho giudicato la sua capacità di offrire approfondimenti granulari e in tempo reale sulle applicazioni come principale elemento differenziante. In base alla profondità e ampiezza delle sue funzionalità, l'ho trovato particolarmente adatto alle metriche delle prestazioni applicative.
Caratteristiche principali e integrazioni:
Datadog è rinomato per il suo APM (Application Performance Monitoring), che offre analisi dettagliate delle prestazioni e degli errori. Il tracciamento distribuito e le analisi in tempo reale consentono ai team di identificare facilmente i colli di bottiglia nel flusso di lavoro delle applicazioni. Completando le sue funzionalità principali, Datadog si integra con una moltitudine di servizi, tra cui AWS, Azure e Google Cloud, e offre un ricco set di integrazioni API.
Pros and Cons
Pros:
- APM avanzato con visualizzazione dettagliata dei dati
- Ampia gamma di integrazioni con provider cloud e altri servizi
- Dashboard personalizzabili adattate a specifiche esigenze di monitoraggio
Cons:
- Può risultare costoso per team o progetti di piccole dimensioni
- Curva di apprendimento più ripida per un utilizzo completo delle funzionalità
- Alcuni utenti segnalano ritardi occasionali nell'aggiornamento delle metriche

Site24x7 offre ai team IT e ai fornitori di servizi gestiti una piattaforma unificata per monitorare server, reti, applicazioni e risorse cloud, aiutandoti a rilevare e risolvere problemi di performance in tutto lo stack tecnologico.
Per chi è ideale Site24x7?
Site24x7 è particolarmente adatto a team IT e MSP che gestiscono ambienti misti, che includono infrastrutture locali, piattaforme cloud e applicazioni web.
Perché ho scelto Site24x7
Site24x7 merita un posto nella mia lista perché copre l’intero stack infrastrutturale da una console unica—server, reti, container, piattaforme cloud e applicazioni tutto in un unico luogo. Apprezzo in particolare il rilevamento di anomalie basato su AIOps, che sfrutta il ML per segnalare deviazioni rispetto a baseline dinamiche invece che dipendere da soglie statiche configurate manualmente. Questo consente al mio team di individuare una perdita di memoria o un insolito picco di traffico prima che si trasformi in un disservizio. La vista correlata di metriche, tracce e log è anche molto utile—quando qualcosa si guasta, non devo saltare tra tre strumenti diversi per capire cosa è successo.
Caratteristiche principali di Site24x7
- Monitoraggio prestazioni di rete: Analizza le prestazioni dei dispositivi di oltre 450 fornitori utilizzando più di 15.000 template sia a livello di dispositivo che di interfaccia.
- Monitoraggio reale degli utenti: Tiene traccia di come gli utenti finali vivono i tuoi siti web in diverse aree geografiche, dispositivi, browser e ISP, inclusi replay delle sessioni e tracciamento degli errori JavaScript.
- Gestione delle configurazioni di rete: Automatizza i backup delle configurazioni, rileva modifiche non autorizzate, individua vulnerabilità del firmware e traccia la conformità da un'unica postazione.
- Gestione dei log: Raccoglie e indicizza log da server, applicazioni, reti e servizi cloud in una console centralizzata con ricerca tramite query e dashboard di visualizzazione.
Integrazioni di Site24x7
Le integrazioni includono ServiceNow, PagerDuty, Opsgenie, Jira, Slack, Microsoft Teams, Zendesk, Freshservice, Splunk On-Call (VictorOps) e Discord.
Pros and Cons
Pros:
- Monitoraggio full-stack basato su AI che supporta la gestione di infrastruttura multicloud
- Procedura di configurazione rapida che copre il monitoraggio di siti web e risorse cloud
- Monitoraggio flessibile che si integra facilmente con molteplici componenti dell’infrastruttura
Cons:
- Bug negli avvisi causano problemi nell’aggiunta di nuove configurazioni di monitoraggio
- La struttura tariffaria diventa costosa a causa dei diversi tipi di monitor
New Product Updates from Site24x7
Site24x7 Adds Synchronization Statuses for MSPs
Site24x7 now provides MSPs enhanced alerts and synchronization statuses in a centralized notification center to spot configuration sync issues sooner and accelerate incident response. For more information, visit Site24x7's official site.

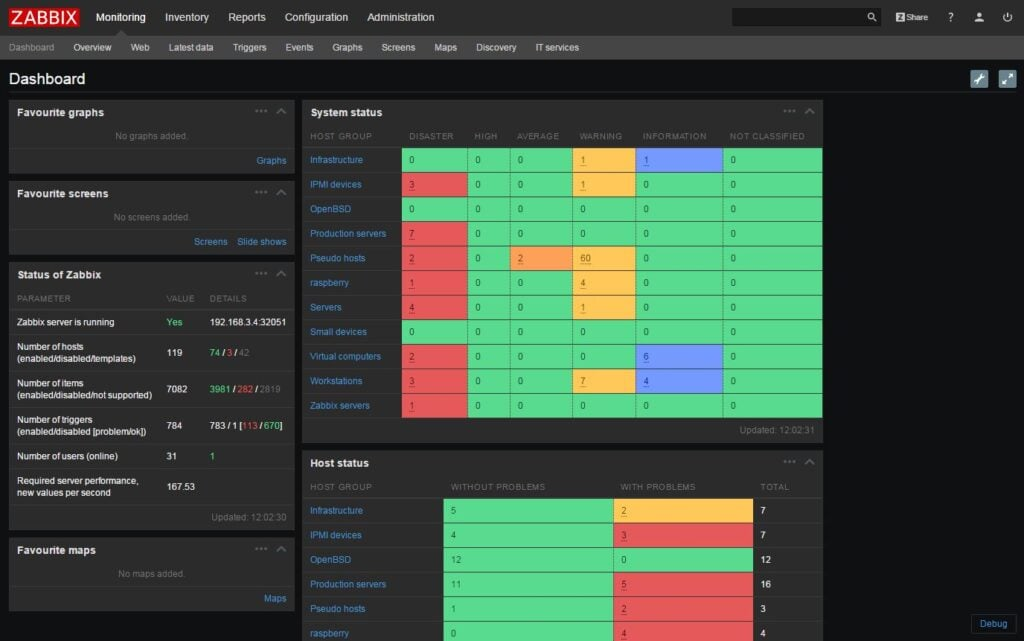
Zabbix è una piattaforma di monitoraggio open-source utilizzata dai team IT e dalle aziende per tracciare lo stato di salute e le prestazioni di reti, server, risorse cloud e applicazioni, aiutando le organizzazioni a individuare tempestivamente i problemi e a mantenere un'infrastruttura affidabile.
Per Chi è Zabbix?
Zabbix è particolarmente indicato per aziende di medie e grandi dimensioni e fornitori di servizi gestiti che necessitano di una soluzione di monitoraggio open-source e flessibile su infrastrutture complesse e distribuite.
Perché Ho Scelto Zabbix
Zabbix si è guadagnato un posto nella mia lista per la capacità di gestire la scalabilità senza imporre un'architettura rigida. Puoi distribuire un numero illimitato di proxy Zabbix per suddividere la raccolta dei dati tra sedi remote, data center o filiali aziendali; il traffico tra il server centrale e i proxy viene compresso, una funzionalità importante quando si raccolgono dati da centinaia di migliaia di dispositivi. Mi affido anche alla funzione di gruppi di proxy, che bilancia automaticamente il carico di monitoraggio tra i proxy e gestisce il failover se uno va giù. Il motore di auto-scoperta rileva dispositivi di rete, servizi e risorse come filesystem, CPU e container Docker, creando automaticamente elementi, trigger e grafici, così la scalabilità non richiede una configurazione manuale di ogni nuovo endpoint.
Funzionalità Principali di Zabbix
- Rilevamento delle anomalie: Zabbix utilizza il monitoraggio basato su baseline per calcolare automaticamente punti di riferimento dai dati storici e segnalare eventuali deviazioni in tempo reale.
- Monitoraggio SLA: Definisci alberi di servizio e logica personalizzata di calcolo SLA, con panoramiche SLA giornaliere, settimanali, mensili e annuali accessibili dalle dashboard.
- Monitoraggio sintetico: Crea scenari a più passaggi basati su browser per monitorare applicazioni web e API, compresa la cattura di screenshot e la raccolta di metriche sulle prestazioni.
- Registro di audit: Traccia ogni modifica della configurazione da parte dell'utente, inclusi gli indirizzi IP utilizzati, con esportazione completa tramite API per la revisione di conformità o sicurezza.
Integrazioni di Zabbix
Le integrazioni includono AWS, Microsoft Azure, VMware, Cisco, Dell, IBM, Oracle, Slack, Jira e ServiceNow.
Pros and Cons
Pros:
- Piattaforma open-source, rendendola conveniente per le aziende.
- Supporta un'ampia varietà di sistemi operativi.
- Il rilevamento avanzato dei problemi aiuta nella risoluzione rapida dei guasti
Cons:
- L'interfaccia può sembrare un po' datata ad alcuni utenti.
- La configurazione iniziale può essere complessa per chi non ha esperienza con le piattaforme open-source.
- Il supporto tecnico ufficiale può essere costoso per le aziende più piccole
Altri Strumenti di Monitoraggio del Sistema
Ecco alcune opzioni aggiuntive di strumenti di monitoraggio del sistema che non sono entrate nella mia shortlist, ma che vale comunque la pena considerare:
- Nagios
Ideale per il monitoraggio completo dell'infrastruttura IT
- New Relic
Ideale per ottenere informazioni approfondite sulla salute dell'infrastruttura
- Prometheus
Ideale per allerta e interrogazioni affidabili
- LibreNMS
Ideale per il monitoraggio di rete open-source


Come valuto gli strumenti di monitoraggio dei sistemi
Suddivido la mia valutazione in due livelli: requisiti di base come metriche in tempo reale e notifiche cross-platform, e fattori differenzianti come il rilevamento delle anomalie tramite IA che rendono uno strumento degno di essere consigliato.
Funzionalità di base (necessarie per questa lista)
Quando seleziono gli strumenti per la mia lista, valuto ciascuno su una scala da 0 (non offre la funzionalità) a 5 (eccelle in quest'area) per ogni funzionalità di base elencata qui sotto. Successivamente, calcolo il punteggio totale in percentuale. Ogni strumento deve ottenere un punteggio minimo totale del 75% per essere considerato.
- Raccolta di metriche in tempo reale: Verifico se uno strumento traccia CPU, memoria, disco e utilizzo di rete con una granularità inferiore al minuto—il tipo di frequenza di aggiornamento che serve durante un incidente in diretta.
- Allertamento e notifiche: Ogni strumento dovrebbe supportare avvisi configurabili con soglia su canali come email, Slack o PagerDuty, con regole di escalation per indirizzare i problemi all'ingegnere di turno giusto.
- Copertura cross-platform dei sistemi: Valuto se lo strumento monitora server fisici, VM, container e carichi di lavoro cloud su ambienti Linux, Windows e Unix in un'unica vista.
- Dashboard e visualizzazione: Una buona dashboard consente di passare da una panoramica generale a un'analisi dettagliata, ad esempio l'andamento della memoria di un singolo host negli ultimi 30 giorni; quindi cerco widget personalizzabili e viste storiche.
- Tracciamento di log ed eventi: Cerco la raccolta centralizzata dei log con ricerca e correlazione degli eventi—funzionalità che aiutano a collegare un picco di I/O sul disco a uno specifico cron job o a un evento di deployment.
- Raccolta dati con o senza agent: Lo strumento dovrebbe offrire metodi di raccolta flessibili, sia tramite agent leggeri sugli host di produzione sia tramite polling senza agent via SNMP, WMI o SSH per dispositivi di rete.
Una volta che dispongo di una lista di strumenti che soddisfano questi criteri, considero ciò che distingue ogni piattaforma.
Fattori differenzianti (ciò che distingue i fornitori)
Ecco come confronto e metto a confronto i diversi fornitori:
Caratteristiche distintive
Il rilevamento delle anomalie tramite IA è un grande elemento di differenziazione. Gli strumenti che creano una baseline del comportamento normale e segnalano le deviazioni aiutano i team a individuare problemi come una fuga di memoria lenta giorni prima che causi il crash di un host in produzione. Valuto inoltre l’auto-discovery e la mappatura topologica, aspetti importanti quando l’infrastruttura cambia frequentemente a causa di eventi di scaling o deployment. La pianificazione predittiva della capacità completa il quadro permettendo di prevedere l’esaurimento delle risorse, offrendo ai responsabili IT i dati necessari per giustificare investimenti infrastrutturali prima che un disservizio renda la decisione obbligata.
Oltre le funzionalità
La trasparenza del modello di pricing è molto importante in questo contesto. Alcuni strumenti addebitano per host, altri in base al volume dei dati e picchi inattesi di ingressi possono far saltare il budget da un giorno all’altro. Valuto se la tariffazione scala in modo prevedibile all’aumentare della complessità dell’ambiente. Un’altra priorità è la profondità delle integrazioni—verifico la presenza di connettori nativi con strumenti per gli incidenti come PagerDuty e piattaforme ITSM come ServiceNow, oltre al supporto di OpenTelemetry per i team che sviluppano pipeline di osservabilità personalizzate. Anche la flessibilità di deployment ha un peso, soprattutto per team che gestiscono ambienti ibridi o che hanno stringenti requisiti di residenza dei dati.
Come Scegliere uno Strumento di Monitoraggio del Sistema
È facile perdersi tra lunghe liste di funzionalità e strutture di prezzi complesse. Per aiutarti a restare concentrato durante il tuo processo di selezione del software, ecco una checklist di fattori da tenere a mente:
| Fattore | Cosa Considerare |
|---|---|
| Scalabilità | Lo strumento può crescere insieme alla tua azienda? Cerca soluzioni in grado di gestire il maggiore flusso di dati e utenti senza perdere in prestazioni. Considera anche le esigenze future. |
| Integrazioni | Funziona con il tuo attuale stack tecnologico? Verifica la compatibilità con il software già presente per garantire un flusso di dati fluido ed evitare sistemi isolati. |
| Personalizzazione | Puoi adattarlo al tuo flusso di lavoro? Valuta se lo strumento consente modifiche per adattarsi ai tuoi processi, evitando soluzioni rigide che ti costringono ad adattarti. |
| Semplicità d'uso | L'interfaccia è intuitiva per il tuo team? Uno strumento complesso può ostacolare l'efficienza. Scegli soluzioni dal design user-friendly per ridurre al minimo il tempo di formazione. |
| Implementazione e onboarding | Quanto tempo occorre per iniziare ad usarlo? Valuta il tempo e le risorse necessari per la messa in opera, inclusa la formazione e il supporto durante la transizione. |
| Costo | I prezzi sono trasparenti e nel budget? Considera sia i costi iniziali che quelli ricorrenti. Fai attenzione a costi nascosti che possono far aumentare la spesa totale. |
| Tutele di sicurezza | Protegge i tuoi dati? Assicurati che lo strumento sia conforme agli standard di sicurezza e che offra funzionalità come la crittografia e i controlli di accesso per tutelare le informazioni sensibili. |
Cosa Sono gli Strumenti di Monitoraggio del Sistema?
Gli strumenti di monitoraggio dei sistemi sono soluzioni software che tracciano e gestiscono le prestazioni e lo stato di salute dei sistemi IT. Gli amministratori IT, gli ingegneri di rete e gli analisti di sistema utilizzano tipicamente questi strumenti per assicurarsi che i sistemi funzionino in modo fluido ed efficiente. Le funzionalità di monitoraggio in tempo reale, avvisi e reportistica aiutano a identificare i problemi, ottimizzare le risorse e mantenere l’operatività continua. Questi strumenti forniscono informazioni fondamentali per mantenere i sistemi affidabili e sicuri, soprattutto quando si utilizzano software di monitoraggio hardware dedicati.
Caratteristiche
Quando scegli strumenti di monitoraggio dei sistemi, presta attenzione alle seguenti caratteristiche chiave:
- Monitoraggio in tempo reale: Tiene costantemente traccia delle prestazioni del sistema per identificare e risolvere rapidamente i problemi quando si presentano.
- Avvisi: Invia notifiche agli utenti quando vengono superate specifiche soglie, permettendo risposte tempestive ai potenziali problemi.
- Reportistica: Genera report dettagliati sulle prestazioni che aiutano ad analizzare le tendenze e a prendere decisioni informate.
- Capacità di integrazione: Si collega ai software e ai sistemi esistenti per garantire un flusso di dati senza interruzioni e un monitoraggio completo.
- Dashboard personalizzabili: Consentono agli utenti di personalizzare l’interfaccia per visualizzare i dati più rilevanti alle proprie esigenze.
- Analisi predittiva: Utilizza dati storici per prevedere potenziali problemi futuri, contribuendo a prevenire interruzioni prima che si verifichino.
- Salvaguardie di sicurezza: Offre funzionalità come crittografia e controlli di accesso per proteggere i dati sensibili del sistema.
- Scalabilità: Si adatta a una crescita dei dati e delle esigenze degli utenti senza compromettere le prestazioni.
- Interfaccia intuitiva: Garantisce facilità d’uso, riducendo il tempo di apprendimento e minimizzando la necessità di formazione approfondita.
- Risposta automatizzata agli incidenti: Fornisce strumenti che risolvono automaticamente i problemi comuni, diminuendo la necessità di interventi manuali.
Vantaggi
Implementare strumenti di monitoraggio dei sistemi, incluse moderne alternative a Nagios, offre diversi vantaggi al tuo team e alla tua azienda. Ecco alcuni benefici a cui puoi aspirare:
- Maggiore operatività: Il monitoraggio in tempo reale e gli avvisi ti aiutano a risolvere rapidamente i problemi, riducendo i tempi di inattività e mantenendo i sistemi operativi.
- Sicurezza migliorata: Salvaguardie di sicurezza come crittografia e controlli di accesso proteggono i dati sensibili, riducendo il rischio di violazioni.
- Decisioni informate: Report dettagliati e analisi predittiva offrono spunti che guidano l’allocazione delle risorse e la pianificazione futura.
- Maggiore efficienza: La risposta automatizzata agli incidenti riduce il carico di lavoro manuale, permettendo al team di concentrarsi su compiti più strategici.
- Migliore gestione delle risorse: Monitorare l’uso delle risorse aiuta a ottimizzare le prestazioni del sistema e a evitare spese non necessarie.
- Supporto alla scalabilità: La capacità di gestire crescenti richieste garantisce che i sistemi possano crescere con l’azienda senza perdita di prestazioni.
- Soddisfazione degli utenti: Un’interfaccia intuitiva rende più semplice per il team adottare e utilizzare efficacemente lo strumento, riducendo la frustrazione.
Costi e prezzi
Scegliere strumenti di monitoraggio dei sistemi richiede una comprensione dei vari modelli e piani tariffari disponibili. I costi variano in base alle funzionalità, alla dimensione del team, agli aggiuntivi e altro ancora. La tabella seguente riassume i piani più comuni, i loro prezzi medi e le funzionalità tipiche incluse nelle soluzioni di monitoraggio dei sistemi:
Tabella comparativa dei piani per strumenti di monitoraggio dei sistemi
| Tipo di piano | Prezzo medio | Caratteristiche comuni |
|---|---|---|
| Piano gratuito | $0 | Monitoraggio di base, avvisi limitati e supporto dalla community. |
| Piano personale | $5-$15/user/month | Monitoraggio in tempo reale, reportistica di base e notifiche email. |
| Piano business | $20-$50/user/month | Report avanzati, integrazioni e dashboard personalizzabili. |
| Piano enterprise | $60-$100/user/month | Suite completa di analytics, analisi predittiva e supporto clienti dedicato. |
FAQ sugli strumenti di monitoraggio dei sistemi
Ecco alcune risposte alle domande più comuni sugli strumenti di monitoraggio dei sistemi:
Gli strumenti di monitoraggio dei sistemi possono integrarsi con i sistemi di ticketing?
Sì, molti strumenti si collegano con piattaforme di ticketing come Jira o ServiceNow. Ciò significa che gli avvisi possono generare automaticamente ticket, così il tuo team non si perde nulla. Aiuta a mantenere i flussi di lavoro organizzati e a garantire che la risoluzione dei problemi rimanga sotto controllo. La configurazione di solito prevede l’uso di webhook o plugin nativi.
Che tipi di avvisi puoi impostare negli strumenti di monitoraggio dei sistemi?
Puoi impostare avvisi su soglie, anomalie o eventi specifici come interruzioni di servizio. Alcuni strumenti consentono avvisi personalizzati per messaggi di log o controlli non superati. Sei tu a decidere come scattano gli avvisi: per valore, intervallo temporale o tendenze. La consegna può avvenire via email, SMS, Slack o altri canali.
Gli strumenti di monitoraggio dei sistemi possono tracciare sia server che applicazioni?
Sì, molti strumenti monitorano sia i parametri hardware che le prestazioni a livello applicativo. Questo include uptime, tempi di risposta e comportamento degli utenti per le app. Puoi ottenere visibilità su come la salute dei server influisce sulle prestazioni delle applicazioni. Alcuni strumenti offrono moduli separati per l’infrastruttura e il monitoraggio applicativo.
Come supportano gli strumenti di monitoraggio dei sistemi ambienti multi-cloud?
La maggior parte degli strumenti permette di collegarsi a AWS, Azure e Google Cloud tramite API o agenti. Raccolgono dati su tutte queste piattaforme e li presentano in un’unica dashboard. Questo offre al team una sola vista delle prestazioni, anche se i sistemi sono distribuiti su diversi cloud. Riduce la necessità di gestire più strumenti di fornitori diversi.
Cosa succede dopo:
Se stai valutando strumenti di monitoraggio dei sistemi, contatta un consulente SoftwareSelect per ricevere consigli gratuiti.
Compila un modulo e fai una breve chiacchierata in cui approfondiranno le tue esigenze specifiche. Poi riceverai una shortlist di software da valutare. Ti supporteranno anche durante l’intero processo di acquisto, incluse le negoziazioni di prezzo.