12 Meilleurs Outils de Surveillance DevOps Passés en Revue pour 2026

12 Ma sélection des meilleurs outils de surveillance DevOps
Here's my pick of the 12 best software from the 22 tools reviewed.


Gérer un pipeline DevOps n’est pas une mince affaire. Entre garantir la stabilité en production, suivre les goulets d’étranglement en matière de performance et prévenir les interruptions de service, la pression pour maintenir le bon fonctionnement peut rapidement devenir écrasante. Vous avez peut-être déjà subi des retards frustrants causés par des problèmes non détectés ou peiné avec des outils qui ne s’intègrent pas efficacement à vos flux de travail. En réalité, sans les bons outils de surveillance DevOps, maintenir l’efficacité et offrir une excellente expérience utilisateur devient une lutte incessante.
Les outils de surveillance DevOps sont conçus pour vous offrir une visibilité sur vos systèmes, afin de vous aider à identifier et résoudre les problèmes potentiels avant qu’ils n’affectent vos utilisateurs. Ils sont essentiels pour garantir la fluidité des opérations, optimiser la performance et permettre à votre équipe de se concentrer sur l’innovation plutôt que sur la gestion de crise. Au fil des ans, j’ai utilisé de nombreuses solutions de surveillance sur de grands projets et des équipes variées. Dans ce guide, je partage mes meilleures recommandations et conseils pour vous aider à choisir l’outil qui optimisera vos processus et maintiendra vos systèmes à leur niveau de performance maximal.
Table of Contents
- Meilleure Sélection de Logiciels
- Pourquoi Nous Faire Confiance
- Comparer les Spécifications
- Avis
- Autres Outils de Surveillance DevOps
- Autres Analyses
- Critères de Sélection
- Comment Choisir
- Tendances dans les Outils de Surveillance DevOps
- Qu'est-ce que les Outils de Surveillance DevOps ?
- Fonctionnalités
- Avantages
- Coûts & Tarification
- FAQ
Why Trust Our Software Reviews
We’ve been testing and reviewing software since 2023. As tech leaders ourselves, we know how critical and difficult it is to make the right decision when selecting software.
We invest in deep research to help our audience make better software purchasing decisions. We’ve tested more than 2,000 tools for different tech use cases and written over 1,000 comprehensive software reviews. Learn how we stay transparent & our software review methodology.
Résumé des meilleurs outils de surveillance DevOps
| Tool | Best For | Trial Info | Price | ||
|---|---|---|---|---|---|
| 1 | Best for SSL certificate monitoring | Free plan + free demo available | From $8/10 monitors/month (billed annually) | Website | |
| 2 | Best for real user monitoring | 30-day free trial + free demo available | From $10/month (billed annually) | Website | |
| 3 | Best for multi-cloud monitoring | 30-day free trial + free demo + free plan availabl | From $199/year | Website | |
| 4 | Best for real-time infrastructure insights | 14-day free trial + free plan + free demo available | From $4.50/node/month (billed annually) | Website | |
| 5 | Best for end-to-end performance monitoring for large businesses | 15-day free trial | From $7/month | Website | |
| 6 | Best for monitoring server disruptions and outages | 14-day free trial + free plan + free demo available | From $21/user/month | Website | |
| 7 | Best for continuous monitoring of large port networks | Free plan and free demo available | From $2,595 (perpetual license for 100 nodes) | Website | |
| 8 | Best for performance monitoring for websites and mobile | Free trial available | Pricing upon request | Website | |
| 9 | Best for SaaS full-stack observability | Free trial + free demo available | Pricing upon request | Website | |
| 10 | Best for monitoring and searching through big data | 14-day free trial + free demo available | Pricing upon request | Website | |
| 11 | Best for alerts and aggregating metrics | Free-forever plan available | Free to use | Website | |
| 12 | Best for monitoring data analytics and visualization | Free plan available | From $19/month | Website |
-

Site24x7
Visit WebsiteThis is an aggregated rating for this tool including ratings from Crozdesk users and ratings from other sites.4.7 -
GitHub Actions
Visit WebsiteThis is an aggregated rating for this tool including ratings from Crozdesk users and ratings from other sites.4.8 -
Docker
Visit WebsiteThis is an aggregated rating for this tool including ratings from Crozdesk users and ratings from other sites.4.6


Avis sur les meilleurs outils de surveillance DevOps
Voici un aperçu des meilleurs outils de surveillance DevOps. Je mets en avant les fonctionnalités proposées par chaque outil et les raisons de leur présence dans cette liste.

For DevOps teams seeking a dependable monitoring solution, UptimeRobot offers a practical option that supports SSL certificate monitoring alongside uptime checks. It suits teams of all sizes, from solo operators to larger organizations, that need visibility into service availability and endpoint performance. By helping teams detect issues such as certificate expirations, downtime, and slow response times, UptimeRobot supports stable operations and consistent service delivery.
Why I Picked UptimeRobot
I picked UptimeRobot for its SSL certificate monitoring, which helps DevOps teams avoid issues caused by expired or misconfigured certificates. It tracks certificate status and sends alerts before expirations occur, reducing the risk of access warnings or service interruptions. UptimeRobot also provides downtime alerts through integrations like Slack and PagerDuty, making it easier for teams to respond quickly and keep services reliable.
UptimeRobot Key Features
In addition to SSL certificate monitoring, UptimeRobot offers:
- Multi-location Checks: Monitor your services from multiple global locations to ensure worldwide accessibility.
- Response Time Monitoring: Track how quickly your server responds to provide insights into performance bottlenecks.
- Customizable Status Pages: Share real-time status updates with users through branded status pages.
- Incident Management: Efficiently manage and resolve incidents with customizable alerts and team access levels.
UptimeRobot Integrations
Integrations include Slack, PagerDuty, Microsoft Teams, Telegram, Discord, Splunk On-Call, and more, allowing seamless alert management across your preferred communication platforms.
Pros and Cons
Pros:
- Supports multiple alert channels
- SSL monitoring helps maintain website security efficiently
- Real-time alerts ensure quick response to downtime issues
Cons:
- Not suited for complex DevOps stacks
- Limited customization in notification settings compared to competitors

Site24x7 is a cloud-based monitoring solution designed for DevOps and IT operations teams. It offers comprehensive monitoring capabilities for websites, servers, networks, applications, and cloud services. With Site24x7, you can gain real-time insights into your IT infrastructure's performance and health.
Why I Picked Site24x7: I like its application performance monitoring (APM) feature. This tool helps you identify and troubleshoot performance issues in your applications by providing detailed insights into transaction traces, database queries, and application components. Another valuable feature is real user monitoring (RUM). RUM allows you to track and analyze the experiences of actual users on your websites and web applications. By understanding how users interact with your services, you can make informed decisions to improve usability and performance.
Site24x7 Standout Features & Integrations
Features include synthetic web transaction monitoring, which lets you simulate user interactions to identify potential issues before they affect real users. Additionally, network monitoring provides visibility into the health of your network devices, helping you maintain reliability. Log management is another feature that enables you to collect and analyze logs from various sources, facilitating efficient troubleshooting and issue resolution.
Integrations include ServiceNow, PagerDuty, Jira, Microsoft Teams, Slack, Nagios, AWS, Azure, Google Cloud Platform, Docker, Jenkins, and Kubernetes.
Pros and Cons
Pros:
- Comprehensive monitoring for various systems
- Customizable dashboards and reports
- Offers real-time alerts across various channels
Cons:
- Complexity in initial setup for large environments
- Excessive alerts can be overwhelming for users
New Product Updates from Site24x7

Site24x7 Enhances Network Monitoring With Device and Visibility Updates
Site24x7 introduces proactive hardware health monitoring, expanded device support, centralized network controls, and enhanced SD-WAN visualization to improve network monitoring and management. For more information, visit Site24x7’s official site.
 .
.
ManageEngine Applications Manager is a comprehensive tool that offers multi-cloud monitoring, allowing users to monitor, manage, audit, and secure their multi-cloud and hybrid infrastructure. Its unique selling point lies in its ability to provide a unified solution for monitoring and managing multi-cloud environments, making it the best choice for businesses looking to streamline their multi-cloud monitoring efforts.
Why I Picked ManageEngine Applications Manager: ManageEngine Applications Manager excels by offering robust features that facilitate continuous monitoring, performance analysis, and troubleshooting across the entire DevOps pipeline. It supports a proactive approach to incident management, enables automation of routine checks, and provides detailed analytics to improve decision-making. Its ability to seamlessly integrate with various development, testing, and deployment tools makes it a valuable asset for DevOps teams aiming for high efficiency and minimal downtime.
ManageEngine Applications Manager Standout Features & Integrations
Features include extensive out-of-the-box support for monitoring more than 100 applications and servers, ranging from databases, web servers, application servers, and virtual servers, to cloud platforms, containers, and microservices architectures. Plus, ManageEngine Applications Manager incorporates advanced root cause analysis features powered by machine learning algorithms.
Integrations include Amazon Web Services (AWS), Microsoft Azure, Google Cloud Platform, Oracle Database, MySQL, Microsoft SQL Server, VMware, Docker, Apache Tomcat, and Redis.
Pros and Cons
Pros:
- Automated anomaly detection and alerting mechanisms
- Customizable dashboards and reports for insightful analytics
- Comprehensive monitoring capabilities across applications, servers, and cloud environments
Cons:
- The cost may be prohibitive for small to medium-sized enterprises
- Can be complex to set up and customize for specific needs
New Product Updates from ManageEngine Applications Manager
ManageEngine Applications Manager Adds Veeam Monitoring
ManageEngine Applications Manager adds Veeam Enterprise Manager monitoring. This update enables tracking of backup infrastructure, job performance, and storage usage. For more information, visit ManageEngine’s official site.
 .
.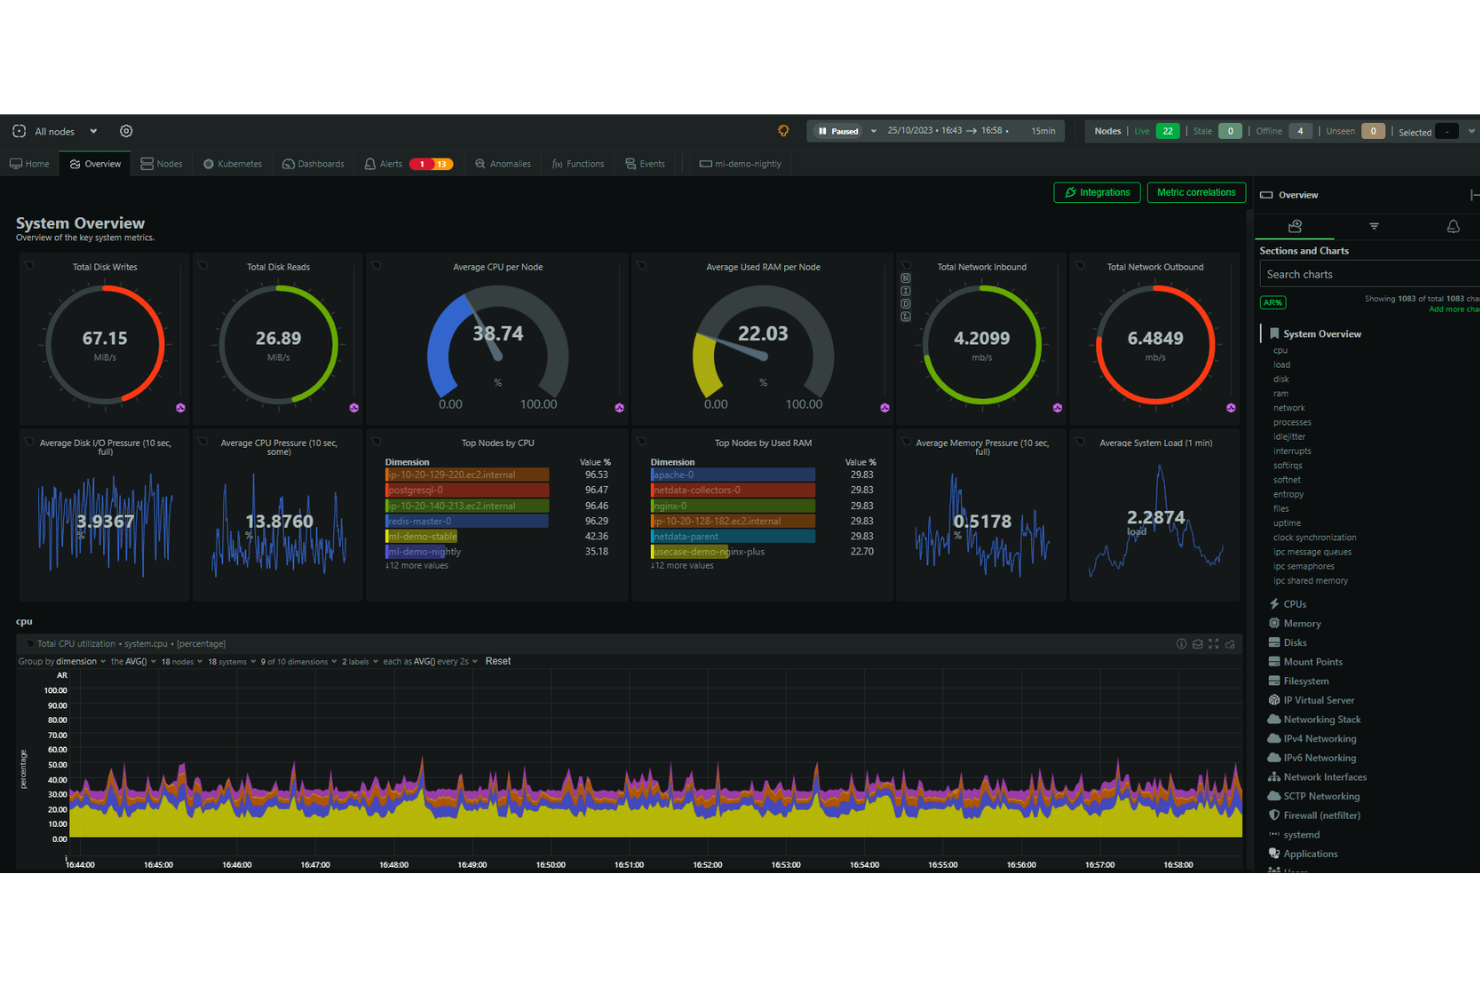
Netdata is an open-source monitoring and troubleshooting platform that offers high-resolution metrics, journal logs, and real-time visualizations for system monitoring. It aims to provide a cost-effective and user-friendly alternative to more expensive and complex platforms.
Why I Picked Netdata: I like that the platform emphasizes high-fidelity data and provides real-time visualizations, enabling users to monitor system performance and health with precision. It also simplifies and enhances the monitoring process for DevOps with features for collecting, storing, querying, visualizing, and alerting for a wide range of metrics. Netdata can be run on multiple nodes, and each instance of Netdata is capable of autonomous operation.
Netdata Standout Features & Integrations
Features include alerts to notify users of any issues detected within the system, automatic anomaly detection, and automated and customizable dashboards. Additionally, the core of the Netdata ecosystem is open-source, and it includes all the monitoring features such as the database, query engine, scoring engine, health engine, and machine learning engine.
Integrations include Containers, Kubernetes Containers, Virtual Machines, Apache, Consul, Elasticsearch, OpenSearch, MySQL, Redis, Squid log files, Windows, macOS, and hundreds more.
Pros and Cons
Pros:
- Interactive graphs for data visualization
- Unlimited metric monitoring
- Automated alerts
Cons:
- Insights could be more comprehensive
- May come with a learning curve to maximize its features
Best for end-to-end performance monitoring for large businesses

Dynatrace is an application performance monitoring (APM) that uses a built-in AI solution to help DevOps teams pinpoint performance issues. It excels in monitoring multi-platform environments, including multi-cloud, containers, microservices, and user experience.
Why I picked Dynatrace: I picked Dynatrace for its in-depth performance monitoring, which is ideal for large businesses. It offers granular visibility into customers, hybrid environments, and all aspects of your infrastructure.
Dynatrace Standout Features & Integrations:
Features I liked were those that prioritize performance capabilities, such as infrastructure monitoring and application monitoring. Additionally, Dynatrace leverages AI to continuously search for performance issues and pinpoint the root cause.
Integrations that Dynatrace partners with include Akamas, GitLab, Gremlin, NeoLoad, LaunchDarkly, xMatters, JFrog, and PagerDuty using built-in integrations.
Pros and Cons
Pros:
- Very active help support desk which can answer any questions if stuck
- Broad observability scope, which hits down to the code level
- Leverages an AI assistant to enhance troubleshooting and help with problem resolution
Cons:
- Price makes it a downside for many small to mid-sized companies
- Learning curve for operating Dynatrace effectively

PagerDuty is an incident response platform that sends alerts when there's a service disruption or outage. During critical moments, it can send email notifications, SMS notifications, and phone notifications to your development team or customer base.
Why I picked PagerDuty: I picked PagerDuty because it's an excellent tool if you're running mission-critical infrastructure that you want to keep tabs on. The platform enables you to get on-call alert notifications immediately.
PagerDuty Standout Features & Integrations:
Features that stood out to me as the most useful are 100% focused on alerting teams in case systems, nodes, or application services go awry and include email alerts, mobile alerts, root cause analysis, real-time notifications, and prioritization. You can also automatically schedule and escalate issues.
Integrations include pre-built plugins AWS, ServiceNow, Salesforce, Zendesk, Atlassian, Datadog, Slack, Splunk, and more.
Pros and Cons
Pros:
- Filters notifications to prioritize high-profile alerts that indicate genuine threats while reducing false alarms
- Customizable alerts can be sent via email, phone, SMS, or push notifications
- Allows you to allocate incident response to the right person or team
Cons:
- Uses a conventional dashboard that could be more customizable for specific needs and preferences
- Looking for historical alerts can be difficult unless you have an exact ID

Nagios is an open-source software application that monitors traffic networks continuously. It can track per-port bandwidth usage for inbound and outbound traffic, detect network outages, identify overutilized ports, and discover network abusers.
Why I picked Nagios: Instead of exposing my systems to vulnerabilities or worrying about slow network performance, Nagios gives my DevOps team immediate visibility of our network. I also liked it that logs information like network infrastructure issues and failed processes by the port.
Nagios Standout Features & Integrations
Features offered by Nagios ensure the security of my network ports. This includes SNMP monitoring, switch and router monitoring, network monitoring, and ping monitoring, which help me maintain the integrity and safety of my network infrastructure.
Integrations that are pre-built include Amazon SNS, Prometheus, PagerDuty, Dynatrace, and more. Also, Nagios has over 3,000 official and community plugins developers can add to their stack.
Pros and Cons
Pros:
- Increases the availability of your entire network infrastructure for protocol failures and network outages
- Lightweight for minimal resource usage
- Open-source version is 100% free
Cons:
- Uses files instead of databases to store config files on the backend
- Separate licenses are required for security and network visibility features

AppDynamics is a full-stack application performance management tool. It utilizes machine learning algorithms to detect performance issues, compares them to baseline metrics, and triggers alerts when necessary.
Why I picked AppDynamics: I picked AppDynamics because it focuses on application performance while also using monitoring to ensure optimal user experience. Whether you're managing a website or mobile app, AppDynamics ensures your customers don't encounter issues like timeouts or slow page load times.
AppDynamics Standout Features & Integrations:
Features I found that make AppDynamics excellent for performance monitoring include application performance monitoring (APM) and infrastructure visibility with database visibility. Additionally, end-user monitoring also caught my eye as it ensures your clients get the fastest application speeds possible.
Integrations that AppDynamics partners with include pre-built plugins like LoadRunner, Sainapse, and NeoLoad for performance and continuous delivery. AppDynamics also partners with SquaredUp, Medallia, and Quantum Metric to monitor customer experience.
Pros and Cons
Pros:
- Network visibility allows you to see the amount of bandwidth used per node
- Depth of monitoring of web applications and infrastructure is immense
- Gives real-time info on processes that consume CPU and memory
Cons:
- No automatic application scanning; they must be defined in a config file
- Functionality may be overwhelming for small businesses

New Relic is a web tracking and analytics tool that monitors the real-time observability of each application component distributed across databases and servers.
Why I picked New Relic: I picked New Relic because it provides an "all-in-one" solution that monitors and analyzes all aspects of your technology stack. Having complete end-to-end visibility allows teams to get actionable insights when problems arise and promptly address and resolve them.
New Relic Standout Features & Integrations:
Features I found that make New Relic great for full-stack monitoring include application monitoring and database monitoring. Additionally, there’s availability monitoring to ensure your systems work in public or private locations around the clock.
Integrations are available with pre-built plugins such as AWS, Kubernetes, Azure, Google Cloud Platform, and Prometheus. You can also use native integrations like SQL Server to send queries to New Relic.
Pros and Cons
Pros:
- Easy agent installation that allows you to pipe data on your dashboard within minutes
- Provides insights into metrics and performance even under high load and stress
- Highly feature-rich and provides the ability to write custom queries against collected instrumentation data
Cons:
- The interface can be a little tricky due to the number of options on the screen
- Cost can be considered high, especially for startups and even mid-sized companies

Splunk is a software tool that captures and indexes data, organizing it in a searchable repository. It enables the generation of alerts, reports, and visualizations from large datasets.
Why I picked Splunk: I picked Splunk because of its ability to scale and handle large volumes of data. With the increasing complexity of modern applications and distributed systems, Splunk's scalability ensures you can effectively manage and analyze logs from multiple sources without compromising performance.
Splunk Standout Features & Integrations:
Features of Splunk are designed to provide teams with greater visibility into their applications. I believe its indexing and data collection, workload management capabilities, machine learning toolkit, and intuitive data exploration tools make it a great tool for teams.
Integrations are available with pre-built plugins via Docker, Jenkins, Kubernetes, Ansible, AWS, Azure, and ServiceNow. Additionally, Splunk gives information about each integration's capabilities, allowing you to see whether your integrations can provide you with traces, logs, metrics, or metadata with Splunk.
Pros and Cons
Pros:
- Creates analytical reports and visualizes data with charts, graphs, and tables
- Highly scalable and easy to implement
- Saves your searches and automatically recognizes important data
Cons:
- Visit WebsiteOpens new window
- Optimizing searches for speed can be difficult
- Can be costly, especially if your services require intensive resources

Prometheus is an open-source systems monitoring and alert tool to collect and store metrics. It helps you monitor critical time series data, such as memory consumption, resource utilization, error rates, and incoming requests.
Why I picked Prometheus: I picked Prometheus because of how well it excels at collecting, storing, and querying metrics from HTTP endpoints. It allows you to easily expose, scrape, and query data to let you know if your infrastructure or services are working or not.
Prometheus Standout Features & Integrations
Features that make Prometheus one of the best tools on the market are its alerts and data aggregation. I can benefit from log monitoring, alert monitoring, time series collection, and metric storage and observation.
Integrations mostly include pre-built remote endpoint and storage platforms, such as Elasticsearch, InfluxDB, and Kafka. It's also possible to integrate Alertmanager webhooks for notifications on applications like Discord, GitLab, and Zoom.
Pros and Cons
Pros:
- Customizable alerts
- Intuitive metric patterns for easy data querying
- Uses pull metrics to parse data without installing additional programs on your containers
Cons:
- May need to learn PromQL to query metrics.
- The documentation may lack clarity or be confusing at times

Grafana is an open-source data analytics web application that allows you to monitor important infrastructure on servers, software applications, and various services. It provides DevOps teams with the ability to visually analyze data from multiple sources, enabling them to easily filter through information.
Why I picked Grafana: I picked Grafana because it provides DevOps teams with customizable dashboards that you can modify to fit specific needs. The tool supports a variety of visualizations, including heat maps, graphs, tables, and text panels.
Grafana Standout Features & Integrations:
Features that stood out to me focused on visualization, such as dashboard templating, node graphs, status history, and times series. These features also offer panel customizations that put data sources and queries on display.
Integrations that Grafana is able to parse data sources from include pre-built plugins, including Prometheus, AWS, Azure DevOps, Cloudflare, Elastic, and Humio.
Pros and Cons
Pros:
- Extensive customization options for alerts, data sources, notifications, and more
- Has the capability to retrieve data from any data source, regardless of its origin or format
- Offers highly configurable and customizable visualization panels
Cons:
- Garfana has no means to store and collect data on its own
- BI dashboards can be difficult to create and may require the use of plugins
Autres outils de surveillance DevOps
Voici quelques autres outils qui n’entrent pas dans le top 12 mais qui méritent clairement d’être découverts :
- Buddy
For monitoring websites and mobile apps for small businesses
- InfluxDB
For monitoring time series data in a single, multi-purpose database
- Sensu
For monitoring cloud environments
- ChaosSearch
For centralizing log and event data in the cloud
- Dotcom Monitor
For monitoring critical workflows
- Datadog
Datadog
- Zabbix
For network parameter monitoring
- Jenkins
For executing monitoring scripts
- Honeycomb
For observing code on live applications
- Icinga
For checking the availability of network resources


Autres logiciels & revues d’outils similaires
Si vous n’avez pas encore trouvé ce que vous cherchez ici, découvrez ces autres catégories d’outils que nous avons testées et évaluées.
- Logiciels de surveillance réseau
- Logiciels de surveillance de serveurs
- Solutions SD-Wan
- Outils de surveillance de l’infrastructure
- Analyseurs de paquets
- Outils de surveillance applicative
Critères de sélection des outils de surveillance DevOps
Pour sélectionner les meilleurs outils de surveillance DevOps présents dans cette liste, j’ai pris en compte les besoins courants des acheteurs et leurs difficultés, comme la gestion d’infrastructures complexes et l’assurance d’une détection en temps réel des incidents. J’ai également utilisé le cadre d’évaluation suivant pour garantir une analyse structurée et équitable :
Fonctionnalités essentielles (25 % de la note globale)
Pour figurer dans ce classement, chaque solution devait répondre à ces cas d’usage essentiels :
- Surveiller la performance du système
- Détecter et avertir en cas de problèmes
- Fournir des informations en temps réel
- Suivre la santé des applications
- Prendre en charge l’intégration avec d’autres outils
Fonctionnalités distinctives additionnelles (25 % de la note globale)
Pour affiner encore la sélection, j’ai aussi pris en compte certaines fonctionnalités uniques, telles que :
- Analyses basées sur l’IA
- Tableaux de bord personnalisables
- Capacités de maintenance prédictive
- Compatibilité multiplateforme
- Fonctionnalités de sécurité avancées
Facilité d'utilisation (10 % du score total)
Pour évaluer la facilité d’utilisation de chaque système, j’ai pris en compte les éléments suivants :
- Interface utilisateur intuitive
- Simplicité de navigation
- Options de personnalisation
- Vitesse de performance
- Courbe d’apprentissage minimale
Intégration (10 % du score total)
Pour évaluer l’expérience d’intégration pour chaque plateforme, j’ai pris en compte les éléments suivants :
- Disponibilité de vidéos de formation
- Visites interactives du produit
- Documentation complète
- Accès aux webinaires
- Forums communautaires d’entraide
Service client (10 % du score total)
Pour évaluer le service client de chaque fournisseur de logiciel, j’ai pris en compte les éléments suivants :
- Disponibilité d’un support 24/7
- Réactivité face aux demandes
- Qualité de la documentation du support
- Accès au chat en direct
- Disponibilité de responsables de compte dédiés
Rapport qualité-prix (10 % du score total)
Pour évaluer le rapport qualité-prix de chaque plateforme, j’ai pris en compte les éléments suivants :
- Tarification compétitive
- Souplesse des formules tarifaires
- Fonctionnalités proposées à chaque niveau de prix
- Réductions pour engagements annuels
- Périodes d’essai disponibles
Avis clients (10 % du score total)
Pour évaluer la satisfaction globale des clients, j’ai pris en compte les points suivants lors de la lecture des avis :
- Notes globales de satisfaction
- Points forts et faibles couramment cités
- Retour d’expérience sur l’efficacité des fonctionnalités
- Avis sur le support client
- Recommandations d’amélioration
Comment choisir des outils de supervision DevOps
Il est facile de se perdre dans de longues listes de fonctionnalités et des structures tarifaires complexes. Pour vous aider à rester concentré durant votre processus de sélection de logiciel, voici une liste de critères à garder en tête :
| Critère | À prendre en considération |
|---|---|
| Évolutivité | Assurez-vous que l’outil peut gérer des charges croissantes et un plus grand nombre d’utilisateurs sans perte de performances. Les solutions cloud avec auto-scaling peuvent accompagner la croissance. |
| Intégrations | Vérifiez si l’outil s’intègre avec votre pile DevOps existante, y compris vos pipelines CI/CD, services cloud et plateformes de gestion des incidents. |
| Personnalisation | Recherchez des options pour ajuster les paramètres de supervision, les seuils d’alerte et les tableaux de bord afin d’adapter l’outil aux méthodes et priorités de votre équipe. |
| Facilité d’utilisation | L’outil doit proposer une interface claire et des commandes intuitives pour permettre à votre équipe de repérer rapidement les incidents et d’agir. Des configurations trop complexes peuvent ralentir la réactivité. |
| Budget | Comparez les coûts d’abonnement, les frais de licence et les suppléments éventuels pour les fonctionnalités avancées ou l’augmentation du volume de données. Attention aux coûts cachés. |
| Sécurité | Vérifiez la présence de chiffrement, de contrôles d’accès et de transmission sécurisée des données afin de protéger les informations sensibles et éviter les violations. |
| Alertes en temps réel | L’outil doit offrir des alertes instantanées pour les problèmes de performance ou les interruptions de service, permettant à votre équipe d’agir promptement afin de réduire les périodes d’indisponibilité. |
| Rétention des données et rapports | Assurez-vous que l’outil stocke suffisamment de données historiques pour mener des analyses pertinentes et identifier des tendances. Les rapports exportables sont utiles pour les réunions d’équipe. |
Tendances des outils de supervision DevOps
Dans le cadre de mes recherches, j’ai épluché de nombreux communiqués, mises à jour produits et journaux de release de la part de différents éditeurs d’outils de supervision DevOps. Voici quelques tendances émergentes qui attirent particulièrement mon attention :
Détection des anomalies améliorée : De nouveaux modèles de machine learning perfectionnent la détection d’anomalies, permettant à vos équipes d’identifier des comportements inhabituels en temps réel et de réduire les faux positifs.
Observabilité tout-en-un : Les éditeurs élargissent leur offre pour fournir une visibilité complète sur l’infrastructure, les applications et l’expérience utilisateur en un seul endroit. Cela facilite le diagnostic et la résolution des incidents. Lorsque vous évaluez des plateformes d’observabilité, recherchez des solutions aux capacités de supervision étendues.
Analyses pilotées par l’IA : De plus en plus d’outils exploitent l’intelligence artificielle pour analyser les données et prédire les problèmes de performance avant qu’ils ne surviennent. Cela permet aux équipes d’agir de manière proactive plutôt que de réagir face aux pannes.
Traçabilité distribuée : Les outils intègrent des fonctionnalités de traçage permettant aux équipes de suivre les requêtes à travers les microservices et les conteneurs. Cela facilite la localisation des points de lenteur ou de défaillance.
Systèmes auto-réparateurs : Certains outils proposent désormais une remédiation automatisée, où le système peut détecter un problème et le résoudre sans intervention humaine. Cela réduit les temps d’arrêt et les délais de réponse.
Qu’est-ce que les outils de surveillance DevOps ?
Les outils de surveillance DevOps sont des solutions logicielles spécialisées conçues pour suivre et analyser en temps réel les performances et la santé des applications et de l’infrastructure. Ils sont principalement utilisés par les ingénieurs DevOps, les administrateurs système et les professionnels de l’informatique afin de garantir le bon fonctionnement et la livraison fluide des produits logiciels.
Les outils de surveillance DevOps permettent d’automatiser le processus de surveillance, d’apporter des informations sur les performances système et d’identifier et de résoudre rapidement les problèmes avant qu’ils n’affectent l’environnement de production. Des fonctionnalités telles que les alertes en temps réel, les Fonctionnalités Voici quelques-unes des fonctionnalités les plus importantes que je recherche dans les outils de surveillance DevOps lorsque je les évalue pour ma liste : Les outils de surveillance jouent un rôle essentiel dans l’écosystème DevOps. Ils permettent non seulement d’identifier et de résoudre rapidement les problèmes, mais fournissent aussi des analyses utiles, menant à des prises de décisions plus éclairées et à une amélioration de la performance globale. Voici quelques avantages plus concrets de ces outils pour votre équipe DevOps : Avec une variété d'options de forfaits disponibles, comprendre la tarification et les fonctionnalités de chacun peut aider les acheteurs de logiciels à prendre une décision éclairée qui correspond à leurs besoins et à leur budget. Des versions gratuites conçues pour les petits projets jusqu'aux forfaits d'entreprise avec des fonctionnalités avancées, il existe des outils de surveillance pour tous les niveaux d'activité. Ci-dessous figure une analyse détaillée des options de forfaits courants et de la tarification pour les outils de surveillance DevOps, destinée à aider les nouveaux utilisateurs de cette catégorie logicielle à faire leur choix. Voici des réponses à des questions courantes sur les outils de surveillance DevOps : Si vous êtes en train de rechercher des outils de surveillance DevOps, contactez gratuitement un conseiller SoftwareSelect pour des recommandations personnalisées. Remplissez un formulaire puis discutez brièvement de vos besoins spécifiques. Vous recevrez ensuite une liste d’outils à examiner. Ils vous accompagnent même tout au long du processus d'achat, y compris lors des négociations tarifaires.
Avantages
Coûts & Tarification
Tableau comparatif des forfaits pour les outils de surveillance DevOps
Type de forfait Prix moyen Fonctionnalités courantes Gratuit $0 Fonctionnalités de surveillance de base, indicateurs et journaux limités, assistance communautaire, accès aux forums Basique $20-$50/user/month Fonctionnalités de surveillance améliorées, plus d'indicateurs et journaux, support par e-mail, intégration à d'autres outils Standard $50-$100/user/month Suite de surveillance complète, analyses avancées, support 24/7, tableaux de bord personnalisables, options d'intégration Premium $100-$200/user/month Fonctionnalités premium dont analyses prédictives, capacités d'apprentissage automatique, support dédié, intégrations personnalisées Entreprise Custom pricing Toutes les fonctionnalités Premium plus options de montée en charge, gestionnaire de compte dédié, sécurité de niveau entreprise FAQ sur les outils de surveillance DevOps
Comment les outils de surveillance DevOps gèrent-ils des infrastructures à grande échelle ?
Les outils de surveillance DevOps peuvent-ils suivre les performances à travers différents environnements ?
Comment les outils de surveillance DevOps aident-ils à la gestion des incidents ?
Quelle est la différence entre surveillance de l'infrastructure et surveillance applicative ?
Comment les outils de surveillance DevOps peuvent-ils réduire les faux positifs ?
Les outils de surveillance DevOps prennent-ils en charge des métriques personnalisées ?
Et ensuite :