10 Best Sumo Logic Alternatives Reviewed in 2026

Best Sumo Logic Alternatives Shortlist


As someone who has been navigating the vast ocean of apps, SaaS, and network monitoring tools, I understand your need for efficient and reliable Sumo Logic alternatives. Sumo Logic is a top-tier data visualization tool that transforms cloud monitoring data into insightful graphs. The benefits are clear: it simplifies data parsing and retention, offering cloud and on-premise solutions. The real game-changers, however, are its vast array of plugins, which make it versatile for diverse needs.
The pain points it addresses are centered on streamlining complex data management processes. It saves you the headache of sifting through heaps of network data and aids in pinpointing the anomalies that require your attention. With the best alternatives at your fingertips, you can easily choose a solution that matches your needs. Please go ahead, dive into these options, and find the tool that's the right fit for you.
What Is Sumo Logic?
Sumo Logic is a cloud-based observability and log management platform that helps you collect, analyze, and visualize data from apps and infrastructure. It’s used by DevOps teams, security analysts, and developers who need to monitor system health, detect issues, and investigate incidents. Log analytics, real-time dashboards, and threat detection tools help with spotting errors, tracking performance, and responding to risks. Overall, Sumo Logic helps your team make sense of system data and act faster when things go wrong.
Why Trust Our Software Reviews
We’ve been testing and reviewing SaaS development software since 2023. As tech experts ourselves, we know how critical and difficult it is to make the right decision when selecting software. We invest in deep research to help our audience make better software purchasing decisions.
We’ve tested more than 2,000 tools for different SaaS development use cases and written over 1,000 comprehensive software reviews. Learn how we stay transparent & check out our software review methodology.
Best Sumo Logic Alternatives Summary
This comparison chart summarizes pricing details for my top Sumo Logic alternative selections to help you find the best one for your budget and business needs.
| Tool | Best For | Trial Info | Price | ||
|---|---|---|---|---|---|
| 1 | Best for distributed tracing | Free plan + free trial + free demo available | From $26/month (billed annually) | Website | |
| 2 | Best for businesses requiring high-powered data collection and analytics | 14-day free trial available | Pricing upon request | Website | |
| 3 | Best for network traffic monitoring | 30-day free trial + free demo available | From $10/month (billed annually) | Website | |
| 4 | Best for developers needing comprehensive application performance tools | 14-day free trial | $80/month | Website | |
| 5 | Best for IT operations and DevOps needing automated infrastructure monitoring | Free 15-day trial | From $16/hybrid unit/month | Website | |
| 6 | Best for businesses seeking end-to-end performance monitoring | Free trial available | Pricing upon request | Website | |
| 7 | Best for full-stack observability with applied intelligence | Free plan available | From $49/user/month | Website | |
| 8 | Best for modern engineers needing robust log management | Free plan + free demo available | From $29/license/month | Website | |
| 9 | Best for visualizing and analyzing metrics from mixed sources | Free plan available | From $19/month | Website | |
| 10 | Best for large-scale log management and analysis in real-time | Not available | From $10/user/month (billed annually) | Website |
-

TestDevLab
Visit Website -
Site24x7
Visit WebsiteThis is an aggregated rating for this tool including ratings from Crozdesk users and ratings from other sites.4.7 -
GitHub Actions
Visit WebsiteThis is an aggregated rating for this tool including ratings from Crozdesk users and ratings from other sites.4.8


Best Sumo Logic Alternatives Reviews
Below are my detailed summaries of the best Sumo Logic alternatives that made it onto my shortlist. My reviews offer a detailed look at the key features, pros & cons, integrations, and ideal use cases of each tool to help you find the best one for you.
For teams looking for a Sumo Logic alternative, Sentry offers application performance monitoring with support for distributed tracing and error tracking. It helps developers identify and resolve issues across web, mobile, and enterprise applications. By giving clearer visibility into how requests move through services, Sentry helps teams reduce downtime and limit user experience disruptions.
Why I Picked Sentry
I picked Sentry for its distributed tracing, which helps teams follow requests across frontend and backend services. This makes it easier to see where errors and slowdowns occur within an application flow. Combined with error tracking and session replay, Sentry gives teams a clearer context when diagnosing performance issues and user-reported problems.
Sentry Key Features
In addition to distributed tracing, Sentry offers:
- Performance Monitoring: This feature provides insights into key metrics such as latency and throughput, helping you optimize application performance.
- Release Health Monitoring: Offers real-time visibility into the health of new releases, enabling you to detect and address issues quickly.
- Uptime Monitoring: Continuously tracks the availability of your web services and alerts you to any downtime, ensuring minimal disruption to users.
- Recurring Job Monitoring: Alerts you to errors and timeouts in scheduled jobs, helping maintain the reliability of automated processes.
Sentry Integrations
Integrations include GitHub, Slack, Jira, GitLab, Bitbucket, Azure DevOps, Trello, Zendesk, PagerDuty, and Microsoft Teams.
Pros and Cons
Pros:
- Distributed tracing helps track issues across multiple services
- Strong error tracking with clear links to source code
- Supports both frontend and backend applications
Cons:
- Less coverage for infrastructure-level monitoring
- Requires setup to get full value from tracing and replays
New Product Updates from Sentry

Sentry Adds GitLab Support and gRPC Instrumentation
Sentry adds GitLab support for Seer and gRPC instrumentation for Dart and Flutter to improve root cause analysis, code tracing, and debugging workflows. For more information, visit Sentry’s official site.
 .
.Best for businesses requiring high-powered data collection and analytics

Splunk Enterprise is a software platform that provides comprehensive insights into your machine data. Its powerful data collection and analytics make it a top choice for businesses that require high-powered, in-depth data analysis capabilities.
Pros and Cons
Pros:
- Provides powerful search and analytics tools for in-depth data analysis.
- Has scalable data collection to accommodate growing data volumes.
- Offers real-time visibility into machine data.
Cons:
- The complexity of the tool needs to be more straightforward for businesses with simpler data needs.
- It may require a significant learning curve for those unfamiliar with the platform.
- It has a high starting price, which may not be suitable for smaller businesses.
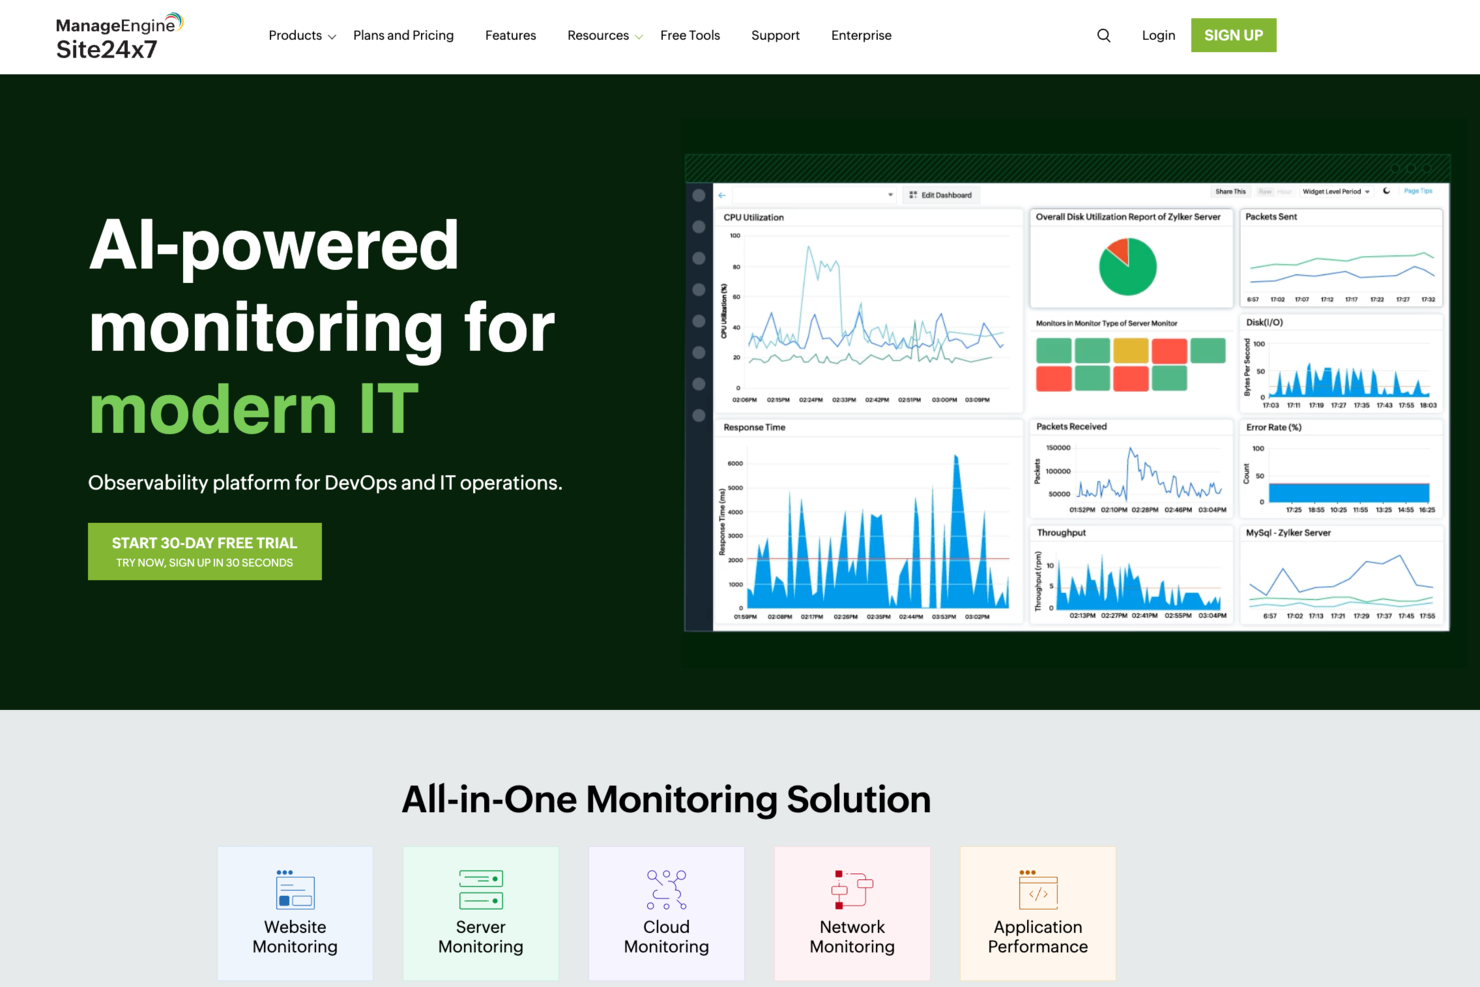
Site24x7 provides an all-encompassing monitoring solution tailored for businesses seeking an alternative to Sumo Logic. It appeals to IT professionals and business stakeholders across industries who require comprehensive visibility into their digital infrastructure. By addressing challenges such as application performance, network monitoring, and log management, Site24x7 empowers teams to enhance operational efficiency and user experience without the complexity often associated with traditional monitoring tools.
Why I Picked Site24x7
I picked Site24x7 because of its extensive application and infrastructure monitoring capabilities, which make it a compelling alternative to Sumo Logic. For instance, its real user monitoring (RUM) provides in-depth insights into user interactions on both web and mobile platforms, facilitating a deeper understanding of user experience. Additionally, Site24x7's log management feature centralizes log collection and analysis, offering a streamlined approach to troubleshooting and operational insights. These functionalities align perfectly with the needs of businesses looking for a holistic monitoring solution.
Site24x7 Key Features
In addition to its application and infrastructure monitoring, Site24x7 offers several other features that enhance its appeal as a Sumo Logic alternative:
- Network Traffic Monitoring: Provides real-time insights into network performance, helping you identify and resolve potential bottlenecks.
- Synthetic Monitoring: Simulates user interactions to detect performance issues before real users are impacted.
- AIOps: Employs artificial intelligence to detect anomalies and automate IT operations, enhancing efficiency.
- Custom Dashboards: Allows you to create tailored dashboards for visualizing performance metrics that matter most to your team.
Site24x7 Integrations
Integrations include ServiceNow, PagerDuty, Slack, Microsoft Teams, Jira, Opsgenie, Zoho CRM, Google Analytics, Atlassian Statuspage, and Amazon CloudWatch.
Pros and Cons
Pros:
- Infrastructure and network visibility
- Built-in real user monitoring
- Broad monitoring beyond log analytics
Cons:
- Interface can feel overwhelming
- Log analytics less advanced
New Product Updates from Site24x7

Site24x7 Adds Discovery Issues for AWS Monitoring
Site24x7 added Discovery Issues for AWS monitoring, helping teams identify why resources are not being discovered across services and regions. The feature surfaces permission gaps, policy restrictions, and blocked API actions to support faster troubleshooting. For more information, visit Site24x7’s official site.
 .
.Stackify
Best for developers needing comprehensive application performance tools

Stackify is an application performance management tool designed specifically for developers. It offers an end-to-end view of application performance, allowing developers to effectively identify and troubleshoot potential issues.
Pros and Cons
Pros:
- Supports a wide range of programming languages and frameworks.
- Offers detailed code profiling and error tracking.
- It is tailored to the needs of developers.
Cons:
- Pricing could be more competitive compared to other solutions.
- Some users report a slightly steep learning curve.
- It could be more feature-rich compared to other APM tools.
Best for IT operations and DevOps needing automated infrastructure monitoring

LogicMonitor is a cloud-based infrastructure monitoring and observability platform. It allows IT operations and DevOps teams to monitor infrastructure automatically, making it a go-to tool for businesses wanting to achieve a proactive stance toward system health.
Pros and Cons
Pros:
- Extensive integrations with cloud and container platforms.
- Real-time performance insights.
- We have automated infrastructure monitoring.
Cons:
- Some users may find the interface to be more intuitive.
- The initial setup process may be complex for some.
- Pricing information is not readily available.
Best for businesses seeking end-to-end performance monitoring

AppDynamics is an application performance management (APM) and IT operations analytics (ITOA) company. The platform offers an end-to-end performance monitoring solution, providing deep insights into application performance, user experiences, and business outcomes.
Pros and Cons
Pros:
- Wide range of integrations.
- Powerful analytics engine.
- Comprehensive, end-to-end performance monitoring.
Cons:
- Customization can require some technical know-how.
- The user interface can be complex for new users.
- Higher starting price compared to some competitors.

New Relic is an observability platform that helps businesses analyze, troubleshoot, and optimize their software stack. The platform combines telemetry data with applied intelligence to provide insights that can improve application performance and user experience.
Pros and Cons
Pros:
- Unified dashboards for improved visibility.
- A wide array of integrations.
- Full-stack observability with applied intelligence.
Cons:
- Customer support could be more responsive, according to some users.
- Some features may have a steep learning curve.
- High starting price.

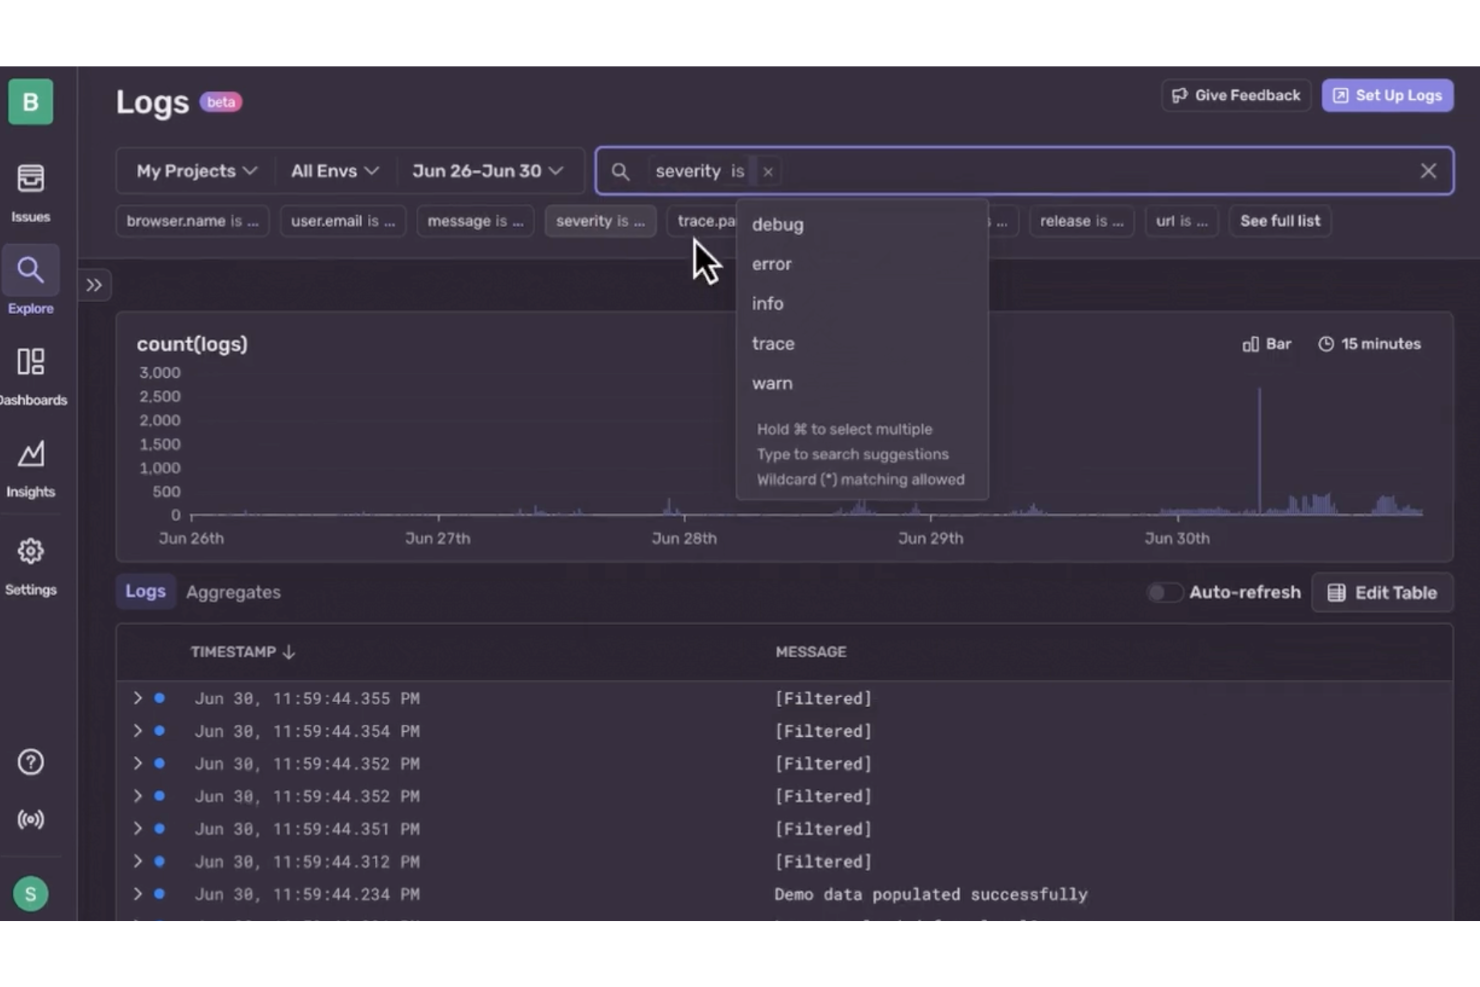
Better Stack offers a current, powerful log management solution that enables engineers to visualize, analyze, and understand their log data more effectively.
Pros and Cons
Pros:
- A broad range of integrations supporting various environments and languages.
- Extensive search capabilities for specific data analysis.
- Real-time log tailing for immediate insights.
Cons:
- The user interface might take some time to get used to for beginners.
- It may have more features than are needed for smaller projects.
- Higher starting price compared to other tools.
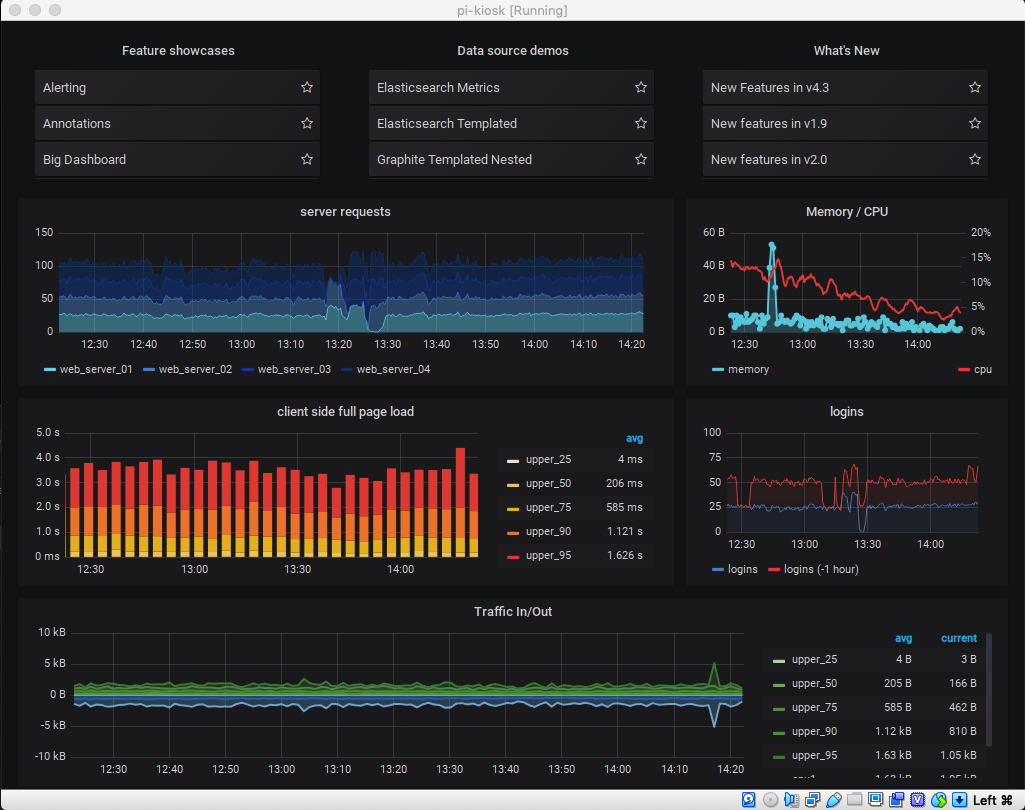
Grafana offers a robust, interactive visualization platform for all your metric data. It shines in its ability to pull in data from various sources, presenting it in a single, unified dashboard that's customizable and interactive.
Pros and Cons
Pros:
- Offers powerful alerting mechanisms.
- Highly customizable and interactive dashboards.
- Supports a wide array of data sources.
Cons:
- Some users need help with complex query construction.
- The interface can be overwhelming due to the number of features.
- It could have a steep learning curve for non-tech users.

Graylog is an open-source log management tool designed to analyze and visualize machine data at scale. This powerful solution can handle the large volumes of log data businesses generate and process in real-time.
Pros and Cons
Pros:
- Customizable dashboards and alerts.
- Powerful real-time analysis capabilities.
- Excels in managing large-scale log data.
Cons:
- Pricing is based on log volume, which can escalate costs.
- The open-source version lacks some enterprise features.
- The interface might seem complex for first-time users.
Other Sumo Logic Alternatives
Here are some additional Sumo Logic alternatives that didn’t make it onto my shortlist, but are still worth checking out:
- Logz.io
For cloud-native organizations valuing AI-powered insights
- LogRhythm
For enterprises requiring advanced security information and event management
- Dynatrace
For organizations prioritizing AI-assistance in software intelligence
- Datadog
For those who need unified metrics, traces, and logs
- Hosted Graphite
Good for detailed metrics visualization and alerting
- Coralogix
Good for automated anomaly and trend detection in logs
- Loggly
Good for troubleshooting with centralized log analysis
- LogEntries
Good for real-time log data search, visualization, and alerting
- Logstash
Good for dynamic data collection and enrichment pipeline
- Moogsoft
Good for reducing noise in IT alerts with AI-driven insights
- Amazon CloudWatch
Good for monitoring AWS resources and applications in real-time
- IBM Instana Observability
Good for real-time application performance monitoring
- LogPoint
Good for compliance management and proactive threat hunting
- IBM Security QRadar Suite
Good for centralized security incident detection and response
- Fluent Bit
Good for lightweight log processing and forwarding
- Trellix Security Manager
Good for threat intelligence and management across large enterprise networks
- NXLog
Good for multi-platform log collection and routing


Other Software Reviews
How I Evaluate Sumo Logic Alternatives
I split my evaluation into two layers: the baseline capabilities every viable tool must have, and the differentiators that matter most for teams drowning in cloud logs or chasing down incident root causes.
Core Functionality (Table Stakes For This List)
When I'm selecting tools for my list, I rank each one on a scale from 0 (does not offer the functionality) to 5 (excels in this area) for each core functionality listed below. Then, I calculate the tool's total score into a percentage. Each tool needs to achieve a minimum total score of 75% to be considered for inclusion.
- Log Aggregation & Ingestion: I evaluate how many sources a tool can ingest from out of the box—think Kubernetes pods, cloud VPCs, containerized apps, and legacy syslog servers all feeding into one pipeline.
- Real-Time Search & Query: Fast, expressive querying matters when you're mid-incident. I check how each tool handles complex queries across large datasets and whether its query language supports parsing, filtering, and aggregation.
- Metrics & Observability: I look for unified views that bring logs, metrics, and traces together. A tool that forces you to pivot between disconnected dashboards to correlate a latency spike with an error log slows down troubleshooting.
- Alerting & Anomaly Detection: Good alerting goes beyond static thresholds. I evaluate whether each tool offers ML-based anomaly detection and flexible routing to channels like Slack, PagerDuty, or webhook endpoints.
- Security Analytics & SIEM: For SecOps teams, I check whether the platform supports threat detection, event correlation, and compliance reporting for frameworks like SOC 2, HIPAA, or PCI-DSS.
- Cloud-Native & Integrations: Each tool should plug into the ecosystems teams already use. I look for pre-built integrations with AWS, Azure, GCP, and common DevOps toolchains alongside open API access.
Once I have a list of tools that meet this criteria, I consider what sets each platform apart.
Differentiating Factors (What Sets Vendors Apart)
Here's how I compare and contrast different vendors:
Standout Features
Distributed tracing is a big one—I look for native OpenTelemetry support that lets you follow a single request across dozens of microservices to isolate exactly where latency spikes. Customizable data tiers also matter because they directly affect cost; tools that offer hot, warm, and cold storage with rehydration give you more control over retention budgets. I also evaluate AI-powered insights, where platforms surface root causes or anomalies automatically instead of requiring manual query work during a 2 a.m. incident.
Beyond Features
Pricing model is one of the first things I evaluate. Log volumes can spike during incidents, so I check whether a vendor's billing structure penalizes you for those surges or offers predictable costs. Deployment flexibility matters too—teams in regulated industries often need self-hosted or air-gapped options alongside SaaS. I also look at scalability track records, since a platform that queries well at 500 GB per day may struggle at 5 TB. Compliance certifications like SOC 2 and HIPAA tell me whether a tool is enterprise-ready out of the gate.
Why Look For A Sumo Logic Alternative?
While Sumo Logic is a good choice of log management platform, there are a number of reasons why some users seek out alternative solutions. You might be looking for a Sumo Logic alternative because…
- Pricing doesn't scale well with high data volumes.
- Query performance slows down with large datasets.
- The UI can feel overwhelming to new users.
- Advanced features require a steep learning curve.
- Integration with some tools isn’t as smooth.
- Alerting options feel too limited for your needs.
If any of these sound like you, you’ve come to the right place. My list contains several log management platform options that are better suited for teams facing these challenges with Sumo Logic and looking for alternative solutions.
Sumo Logic Key Features
Here are some of the key features of Sumo Logic, to help you contrast and compare what alternative solutions offer:
- Role-based access control: Lets you set who can see or do what across your team.
- Log analytics: Lets you collect, search, and analyze log data across your systems.
- Real-time dashboards: Helps you monitor key metrics live so your team can react fast.
- Alerting: Notifies your team when something unusual or important happens in your data.
- Data archiving: Lets you store historical data for compliance or future analysis.
- Cloud-native architecture: Gives your team flexibility with scalable, cloud-based log management.
- Security analytics: Helps you detect threats or policy violations using your log data.
- Integrations: Connects with services like AWS, GCP, Azure, and Kubernetes easily.
- Query language: Lets you dig into data using a flexible and detailed search language.
- Machine learning insights: Surfaces patterns or anomalies that might need attention.
Summary
To wrap it up, selecting the best Sumo Logic alternative involves meticulous evaluation of different software based on the requirements and resources of your organization. From powerful full-stack observability to robust log management software to high-powered data collection, there are various facets to consider when looking for a tool that meets your business needs.
When choosing software for your business, evaluating your core requirements is essential. There's no one-size-fits-all solution, so it's crucial to identify what you need - whether it's robust log management, AI-assisted software intelligence, or full-stack observability.
Usability is another factor to consider. Even if a solution has advanced features, it might only be worth it if it’s easy to navigate and lacks efficient support. Please take a look at the onboarding process and customer support as well.
Lastly, remember to understand the pricing structure. The cost of these tools can vary significantly, so investing in a tool that delivers value for your investment is essential. Whether you have a tight budget or a sizeable one, there are alternatives to Sumo Logic that can cater to your needs without breaking the bank.
What do you think?
We’re always eager to learn about new tools in the ever-evolving tech landscape. Feel free to reach out if you think we've missed a Sumo Logic alternative that deserves to be on this list. We are happy to explore your suggestions and potentially include them in future updates. Your contribution can make this guide even more valuable for readers like you seeking the most effective tools in the market.