12 beste DevOps-Monitoring-Tools im Test für 2026

12 Beste DevOps-Überwachungstools Übersicht
Here's my pick of the 12 best software from the 22 tools reviewed.


Das Management einer DevOps-Pipeline ist keine leichte Aufgabe. Für Stabilität in der Produktion zu sorgen, Leistungsengpässe zu verfolgen und Ausfallzeiten zu verhindern, kann ein überwältigender Druck sein, damit alles reibungslos läuft. Vielleicht hast du selbst schon frustrierende Verzögerungen erlebt, die durch unentdeckte Probleme verursacht wurden, oder hast mit Tools gekämpft, die sich nicht nahtlos in deine Workflows integrieren lassen. Die Realität ist: Ohne die passenden DevOps-Überwachungstools wird es mühsam, Prozesse effizient zu halten und ein hervorragendes Nutzererlebnis zu bieten.
DevOps-Überwachungstools bieten Einblick in deine Systeme und helfen dir, potenzielle Probleme zu erkennen und zu lösen, bevor sie sich auf deine Nutzer auswirken. Sie sind unverzichtbar, um einen reibungslosen Betrieb zu gewährleisten, die Performance zu optimieren und dafür zu sorgen, dass dein Team sich auf Innovation statt auf Krisenmanagement konzentrieren kann. Über die Jahre habe ich zahlreiche Überwachungslösungen bei großen Projekten und in diversen Teams eingesetzt. In diesem Leitfaden teile ich meine besten Empfehlungen und Einblicke, um dir bei der Auswahl des idealen Tools zu helfen, mit dem du deine Prozesse optimieren und Systeme auf Höchstleistung halten kannst.
Table of Contents
Why Trust Our Software Reviews
We’ve been testing and reviewing software since 2023. As tech leaders ourselves, we know how critical and difficult it is to make the right decision when selecting software.
We invest in deep research to help our audience make better software purchasing decisions. We’ve tested more than 2,000 tools for different tech use cases and written over 1,000 comprehensive software reviews. Learn how we stay transparent & our software review methodology.
Beste DevOps-Überwachungstools Zusammenfassung
| Tool | Best For | Trial Info | Price | ||
|---|---|---|---|---|---|
| 1 | Best for SSL certificate monitoring | Free plan + free demo available | From $8/10 monitors/month (billed annually) | Website | |
| 2 | Best for real user monitoring | 30-day free trial + free demo available | From $10/month (billed annually) | Website | |
| 3 | Best for multi-cloud monitoring | 30-day free trial + free demo + free plan availabl | From $199/year | Website | |
| 4 | Best for real-time infrastructure insights | 14-day free trial + free plan + free demo available | From $4.50/node/month (billed annually) | Website | |
| 5 | Best for end-to-end performance monitoring for large businesses | 15-day free trial | From $7/month | Website | |
| 6 | Best for monitoring server disruptions and outages | 14-day free trial + free plan + free demo available | From $21/user/month | Website | |
| 7 | Best for continuous monitoring of large port networks | Free plan and free demo available | From $2,595 (perpetual license for 100 nodes) | Website | |
| 8 | Best for performance monitoring for websites and mobile | Free trial available | Pricing upon request | Website | |
| 9 | Best for SaaS full-stack observability | Free trial + free demo available | Pricing upon request | Website | |
| 10 | Best for monitoring and searching through big data | 14-day free trial + free demo available | Pricing upon request | Website | |
| 11 | Best for alerts and aggregating metrics | Free-forever plan available | Free to use | Website | |
| 12 | Best for monitoring data analytics and visualization | Free plan available | From $19/month | Website |
-

Site24x7
Visit WebsiteThis is an aggregated rating for this tool including ratings from Crozdesk users and ratings from other sites.4.7 -
GitHub Actions
Visit WebsiteThis is an aggregated rating for this tool including ratings from Crozdesk users and ratings from other sites.4.8 -
Docker
Visit WebsiteThis is an aggregated rating for this tool including ratings from Crozdesk users and ratings from other sites.4.6


Beste DevOps-Überwachungstools Bewertung
Hier folgt ein Überblick über die besten DevOps-Überwachungstools. Ich hebe die Funktionen jedes Tools hervor und erkläre, warum es einen Platz auf dieser Liste verdient.

For DevOps teams seeking a dependable monitoring solution, UptimeRobot offers a practical option that supports SSL certificate monitoring alongside uptime checks. It suits teams of all sizes, from solo operators to larger organizations, that need visibility into service availability and endpoint performance. By helping teams detect issues such as certificate expirations, downtime, and slow response times, UptimeRobot supports stable operations and consistent service delivery.
Why I Picked UptimeRobot
I picked UptimeRobot for its SSL certificate monitoring, which helps DevOps teams avoid issues caused by expired or misconfigured certificates. It tracks certificate status and sends alerts before expirations occur, reducing the risk of access warnings or service interruptions. UptimeRobot also provides downtime alerts through integrations like Slack and PagerDuty, making it easier for teams to respond quickly and keep services reliable.
UptimeRobot Key Features
In addition to SSL certificate monitoring, UptimeRobot offers:
- Multi-location Checks: Monitor your services from multiple global locations to ensure worldwide accessibility.
- Response Time Monitoring: Track how quickly your server responds to provide insights into performance bottlenecks.
- Customizable Status Pages: Share real-time status updates with users through branded status pages.
- Incident Management: Efficiently manage and resolve incidents with customizable alerts and team access levels.
UptimeRobot Integrations
Integrations include Slack, PagerDuty, Microsoft Teams, Telegram, Discord, Splunk On-Call, and more, allowing seamless alert management across your preferred communication platforms.
Pros and Cons
Pros:
- Supports multiple alert channels
- SSL monitoring helps maintain website security efficiently
- Real-time alerts ensure quick response to downtime issues
Cons:
- Not suited for complex DevOps stacks
- Limited customization in notification settings compared to competitors

Site24x7 is a cloud-based monitoring solution designed for DevOps and IT operations teams. It offers comprehensive monitoring capabilities for websites, servers, networks, applications, and cloud services. With Site24x7, you can gain real-time insights into your IT infrastructure's performance and health.
Why I Picked Site24x7: I like its application performance monitoring (APM) feature. This tool helps you identify and troubleshoot performance issues in your applications by providing detailed insights into transaction traces, database queries, and application components. Another valuable feature is real user monitoring (RUM). RUM allows you to track and analyze the experiences of actual users on your websites and web applications. By understanding how users interact with your services, you can make informed decisions to improve usability and performance.
Site24x7 Standout Features & Integrations
Features include synthetic web transaction monitoring, which lets you simulate user interactions to identify potential issues before they affect real users. Additionally, network monitoring provides visibility into the health of your network devices, helping you maintain reliability. Log management is another feature that enables you to collect and analyze logs from various sources, facilitating efficient troubleshooting and issue resolution.
Integrations include ServiceNow, PagerDuty, Jira, Microsoft Teams, Slack, Nagios, AWS, Azure, Google Cloud Platform, Docker, Jenkins, and Kubernetes.
Pros and Cons
Pros:
- Comprehensive monitoring for various systems
- Customizable dashboards and reports
- Offers real-time alerts across various channels
Cons:
- Complexity in initial setup for large environments
- Excessive alerts can be overwhelming for users
New Product Updates from Site24x7

Site24x7 Enhances Network Monitoring With Device and Visibility Updates
Site24x7 introduces proactive hardware health monitoring, expanded device support, centralized network controls, and enhanced SD-WAN visualization to improve network monitoring and management. For more information, visit Site24x7’s official site.
 .
.
ManageEngine Applications Manager is a comprehensive tool that offers multi-cloud monitoring, allowing users to monitor, manage, audit, and secure their multi-cloud and hybrid infrastructure. Its unique selling point lies in its ability to provide a unified solution for monitoring and managing multi-cloud environments, making it the best choice for businesses looking to streamline their multi-cloud monitoring efforts.
Why I Picked ManageEngine Applications Manager: ManageEngine Applications Manager excels by offering robust features that facilitate continuous monitoring, performance analysis, and troubleshooting across the entire DevOps pipeline. It supports a proactive approach to incident management, enables automation of routine checks, and provides detailed analytics to improve decision-making. Its ability to seamlessly integrate with various development, testing, and deployment tools makes it a valuable asset for DevOps teams aiming for high efficiency and minimal downtime.
ManageEngine Applications Manager Standout Features & Integrations
Features include extensive out-of-the-box support for monitoring more than 100 applications and servers, ranging from databases, web servers, application servers, and virtual servers, to cloud platforms, containers, and microservices architectures. Plus, ManageEngine Applications Manager incorporates advanced root cause analysis features powered by machine learning algorithms.
Integrations include Amazon Web Services (AWS), Microsoft Azure, Google Cloud Platform, Oracle Database, MySQL, Microsoft SQL Server, VMware, Docker, Apache Tomcat, and Redis.
Pros and Cons
Pros:
- Automated anomaly detection and alerting mechanisms
- Customizable dashboards and reports for insightful analytics
- Comprehensive monitoring capabilities across applications, servers, and cloud environments
Cons:
- The cost may be prohibitive for small to medium-sized enterprises
- Can be complex to set up and customize for specific needs
New Product Updates from ManageEngine Applications Manager
ManageEngine Applications Manager Adds Veeam Monitoring
ManageEngine Applications Manager adds Veeam Enterprise Manager monitoring. This update enables tracking of backup infrastructure, job performance, and storage usage. For more information, visit ManageEngine’s official site.
 .
.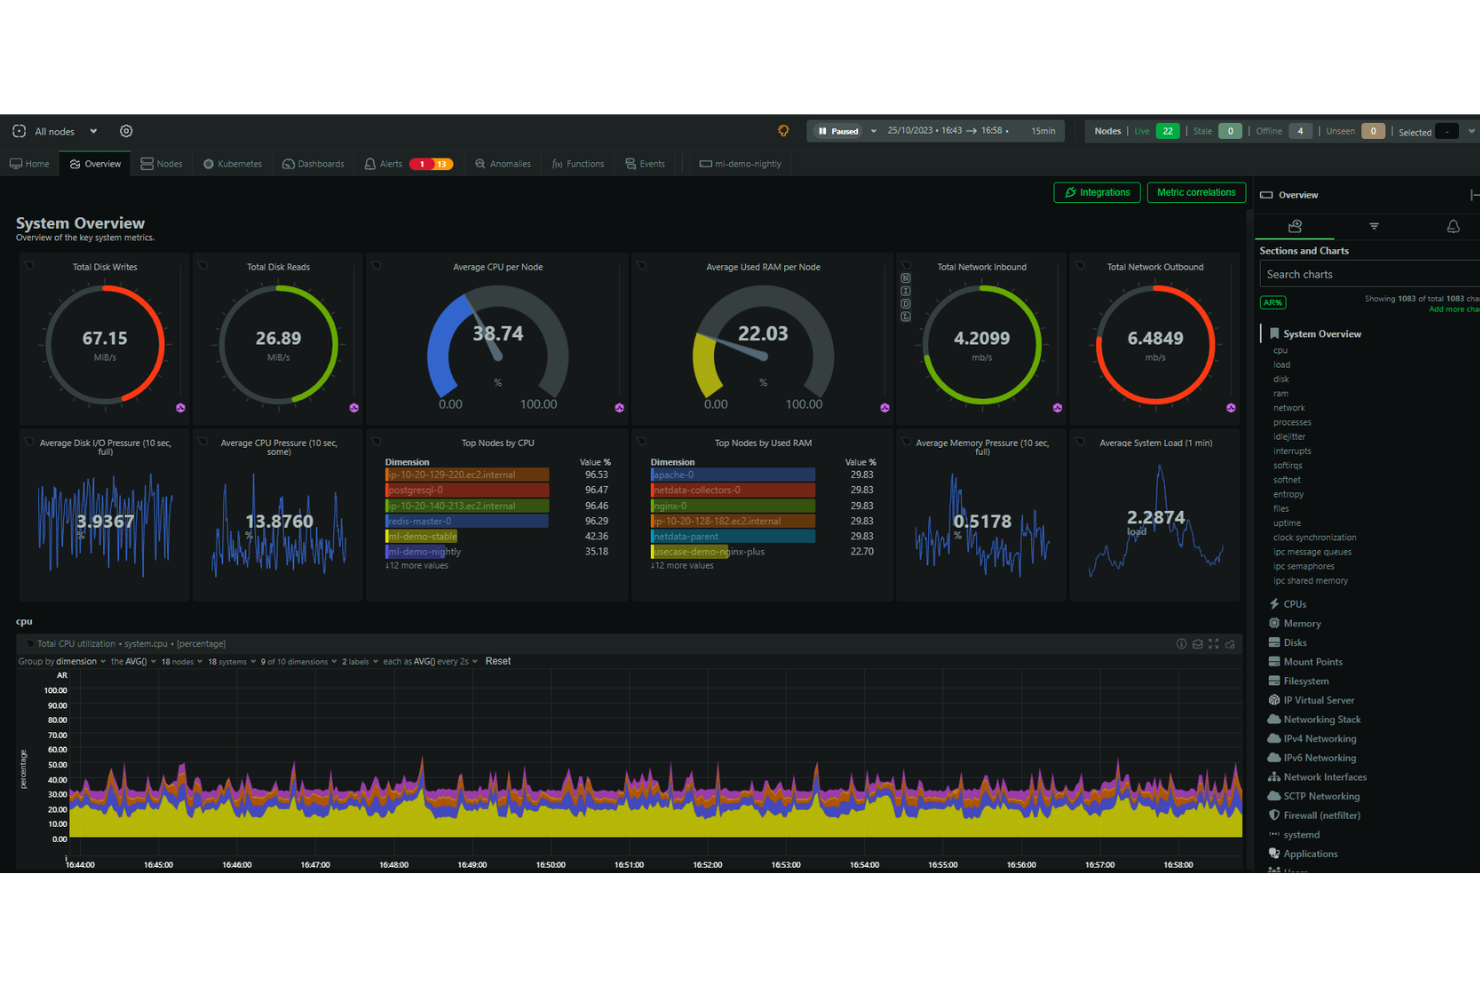
Netdata is an open-source monitoring and troubleshooting platform that offers high-resolution metrics, journal logs, and real-time visualizations for system monitoring. It aims to provide a cost-effective and user-friendly alternative to more expensive and complex platforms.
Why I Picked Netdata: I like that the platform emphasizes high-fidelity data and provides real-time visualizations, enabling users to monitor system performance and health with precision. It also simplifies and enhances the monitoring process for DevOps with features for collecting, storing, querying, visualizing, and alerting for a wide range of metrics. Netdata can be run on multiple nodes, and each instance of Netdata is capable of autonomous operation.
Netdata Standout Features & Integrations
Features include alerts to notify users of any issues detected within the system, automatic anomaly detection, and automated and customizable dashboards. Additionally, the core of the Netdata ecosystem is open-source, and it includes all the monitoring features such as the database, query engine, scoring engine, health engine, and machine learning engine.
Integrations include Containers, Kubernetes Containers, Virtual Machines, Apache, Consul, Elasticsearch, OpenSearch, MySQL, Redis, Squid log files, Windows, macOS, and hundreds more.
Pros and Cons
Pros:
- Interactive graphs for data visualization
- Unlimited metric monitoring
- Automated alerts
Cons:
- Insights could be more comprehensive
- May come with a learning curve to maximize its features
Best for end-to-end performance monitoring for large businesses

Dynatrace is an application performance monitoring (APM) that uses a built-in AI solution to help DevOps teams pinpoint performance issues. It excels in monitoring multi-platform environments, including multi-cloud, containers, microservices, and user experience.
Why I picked Dynatrace: I picked Dynatrace for its in-depth performance monitoring, which is ideal for large businesses. It offers granular visibility into customers, hybrid environments, and all aspects of your infrastructure.
Dynatrace Standout Features & Integrations:
Features I liked were those that prioritize performance capabilities, such as infrastructure monitoring and application monitoring. Additionally, Dynatrace leverages AI to continuously search for performance issues and pinpoint the root cause.
Integrations that Dynatrace partners with include Akamas, GitLab, Gremlin, NeoLoad, LaunchDarkly, xMatters, JFrog, and PagerDuty using built-in integrations.
Pros and Cons
Pros:
- Very active help support desk which can answer any questions if stuck
- Broad observability scope, which hits down to the code level
- Leverages an AI assistant to enhance troubleshooting and help with problem resolution
Cons:
- Price makes it a downside for many small to mid-sized companies
- Learning curve for operating Dynatrace effectively

PagerDuty is an incident response platform that sends alerts when there's a service disruption or outage. During critical moments, it can send email notifications, SMS notifications, and phone notifications to your development team or customer base.
Why I picked PagerDuty: I picked PagerDuty because it's an excellent tool if you're running mission-critical infrastructure that you want to keep tabs on. The platform enables you to get on-call alert notifications immediately.
PagerDuty Standout Features & Integrations:
Features that stood out to me as the most useful are 100% focused on alerting teams in case systems, nodes, or application services go awry and include email alerts, mobile alerts, root cause analysis, real-time notifications, and prioritization. You can also automatically schedule and escalate issues.
Integrations include pre-built plugins AWS, ServiceNow, Salesforce, Zendesk, Atlassian, Datadog, Slack, Splunk, and more.
Pros and Cons
Pros:
- Filters notifications to prioritize high-profile alerts that indicate genuine threats while reducing false alarms
- Customizable alerts can be sent via email, phone, SMS, or push notifications
- Allows you to allocate incident response to the right person or team
Cons:
- Uses a conventional dashboard that could be more customizable for specific needs and preferences
- Looking for historical alerts can be difficult unless you have an exact ID

Nagios is an open-source software application that monitors traffic networks continuously. It can track per-port bandwidth usage for inbound and outbound traffic, detect network outages, identify overutilized ports, and discover network abusers.
Why I picked Nagios: Instead of exposing my systems to vulnerabilities or worrying about slow network performance, Nagios gives my DevOps team immediate visibility of our network. I also liked it that logs information like network infrastructure issues and failed processes by the port.
Nagios Standout Features & Integrations
Features offered by Nagios ensure the security of my network ports. This includes SNMP monitoring, switch and router monitoring, network monitoring, and ping monitoring, which help me maintain the integrity and safety of my network infrastructure.
Integrations that are pre-built include Amazon SNS, Prometheus, PagerDuty, Dynatrace, and more. Also, Nagios has over 3,000 official and community plugins developers can add to their stack.
Pros and Cons
Pros:
- Increases the availability of your entire network infrastructure for protocol failures and network outages
- Lightweight for minimal resource usage
- Open-source version is 100% free
Cons:
- Uses files instead of databases to store config files on the backend
- Separate licenses are required for security and network visibility features

AppDynamics is a full-stack application performance management tool. It utilizes machine learning algorithms to detect performance issues, compares them to baseline metrics, and triggers alerts when necessary.
Why I picked AppDynamics: I picked AppDynamics because it focuses on application performance while also using monitoring to ensure optimal user experience. Whether you're managing a website or mobile app, AppDynamics ensures your customers don't encounter issues like timeouts or slow page load times.
AppDynamics Standout Features & Integrations:
Features I found that make AppDynamics excellent for performance monitoring include application performance monitoring (APM) and infrastructure visibility with database visibility. Additionally, end-user monitoring also caught my eye as it ensures your clients get the fastest application speeds possible.
Integrations that AppDynamics partners with include pre-built plugins like LoadRunner, Sainapse, and NeoLoad for performance and continuous delivery. AppDynamics also partners with SquaredUp, Medallia, and Quantum Metric to monitor customer experience.
Pros and Cons
Pros:
- Network visibility allows you to see the amount of bandwidth used per node
- Depth of monitoring of web applications and infrastructure is immense
- Gives real-time info on processes that consume CPU and memory
Cons:
- No automatic application scanning; they must be defined in a config file
- Functionality may be overwhelming for small businesses

New Relic is a web tracking and analytics tool that monitors the real-time observability of each application component distributed across databases and servers.
Why I picked New Relic: I picked New Relic because it provides an "all-in-one" solution that monitors and analyzes all aspects of your technology stack. Having complete end-to-end visibility allows teams to get actionable insights when problems arise and promptly address and resolve them.
New Relic Standout Features & Integrations:
Features I found that make New Relic great for full-stack monitoring include application monitoring and database monitoring. Additionally, there’s availability monitoring to ensure your systems work in public or private locations around the clock.
Integrations are available with pre-built plugins such as AWS, Kubernetes, Azure, Google Cloud Platform, and Prometheus. You can also use native integrations like SQL Server to send queries to New Relic.
Pros and Cons
Pros:
- Easy agent installation that allows you to pipe data on your dashboard within minutes
- Provides insights into metrics and performance even under high load and stress
- Highly feature-rich and provides the ability to write custom queries against collected instrumentation data
Cons:
- The interface can be a little tricky due to the number of options on the screen
- Cost can be considered high, especially for startups and even mid-sized companies

Splunk is a software tool that captures and indexes data, organizing it in a searchable repository. It enables the generation of alerts, reports, and visualizations from large datasets.
Why I picked Splunk: I picked Splunk because of its ability to scale and handle large volumes of data. With the increasing complexity of modern applications and distributed systems, Splunk's scalability ensures you can effectively manage and analyze logs from multiple sources without compromising performance.
Splunk Standout Features & Integrations:
Features of Splunk are designed to provide teams with greater visibility into their applications. I believe its indexing and data collection, workload management capabilities, machine learning toolkit, and intuitive data exploration tools make it a great tool for teams.
Integrations are available with pre-built plugins via Docker, Jenkins, Kubernetes, Ansible, AWS, Azure, and ServiceNow. Additionally, Splunk gives information about each integration's capabilities, allowing you to see whether your integrations can provide you with traces, logs, metrics, or metadata with Splunk.
Pros and Cons
Pros:
- Creates analytical reports and visualizes data with charts, graphs, and tables
- Highly scalable and easy to implement
- Saves your searches and automatically recognizes important data
Cons:
- Visit WebsiteOpens new window
- Optimizing searches for speed can be difficult
- Can be costly, especially if your services require intensive resources

Prometheus is an open-source systems monitoring and alert tool to collect and store metrics. It helps you monitor critical time series data, such as memory consumption, resource utilization, error rates, and incoming requests.
Why I picked Prometheus: I picked Prometheus because of how well it excels at collecting, storing, and querying metrics from HTTP endpoints. It allows you to easily expose, scrape, and query data to let you know if your infrastructure or services are working or not.
Prometheus Standout Features & Integrations
Features that make Prometheus one of the best tools on the market are its alerts and data aggregation. I can benefit from log monitoring, alert monitoring, time series collection, and metric storage and observation.
Integrations mostly include pre-built remote endpoint and storage platforms, such as Elasticsearch, InfluxDB, and Kafka. It's also possible to integrate Alertmanager webhooks for notifications on applications like Discord, GitLab, and Zoom.
Pros and Cons
Pros:
- Customizable alerts
- Intuitive metric patterns for easy data querying
- Uses pull metrics to parse data without installing additional programs on your containers
Cons:
- May need to learn PromQL to query metrics.
- The documentation may lack clarity or be confusing at times

Grafana is an open-source data analytics web application that allows you to monitor important infrastructure on servers, software applications, and various services. It provides DevOps teams with the ability to visually analyze data from multiple sources, enabling them to easily filter through information.
Why I picked Grafana: I picked Grafana because it provides DevOps teams with customizable dashboards that you can modify to fit specific needs. The tool supports a variety of visualizations, including heat maps, graphs, tables, and text panels.
Grafana Standout Features & Integrations:
Features that stood out to me focused on visualization, such as dashboard templating, node graphs, status history, and times series. These features also offer panel customizations that put data sources and queries on display.
Integrations that Grafana is able to parse data sources from include pre-built plugins, including Prometheus, AWS, Azure DevOps, Cloudflare, Elastic, and Humio.
Pros and Cons
Pros:
- Extensive customization options for alerts, data sources, notifications, and more
- Has the capability to retrieve data from any data source, regardless of its origin or format
- Offers highly configurable and customizable visualization panels
Cons:
- Garfana has no means to store and collect data on its own
- BI dashboards can be difficult to create and may require the use of plugins
Weitere DevOps-Überwachungstools
Hier findest du einige weitere Tools, die es zwar nicht unter die Top 12 geschafft haben, aber dennoch einen Blick wert sind:
- Buddy
For monitoring websites and mobile apps for small businesses
- InfluxDB
For monitoring time series data in a single, multi-purpose database
- Sensu
For monitoring cloud environments
- ChaosSearch
For centralizing log and event data in the cloud
- Dotcom Monitor
For monitoring critical workflows
- Datadog
Datadog
- Zabbix
For network parameter monitoring
- Jenkins
For executing monitoring scripts
- Honeycomb
For observing code on live applications
- Icinga
For checking the availability of network resources


Ähnliche Software- & Tool-Bewertungen
Falls du hier noch nicht fündig geworden bist, sieh dir gern auch diese anderen Tool-Arten an, die wir für dich getestet und bewertet haben.
- Netzwerk-Monitoring-Software
- Server-Monitoring-Software
- SD-Wan-Lösungen
- Infrastruktur-Überwachungstools
- Packet Sniffer
- Anwendungsüberwachungs-Tools
Kriterien für die Auswahl von DevOps-Überwachungstools
Bei der Auswahl der besten DevOps-Überwachungstools für diese Liste habe ich gängige Bedürfnisse und Probleme von Käufern berücksichtigt – wie etwa das Management komplexer Infrastrukturen und die Sicherstellung der Echtzeit-Erkennung von Problemen. Außerdem habe ich das folgende Bewertungsschema genutzt, um objektiv und fair zu bewerten:
Kernfunktionen (25% der Gesamtbewertung)
Um überhaupt für diese Liste in Frage zu kommen, musste jede Lösung folgende Anwendungsfälle abdecken:
- Systemleistung überwachen
- Probleme erkennen und benachrichtigen
- Echtzeit-Einblicke bieten
- Anwendungszustand überwachen
- Integration mit anderen Tools ermöglichen
Zusätzliche besondere Merkmale (25% der Gesamtbewertung)
Um die Auswahl weiter einzugrenzen, habe ich zudem nach besonderen Funktionen gesucht, zum Beispiel:
- KI-gesteuerte Analytik
- Anpassbare Dashboards
- Predictive-Maintenance-Funktionen
- Plattformübergreifende Kompatibilität
- Erweiterte Sicherheitsfunktionen
Benutzerfreundlichkeit (10% der Gesamtbewertung)
Um einen Eindruck von der Benutzerfreundlichkeit jedes Systems zu bekommen, habe ich Folgendes berücksichtigt:
- Intuitive Benutzeroberfläche
- Leichte Navigation
- Anpassungsmöglichkeiten
- Leistungsfähigkeit (Geschwindigkeit)
- Geringe Lernkurve
Onboarding (10% der Gesamtbewertung)
Um das Onboarding-Erlebnis jeder Plattform zu bewerten, habe ich Folgendes berücksichtigt:
- Verfügbarkeit von Schulungsvideos
- Interaktive Produkttouren
- Umfassende Dokumentation
- Zugang zu Webinaren
- Unterstützende Community-Foren
Kundensupport (10% der Gesamtbewertung)
Um die Supportleistungen jedes Softwareanbieters zu beurteilen, habe ich Folgendes berücksichtigt:
- Verfügbarkeit von 24/7-Support
- Reaktionsschnelligkeit bei Anfragen
- Qualität der Supportdokumentation
- Zugang zu Live-Chat
- Verfügbarkeit eines dedizierten Account-Managers
Preis-Leistungs-Verhältnis (10% der Gesamtbewertung)
Um das Preis-Leistungs-Verhältnis jeder Plattform zu beurteilen, habe ich Folgendes berücksichtigt:
- Wettbewerbsfähige Preisgestaltung
- Flexibilität bei Preismodellen
- Gebotene Funktionen pro Preisstufe
- Rabatte bei jährlicher Bindung
- Verfügbare Testzeiträume
Kundenbewertungen (10% der Gesamtbewertung)
Um die allgemeine Kundenzufriedenheit zu erfassen, habe ich beim Lesen von Kundenbewertungen auf Folgendes geachtet:
- Allgemeine Zufriedenheitsbewertungen
- Häufig genannte Vor- und Nachteile
- Feedback zur Wirksamkeit der Funktionen
- Erfahrungsberichte zum Support
- Empfehlungen zur Verbesserung
So wählen Sie DevOps-Monitoring-Tools aus
Es ist leicht, sich in langen Funktionslisten und komplizierten Preismodellen zu verlieren. Damit Sie bei Ihrem individuellen Auswahlprozess den Überblick behalten, hilft diese Checkliste mit wichtigen Faktoren:
| Faktor | Was ist zu beachten? |
|---|---|
| Skalierbarkeit | Stellen Sie sicher, dass das Tool steigende Arbeitslasten und mehr Nutzer ohne Performance-Einbußen bewältigen kann. Cloud-basierte Optionen mit automatischer Skalierung ermöglichen ein unkompliziertes Wachstum. |
| Integrationen | Prüfen Sie, ob das Tool mit Ihrem bestehenden DevOps-Stack kompatibel ist, einschließlich CI/CD-Pipelines, Cloud-Diensten und Incident-Response-Plattformen. |
| Anpassbarkeit | Suchen Sie nach Möglichkeiten, Monitoring-Einstellungen, Alarmschwellen und Dashboards an die Arbeitsabläufe und Prioritäten Ihres Teams anzupassen. |
| Benutzerfreundlichkeit | Das Tool sollte eine klare Oberfläche und intuitive Bedienelemente bieten, damit Ihr Team Probleme schnell erkennt und behebt. Komplizierte Setups können Reaktionszeiten verzögern. |
| Budget | Vergleichen Sie Abonnementkosten, Lizenzgebühren und Zusatzkosten für spezielle Funktionen oder größere Datenmengen. Achten Sie auf versteckte Kosten. |
| Sicherheitsvorkehrungen | Achten Sie auf Verschlüsselung, Zugriffskontrollen und gesicherte Datenübertragungen, um sensible Informationen zu schützen und Sicherheitsvorfälle zu verhindern. |
| Echtzeit-Benachrichtigungen | Das Tool sollte sofortige Benachrichtigungen bei Performanceproblemen oder Ausfällen senden, damit Ihr Team schnell reagieren und Ausfallzeiten minimieren kann. |
| Datenhaltung und Reporting | Stellen Sie sicher, dass das Tool historische Daten lange genug speichert, um Analysen und Trendidentifikation zu ermöglichen. Exportierbare Berichte sind für Team-Reviews hilfreich. |
Trends bei DevOps-Monitoring-Tools
Für meine Recherche habe ich zahlreiche Produkt-Updates, Pressemitteilungen und Release-Logs verschiedener Anbieter von DevOps-Monitoring-Tools ausgewertet. Hier sind einige der wichtigsten Trends, die ich aktuell beobachte:
Verbesserte Anomalie-Erkennung: Neue Machine-Learning-Modelle verbessern die Erkennung von Anomalien, sodass Teams Unregelmäßigkeiten in Echtzeit erkennen und Fehlalarme reduzieren können.
Vollständige Observability („Full-Stack-Überwachung“): Anbieter gehen über einfache Überwachung hinaus und bieten einen umfassenden Blick auf Infrastruktur, Anwendungen und Nutzererfahrung an einem Ort. Das erleichtert das Erkennen und Lösen von Problemen. Wenn Sie Observability-Plattformen vergleichen, achten Sie auf eine Lösung mit umfassenden Monitoring-Fähigkeiten.
KI-gesteuerte Einblicke: Immer mehr Tools nutzen Künstliche Intelligenz, um Daten zu analysieren und Leistungsprobleme vorherzusagen, bevor sie auftreten. Das ermöglicht es Teams, proaktiv zu handeln, statt nur auf Ausfälle zu reagieren.
Verteiltes Tracing: Tools erweitern ihre Funktionen um Tracing-Möglichkeiten, sodass Teams Anfragen über Microservices und Container hinweg nachverfolgen können. Das hilft, Verzögerungen oder Fehler gezielt zu lokalisieren.
Selbstheilende Systeme: Einige Tools bieten jetzt automatisierte Problemlösungen an, bei denen das System eigenständig Fehler erkennt und behebt – ganz ohne menschliches Eingreifen. Das verkürzt Ausfall- und Reaktionszeiten.
Was sind DevOps-Monitoring-Tools?
DevOps-Monitoring-Tools sind spezialisierte Softwarelösungen, die dazu entwickelt wurden, die Leistung und den Zustand von Anwendungen und Infrastruktur in Echtzeit zu überwachen und zu analysieren. Hauptsächlich werden sie von DevOps-Ingenieur:innen, Systemadministrator:innen und IT-Fachkräften eingesetzt, um einen reibungslosen Betrieb und die Auslieferung von Softwareprodukten sicherzustellen.
DevOps-Monitoring-Tools automatisieren den Überwachungsprozess, liefern Einblicke in die Systemperformance und erkennen sowie beheben Probleme schnell, bevor sie die Produktionsumgebung beeinträchtigen. Funktionen wie Echtzeit-Benachrichtigungen, Data Observability Tools und vorausschauende Analysen unterstützen proaktives Handeln und steigern die betriebliche Effizienz.
Funktionen
Hier sind einige der wichtigsten Funktionen, auf die ich bei der Bewertung von DevOps-Monitoring-Tools für meine Liste achte:
- Echtzeitwarnungen und Benachrichtigungen: Diese Funktion sorgt für sofortige Kenntnisnahme von auftretenden Problemen. Sie ist essenziell, um Probleme frühzeitig zu beheben und so größere Ausfälle zu verhindern.
- Umfassende Dashboards: Dashboards bieten eine zentrale Ansicht aller Metriken und Logs. Sie sind unerlässlich, um den Zustand der Entwicklungspipeline und der Anwendungen zu visualisieren, Trends zu erkennen und potenzielle Probleme frühzeitig zu identifizieren.
- Anpassbare Metriken: Anpassungsoptionen für die Überwachung spezifischer Kennzahlen. Durch maßgeschneiderte Metriken kann gezielter überwacht werden – so behalten Teams genau die Leistungsindikatoren im Blick, die für ihre Projekte entscheidend sind.
- Log-Management und Analyse: Effektives Log-Management und analytische Funktionen. Log-Analysen helfen bei der Fehlersuche und beim Verständnis des Anwendungsverhaltens – das ist entscheidend für Problemlösung und Optimierung.
- Skalierbarkeit: Die Möglichkeit, Überwachungslösungen mit wachsenden Projekten zu skalieren. Skalierbarkeit stellt sicher, dass das Monitoring-Tool auch bei steigender Auslastung leistungsfähig bleibt und keine Performance-Einbußen auftreten.
- Integrationsfähigkeit: Die Fähigkeit, sich mit einer Vielzahl von API-Monitoring-Tools und Plattformen zu verbinden. Das ermöglicht nahtlose Zusammenarbeit mit anderen Tools in der Entwicklungspipeline und erhöht die Effizienz sowie Datenkonsistenz im Workflow.
- Sicherheits- und Compliance-Funktionen: Integrierte Sicherheitsmechanismen und Compliance-Berichte. Diese Funktionen sorgen für den Schutz sensibler Daten und unterstützen die Einhaltung regulatorischer Anforderungen entlang der Entwicklungspipeline.
- Automatisiertes Incident-Management: Automatisierung des Incident-Response-Prozesses. Durch automatisches Management von Vorfällen reduzieren Teams Ausfallzeiten und verbessern die Reaktionszeiten – das führt zu zuverlässigeren Anwendungen.
- Cloud-native Unterstützung: Optimiert für die Überwachung cloudbasierter Umgebungen. Da viele Anwendungen heute in der Cloud laufen, sorgt native Unterstützung für effizientes und effektives Monitoring in diesen Umgebungen.
- End-to-End-Transparenz: Die Möglichkeit, alle Aspekte der Entwicklungspipeline zu überwachen. Diese Funktion bietet einen ganzheitlichen Überblick vom Code-Commit bis zum Deployment – entscheidend, um Auswirkungen von Änderungen zu verstehen und Engpässe zu erkennen.
Vorteile
Überwachungstools spielen eine entscheidende Rolle im DevOps-Ökosystem. Sie helfen nicht nur dabei, Probleme schnell zu erkennen und zu lösen, sondern liefern auch Einblicke, die zu fundierteren Entscheidungen und einer verbesserten Gesamtperformance führen können. Hier sind einige konkrete Vorteile dieser Tools für Ihr DevOps-Team:
- Verbesserte betriebliche Effizienz: DevOps-Monitoring-Tools automatisieren die Erfassung und Analyse verschiedener Metriken und Protokolle über die gesamte Entwicklungspipeline hinweg. Diese Automatisierung spart den Teams wertvolle Zeit, sodass sie sich auf strategischere Aufgaben statt auf manuelles Monitoring und Fehlersuche konzentrieren können.
- Erhöhte Systemzuverlässigkeit: Durch Echtzeit-Benachrichtigungen und Warnungen ermöglichen diese Tools den Teams, Probleme frühzeitig zu erkennen und zu beheben, bevor sie sich zu größeren Schwierigkeiten entwickeln. Diese unmittelbare Reaktionsfähigkeit reduziert Ausfallzeiten deutlich und stellt sicher, dass Systeme stabil und zuverlässig bleiben.
- Proaktive Problemlösung: Der Einsatz von vorausschauender Analytik und Anomalieerkennung hilft Unternehmen, Probleme bereits vor ihrem Auftreten zu erkennen. Durch die frühzeitige Identifikation potenzieller Probleme können Teams präventiv Lösungen einleiten, um Unterbrechungen zu verhindern und einen reibungslosen Betrieb aufrechtzuerhalten.
- Optimierte Leistung: Database DevOps Tools liefern Einblicke in die Performance von Anwendungen und Infrastruktur, erkennen Engpässe und Verbesserungsmöglichkeiten. Diese Informationen ermöglichen es den Teams, ihre Systeme für bessere Leistung zu optimieren und das Nutzererlebnis sowie die betriebliche Effizienz zu steigern.
- Verbesserte Sicherheitslage: Mit Funktionen, die auf die Überwachung von Sicherheitsmetriken und Compliance-Standards ausgerichtet sind, spielen diese Tools eine entscheidende Rolle bei der Identifizierung von Schwachstellen und der Einhaltung von bewährten Sicherheitspraktiken. Diese verstärkte Sicherheitslage schützt vor Sicherheitsverletzungen und stellt die Integrität der Daten und Systeme des Unternehmens sicher.
Kosten & Preise
Durch die Vielzahl an verfügbaren Tarifoptionen hilft das Verständnis für Preise und Funktionen dabei, eine fundierte Entscheidung zu treffen, die zu den eigenen Anforderungen und dem Budget passt. Von kostenlosen Versionen für kleine Projekte bis hin zu Enterprise-Tarifen mit fortgeschrittenen Funktionen gibt es Monitoring-Tools für jede Betriebsgröße.
Vergleichstabelle für DevOps Monitoring Tools
Nachfolgend eine detaillierte Übersicht der gängigen Tarifoptionen und Preise für DevOps Monitoring Tools, um insbesondere Neueinsteigern in dieser Softwarekategorie die Orientierung zu erleichtern.
| Tariftyp | Durchschnittlicher Preis | Übliche Funktionen |
|---|---|---|
| Gratis | $0 | Grundlegende Monitoring-Funktionen, begrenzte Metriken und Logs, Community-Support, Zugang zu Foren |
| Basic | $20-$50/user/month | Erweiterte Überwachungsfunktionen, mehr Metriken und Logs, E-Mail-Support, Integration mit anderen Tools |
| Standard | $50-$100/user/month | Vollständige Monitoring-Suite, fortschrittliche Analysen, 24/7-Support, anpassbare Dashboards, Integrationsoptionen |
| Premium | $100-$200/user/month | Premium-Funktionen einschließlich vorausschauender Analytik, maschinelles Lernen, dedizierter Support, individuelle Integrationen |
| Enterprise | Custom pricing | Alle Premium-Funktionen plus Skalierungsoptionen, persönlicher Account-Manager, Enterprise-Sicherheit |
DevOps Monitoring Tools FAQs
Hier finden Sie Antworten auf häufig gestellte Fragen zu DevOps-Monitoring-Tools:
Wie bewältigen DevOps-Monitoring-Tools groß angelegte Infrastrukturen?
Können DevOps-Monitoring-Tools die Performance in verschiedenen Umgebungen nachverfolgen?
Wie unterstützen DevOps-Monitoring-Tools bei der Incident-Response?
Was ist der Unterschied zwischen Infrastruktur-Monitoring und Application-Monitoring?
Wie können DevOps-Monitoring-Tools Fehlalarme reduzieren?
Unterstützen DevOps-Monitoring-Tools benutzerdefinierte Metriken?
Was kommt als Nächstes:
Wenn Sie sich gerade mit der Recherche von DevOps-Monitoring-Tools beschäftigen, verbinden Sie sich kostenlos mit einem SoftwareSelect-Berater für individuelle Empfehlungen.
Sie füllen ein Formular aus und führen ein kurzes Gespräch, in dem Sie Ihre spezifischen Anforderungen erläutern. Anschließend erhalten Sie eine Auswahlliste an Softwareoptionen zur Prüfung. Die Berater unterstützen Sie sogar im gesamten Kaufprozess – einschließlich Preisverhandlungen.