10 Best Cloud Infrastructure Monitoring Tools Of 2026

10 Best Cloud Infrastructure Monitoring Tools Shortlist


Keeping cloud infrastructure running smoothly isn’t just about uptime—it’s about catching performance issues before they impact users, ensuring scalability without waste, and maintaining visibility across complex environments. If you've ever struggled with unexplained slowdowns, unexpected outages, or a lack of real-time insights, you know how difficult it can be to stay ahead of problems without the right monitoring tools.
Cloud infrastructure monitoring tools provide a centralized way to track application performance, network activity, and resource utilization across cloud environments. Over the years, I’ve tested a wide range of these tools, evaluating how well they detect issues, reduce response times, and integrate with existing workflows. In this guide, I’ll break down the best options available, helping you find a solution that fits your cloud monitoring needs.
Table of Contents
Why Trust Our Software Reviews
We’ve been testing and reviewing software since 2023. As tech leaders ourselves, we know how critical and difficult it is to make the right decision when selecting software.
We invest in deep research to help our audience make better software purchasing decisions. We’ve tested more than 2,000 tools for different tech use cases and written over 1,000 comprehensive software reviews. Learn how we stay transparent & our software review methodology.
Best Cloud Infrastructure Monitoring Tools Summary
| Tool | Best For | Trial Info | Price | ||
|---|---|---|---|---|---|
| 1 | Best for synthetic transaction tests | 30-day free trial + free demo available | From $10/month (billed annually) | Website | |
| 2 | Best for application performance monitoring | 30-day free trial + free demo + free plan availabl | From $199/year | Website | |
| 3 | Best for hybrid IT infrastructure monitoring | Free 15-day trial | From $16/hybrid unit/month | Website | |
| 4 | Best for detailed health metrics | Free plan available | From $49/user/month | Website | |
| 5 | Best for Infrastructure as Code (IaC) approach | Yes | From $20/user/month | Website | |
| 6 | Best for IBM Cloud environment | No | From $10 per million metrics ingested/month | Website | |
| 7 | Good for unified application and infrastructure data | 30-day free trial available | From $7/node/month | Website | |
| 8 | Best for open-source cloud monitoring | Not available | From $1000 per month (billed annually) | Website | |
| 9 | Best for real-time observability | 14-day free trial | Pricing upon request | Website | |
| 10 | Best for visibility into every network path | 15-day free trial | From $20/user/month (billed annually) | Website |
-

Reftab
Visit WebsiteThis is an aggregated rating for this tool including ratings from Crozdesk users and ratings from other sites.4.7 -
Freshservice
Visit WebsiteThis is an aggregated rating for this tool including ratings from Crozdesk users and ratings from other sites.4.6 -
Deel IT
Visit WebsiteThis is an aggregated rating for this tool including ratings from Crozdesk users and ratings from other sites.4.9


Best Cloud Infrastructure Monitoring Tools Reviews
Below are my detailed summaries of the best cloud infrastructure monitoring tools that made it onto my shortlist. My reviews offer a detailed look at the key features, pros & cons, integrations, and ideal use cases of each tool to help you find the best one for you.
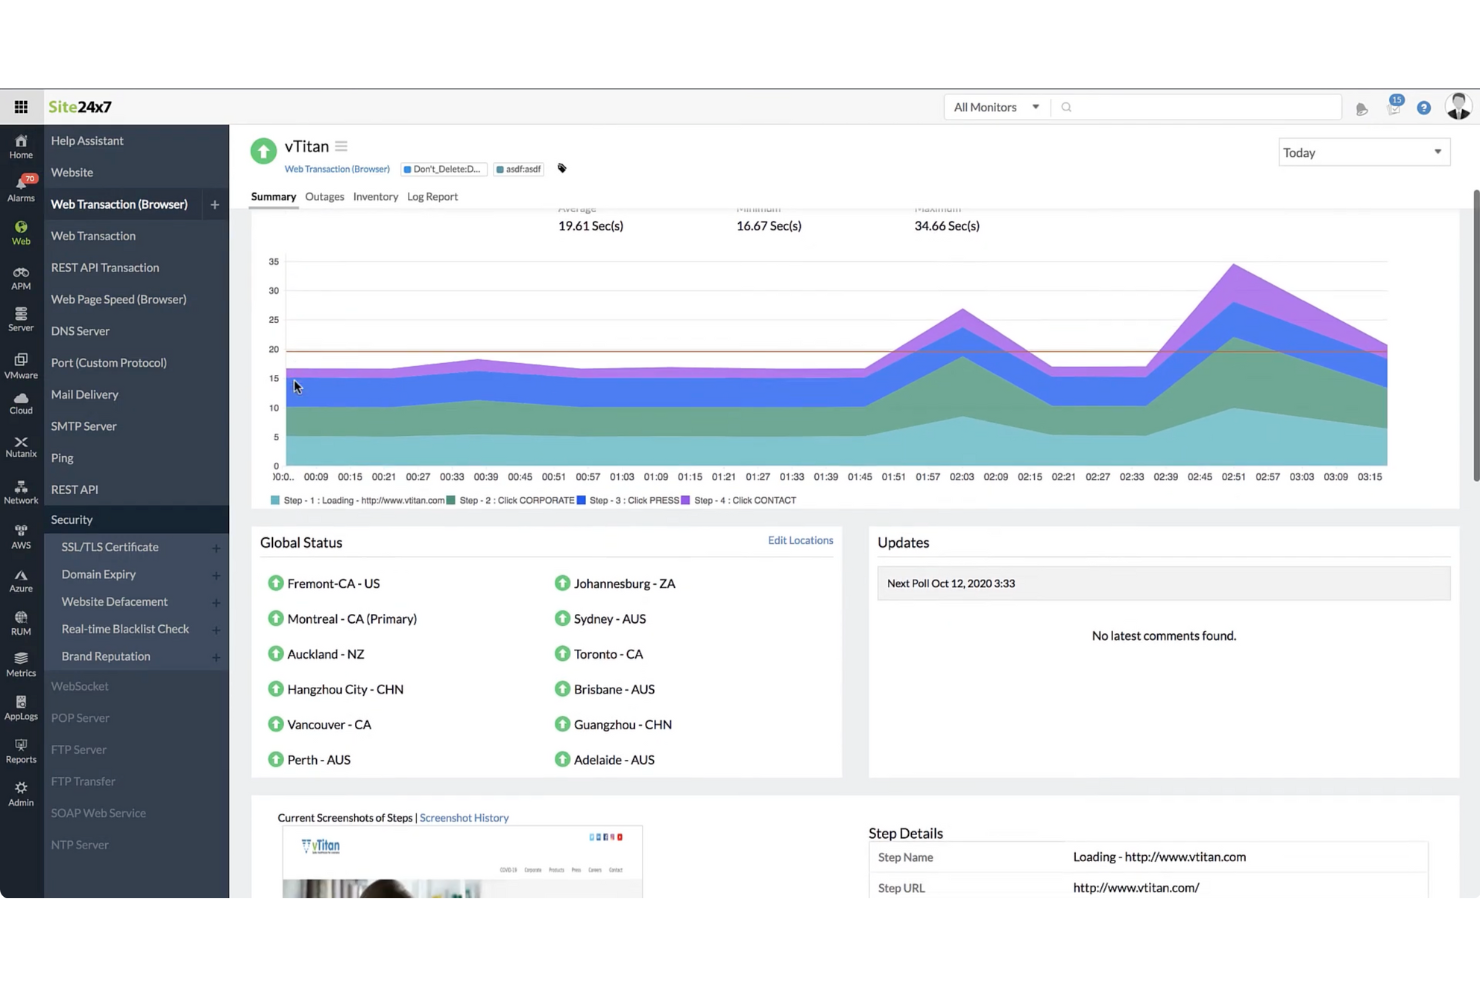
For businesses managing complex cloud infrastructure, Site24x7 offers a monitoring solution that includes synthetic transaction testing to help track service availability and performance. It serves IT teams and organizations that need clear visibility into their cloud environments, helping address issues such as performance slowdowns, resource use, and incident response. With coverage across major cloud platforms and a range of monitoring features, Site24x7 helps teams maintain stable operations and consistent user experience.
Why I Picked Site24x7
I picked Site24x7 for its synthetic transaction tests, which help monitor service availability by simulating user and system workflows. The platform also supports major cloud environments and includes application performance monitoring to track application behavior and identify issues. Its automation features assist with incident handling, helping teams respond faster and manage resources more effectively.
Site24x7 Key Features
In addition to synthetic transaction tests, Site24x7 offers:
- Real User Monitoring (RUM): This feature provides insights into the actual user experience by tracking and analyzing user interactions with your applications.
- Log Management: With this feature, you can aggregate and analyze logs from various sources to gain a comprehensive view of your system's health.
- Network Monitoring: It provides visibility into network performance, helping you troubleshoot connectivity issues and optimize your network infrastructure.
Site24x7 Integrations
Integrations include Slack, ServiceNow, Moogsoft, Jira, PagerDuty, Freshservice, Microsoft Teams, Amazon EventBridge, Zapier, and ManageEngine Analytics Plus.
Pros and Cons
Pros:
- AI-powered full-stack monitoring supports multicloud infrastructure management
- Comprehensive monitoring for various systems
- Flexible monitoring integrates easily with multiple infrastructure components
Cons:
- Alert bugs cause issues when adding new monitoring configurations
- Complex configuration slows initial setup and platform understanding
New Product Updates from Site24x7
Site24x7 Adds Synchronization Statuses for MSPs
Site24x7 now provides MSPs enhanced alerts and synchronization statuses in a centralized notification center to spot configuration sync issues sooner and accelerate incident response. For more information, visit Site24x7's official site.

Best for application performance monitoring

ManageEngine Applications Manager is a robust tool providing end-to-end performance monitoring for a broad spectrum of applications, databases, servers, and systems. It is particularly adept at providing insights into application performance, which makes it an optimal solution for application performance monitoring.
Why I Picked ManageEngine Applications Manager:
In selecting ManageEngine Applications Manager for this list, I took into account its comprehensive ability to monitor and manage applications across a variety of environments. It differentiates itself by providing detailed insights about application performance, aiding in rapid problem detection and resolution.
Accordingly, I deemed it the "best for application performance monitoring" due to its superior capabilities in this specific area.
Standout Features and Integrations:
Some of the standout features of ManageEngine Applications Manager include its application discovery capability, deep-dive component monitoring, and smart automation. These features allow for robust monitoring and automated problem resolution, ensuring application performance remains optimal.
As for integrations, ManageEngine Applications Manager can integrate with various applications, servers, and databases, such as Oracle, MySQL, Microsoft SQL Server, SAP, and many more.
Pros and Cons
Pros:
- Intelligent automation for problem resolution
- Broad compatibility with various applications, servers, and databases
- Detailed application performance monitoring
Cons:
- Interface may not be as user-friendly as some alternatives
- High starting cost could be a barrier for smaller companies
- Can be complex to set up and configure
New Product Updates from ManageEngine Applications Manager
ManageEngine Applications Manager Adds Azure and Mobile App Monitoring
ManageEngine Applications Manager adds new Azure service monitors and mobile app monitoring for Android and iOS applications. These updates help teams track cloud resources, application performance, and user experiences across more environments. For more information, visit ManageEngine Applications Manager’s official site.
 .
.
LogicMonitor is a SaaS-based, automated IT performance monitoring platform that provides comprehensive visibility into complex IT infrastructure. Given its capacity to handle both on-premises and cloud environments, it stands as a top choice for monitoring hybrid IT infrastructures.
Why I Picked LogicMonitor:
When selecting a tool that excels in monitoring hybrid IT infrastructure, LogicMonitor was my pick. Its versatility in supporting a wide range of infrastructures, including cloud, on-premises, and hybrid systems, sets it apart. I determined LogicMonitor as the best for hybrid IT infrastructure monitoring due to its automated device discovery feature and ability to handle diverse systems.
Standout Features and Integrations:
LogicMonitor's automated device discovery feature is quite remarkable as it simplifies the process of adding new devices to the system. It also offers customizable dashboards, providing users with the flexibility to monitor their infrastructure based on their unique needs.
In terms of integrations, LogicMonitor supports various cloud platforms like AWS, Google Cloud, and Azure. Additionally, it integrates with key business tools such as ServiceNow, Slack, and Jira, aiding in streamlined operations.
Pros and Cons
Pros:
- Supports various cloud platforms and business tools
- Customizable dashboards for personalized monitoring
- Automated device discovery for easy setup
Cons:
- Custom dashboard setup may require technical knowledge
- Some users may find the interface less intuitive
- Pricing is not transparent

New Relic is a cloud-based software analytics platform that offers real-time data insights to help businesses gauge the performance of their software applications. With its in-depth health metrics, it is particularly adept at providing detailed insights into the health and efficiency of these systems.
Why I Picked New Relic:
New Relic stood out to me due to its powerful analytics capabilities, and thus, I selected it for this list. Its capacity to provide granular, real-time health metrics sets it apart from other tools. I believe New Relic is the best for detailed health metrics given its comprehensive data analytics and visualization capabilities, which offer deeper insights into application performance.
Standout Features and Integrations:
One of New Relic's standout features is its application performance monitoring (APM) capabilities, which provide comprehensive insights into the health of your applications. Additionally, it features real user monitoring, which provides data on how users interact with your applications.
New Relic integrates seamlessly with a variety of platforms such as AWS, Azure, Google Cloud Platform, and Kubernetes. These integrations help provide a more holistic view of your infrastructure and applications.
Pros and Cons
Pros:
- Comprehensive application performance monitoring capabilities
- Wide range of integrations with cloud platforms
- Detailed health metrics for in-depth insights
Cons:
- Extensive features may lead to an information overload for some users
- A complex interface that may be difficult for beginners
- Steep pricing for small businesses

HashiCorp offers a suite of open-source tools to empower businesses to define, provision, and manage data center infrastructures using a declarative code approach. It's best suited for organizations wanting to adopt the Infrastructure as Code (IaC) methodology to improve efficiency and maintain consistency in infrastructure management.
Why I Picked HashiCorp:
HashiCorp made it to my selection due to its robust IaC capabilities, making it quite distinct in the infrastructure management landscape. This IaC approach fosters efficiency, repeatability, and safety in infrastructure provisioning and management.
For these reasons, I believe HashiCorp is "Best for" organizations keen on utilizing the IaC approach.
Standout Features and Integrations:
HashiCorp's tools like Terraform, Vault, and Consul provide a wide range of features that cater to infrastructure provisioning, security, and service networking. Terraform's feature of infrastructure codification makes it highly valuable for deploying and managing any scale of infrastructure.
Significant integrations include those with AWS, GCP, and Azure, effectively extending its IaC capabilities across multiple cloud environments.
Pros and Cons
Pros:
- Offers a variety of tools for different aspects of infrastructure management
- Integrates with major cloud platforms
- Excellent Infrastructure as Code capabilities
Cons:
- Support for free users may be limited
- Enterprise versions may be costly for smaller teams
- Can be complex to set up and use

IBM Cloud Monitoring is a monitoring service that provides real-time insights into your application and infrastructure performance hosted on the IBM cloud. This tool is specifically designed to work seamlessly with the IBM cloud environment, making it the best choice for those invested in this ecosystem.
Why I Picked IBM Cloud Monitoring:
Choosing IBM Cloud Monitoring for the list was a straightforward decision considering its superior integration and native compatibility with the IBM cloud environment. It stands out due to its seamless interoperability with the IBM cloud's various services.
I judged it as the "best for IBM cloud environment" because of its capacity to deliver detailed metrics, dashboards, and alerts specifically for the IBM cloud.
Standout Features and Integrations:
IBM Cloud Monitoring's detailed metrics provide a wealth of data about your infrastructure's performance. Its ability to provide real-time monitoring data and facilitate rapid anomaly detection is noteworthy.
In terms of integrations, it seamlessly integrates with various IBM cloud services, including IBM Cloud Databases, IBM Kubernetes Service, and IBM Cloud Functions, to name a few.
Pros and Cons
Pros:
- Real-time monitoring and anomaly detection
- Detailed metrics provide comprehensive insights
- Seamless integration with IBM cloud services
Cons:
- Interface might require a learning curve for new users
- May not integrate well with non-IBM services
- Pricing can be complex and depends on usage
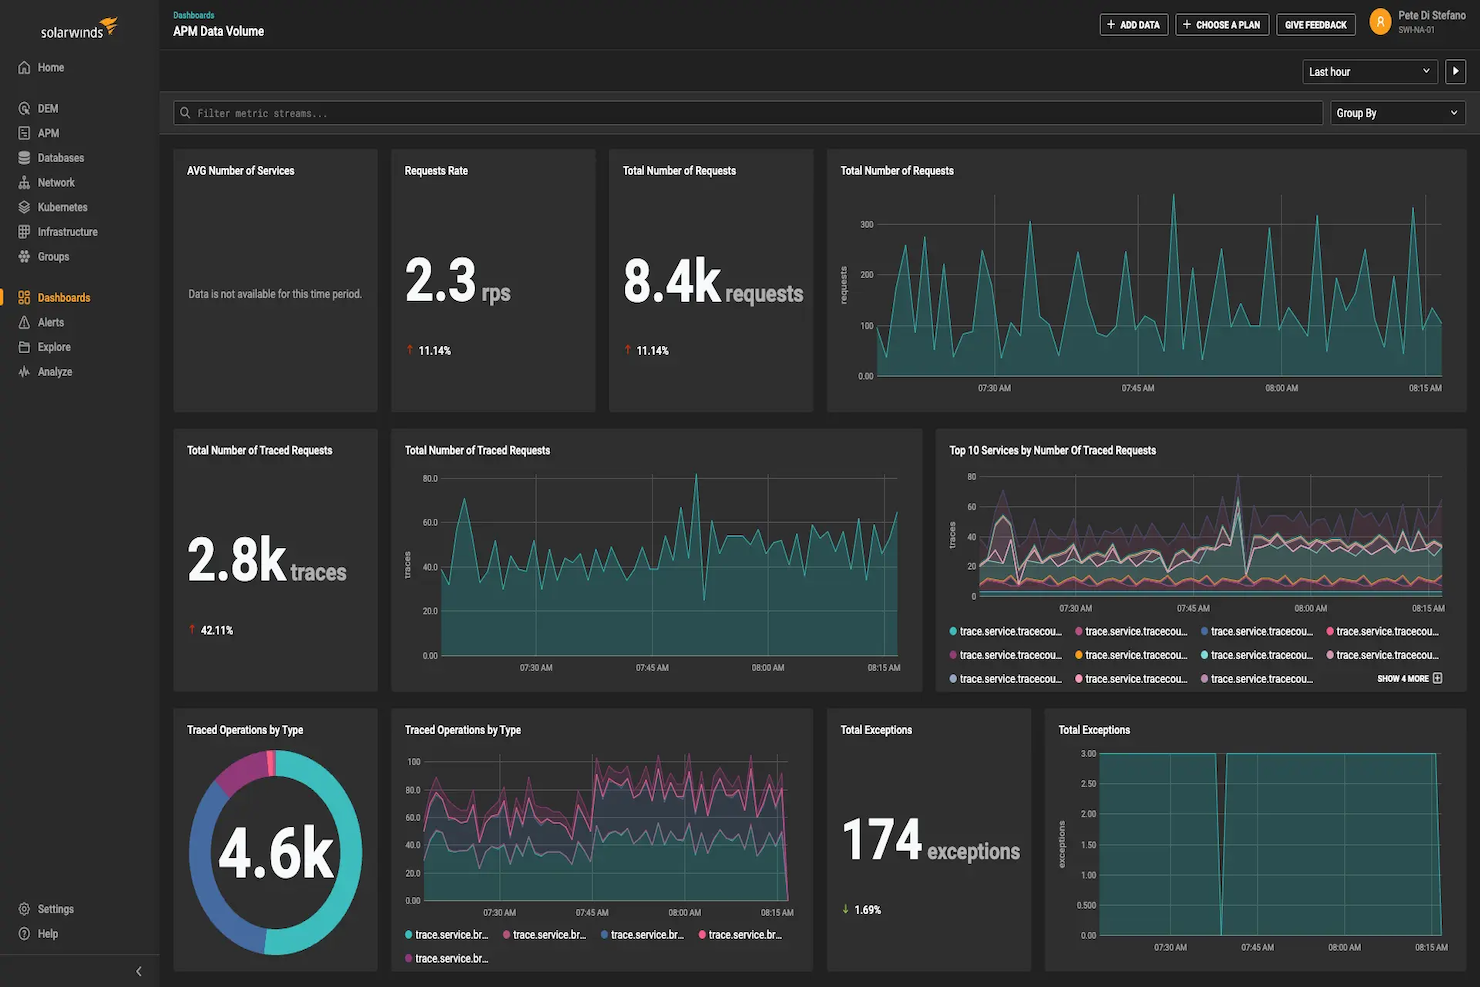
SolarWinds Observability SaaS is a cloud infrastructure monitoring platform for IT and DevOps teams. It provides visibility across cloud applications, infrastructure, logs, databases, networks, and user experience data. It addresses the complexities of managing diverse IT environments, providing tools to streamline monitoring processes, enhance issue resolution, and offer actionable insights, making it ideal for teams looking to optimize their IT operations and improve system performance.
Why I Picked SolarWinds Observability SaaS
I picked SolarWinds Observability SaaS for its ability to provide comprehensive visibility through unified application and infrastructure data. This feature is crucial for understanding the full scope of IT environments, which includes support for open-source frameworks and third-party integrations. Additionally, its AIOps capabilities, enhanced with machine learning, can help reduce alert fatigue by prioritizing real issues, making it a valuable tool for teams overwhelmed by constant alerts.
SolarWinds Observability SaaS Key Features
Here are some features you might find beneficial:
- Automated Instrumentation and Dependency Mapping: This feature allows your team to efficiently monitor and map dependencies without manual intervention.
- Real-Time Anomaly Detection and AI-Powered Root Cause Analysis: It helps you quickly identify and address issues before they impact your system's performance.
- Quick Deployment and User-Friendly Interface: Your team can rapidly realize value with an intuitive interface that simplifies setup and ongoing management.
- Support for Open-Source Frameworks: This ensures easy integration with existing tools, providing flexibility in how you manage your IT infrastructure.
SolarWinds Observability SaaS Integrations
Integrations include AWS, Azure, Google Cloud Platform, Kubernetes, ServiceNow, Slack, Microsoft Teams, Jira, Splunk, and PagerDuty.
Pros and Cons
Pros:
- AIOps capabilities reduce alert fatigue
- Comprehensive data archiving with AWS S3 support
- Effective for troubleshooting and operational insights
Cons:
- Steep learning curve for complex configurations
- Limited customization options for dashboards and reports

Zabbix Cloud Monitoring is a robust tool that offers real-time tracking of servers, virtual machines, and cloud services. Known for its open-source nature, it stands out as the best for organizations looking for customization and cost-effectiveness.
Why I Picked Zabbix Cloud Monitoring:
I chose Zabbix because of its open-source nature that offers customization possibilities and its comprehensive monitoring scope that includes servers, VMs, and cloud services. It stands out with its flexible nature, allowing you to modify it according to specific needs.
Hence, it wins the tag of being "Best for" open-source cloud monitoring, serving those who value flexibility and a hands-on approach.
Standout Features and Integrations:
Zabbix excels in network discovery, offering automated discovery of network devices and configurations. It provides rich data visualization tools that help you understand monitoring statistics at a glance. As an open-source tool, Zabbix integrates with a broad range of other systems, including MySQL, PostgreSQL, and IBM DB2.
Pros and Cons
Pros:
- Comprehensive monitoring features
- Broad range of integrations
- Open-source, offering customization possibilities
Cons:
- Paid support is relatively expensive
- Configuration can be complex
- Steep learning curve for non-technical users
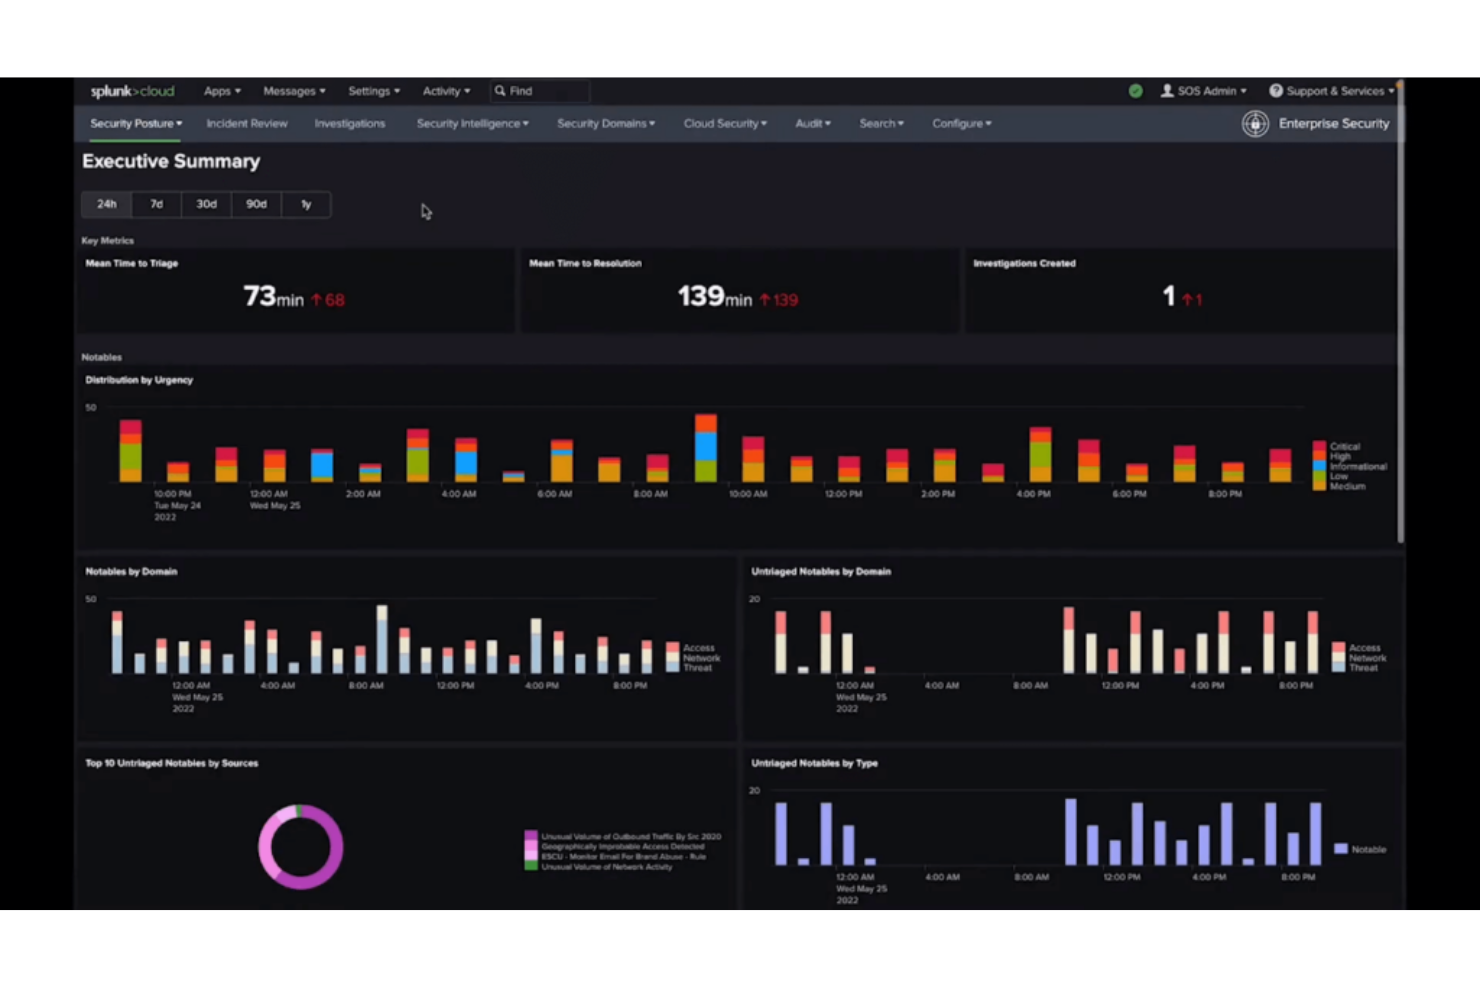
Splunk Infrastructure Monitoring is a tool that offers real-time observability and analytics for cloud infrastructure and microservices. As a platform known for speed and efficiency, it's the go-to choice for businesses requiring instant insights into their cloud performance.
Why I Picked Splunk Infrastructure Monitoring:
I selected Splunk Infrastructure Monitoring due to its strong capabilities in providing real-time insights, making it a standout in the observability landscape.
It's the richness of these analytics that led me to believe it is the "Best for" real-time observability, especially beneficial for businesses demanding immediate knowledge of their cloud operations.
Standout Features and Integrations:
Splunk Infrastructure Monitoring has a real-time streaming architecture that allows it to deliver immediate insights. It also includes features like instant dynamic baselining and anomaly detection, enabling proactive problem detection.
Key integrations include those with AWS, Google Cloud, and Azure, which allows it to monitor multi-cloud environments seamlessly.
Pros and Cons
Pros:
- Integrates well with major cloud platforms
- Includes proactive problem detection features
- Provides real-time observability
Cons:
- Limited historical data storage
- Complex interface may require a learning curve
- Might be overpriced for small businesses

ThousandEyes is an all-encompassing tool that delivers deep visibility into network paths. It shines by mapping out network routes, uncovering performance bottlenecks, and keeping a vigilant eye on the health of all network paths, making it the best for comprehensive visibility into every network path.
Why I Picked ThousandEyes:
ThousandEyes made it to my selection due to its unique emphasis on complete network visibility. It's distinct in its approach to monitoring, as it delivers end-to-end insights into all network paths, not just limited components.
I've determined it to be the "best for" visibility into every network path because of its exceptional ability to illuminate the entire network, exposing potential issues and enabling quick fixes.
Standout Features and Integrations:
ThousandEyes sets itself apart with features like path visualization, which provides a clear view of the entire network, and its ability to monitor the performance of ISPs, CDN, DNS, and more. It integrates seamlessly with various platforms, including data sharing with tools like Slack, PagerDuty, and ServiceNow, as well as data import/export capabilities for further analysis.
Pros and Cons
Pros:
- Broad range of useful integrations
- Path visualization feature for clear network mapping
- Provides deep visibility into all network paths
Cons:
- Lacks some advanced AI-based anomaly detection features
- Custom pricing model might not fit all budgets
- The interface can be a bit complex for beginners
Other Cloud Infrastructure Monitoring Tools
Below is a list of additional cloud infrastructure monitoring tools that I shortlisted, but did not make it to the top 10.
- meshIQ
For middleware monitoring and management
- Dynatrace
For AI-assisted monitoring
- Checkmk
For comprehensive IT infrastructure monitoring
- Datadog
For full-stack observability
- Dotcom Monitor
For agent-based & agentless monitoring
- Coralogix
Good for enhancing security and visibility in cloud-native environments
- Sumo Logic
Good for continuous intelligence to deliver optimized customer experiences
- Prometheus
Good for powerful metrics collection and alerting in Kubernetes environments
- IBM Turbonomic
Good for AI-powered application resource management
- Elastic Observability
Good for unifying logs, metrics, and application performance data
- IBM Instana
Good for real-time visibility into the health of your applications and infrastructure
- Amazon CloudWatch
Good for detailed observability of your AWS resources and applications
- PRTG Network Monitor
Good for complete visibility over your entire IT infrastructure
- Microsoft Azure Monitor
Good for collecting, analyzing, and acting on telemetry from Azure and on-premises environments
- Google Cloud Operations
Good for comprehensive monitoring, logging, and diagnostics in the Google Cloud Platform
- Blumira Automated Detection & Response
Good for automated threat detection and response
- BMC TrueSight Operations Management
Good for AI-driven IT operations management across complex environments


Related Software Reviews
If you still haven't found what you're looking for here, check out these alternative tools that we've tested and evaluated.
- Network Monitoring Software
- Server Monitoring Software
- SD-Wan Solutions
- Infrastructure Monitoring Tools
- Packet Sniffer
- Application Monitoring Tools
How I Evaluate Cloud Infrastructure Monitoring Tools
When I evaluate these tools, I think in two layers—baseline requirements and the differentiators that separate good from great.
Core Functionality (Table Stakes for This List)
These core capabilities serve as the acceptance criteria for inclusion on my list:
- Multi-Cloud Resource Monitoring: I check whether a tool has native integrations with AWS, Azure, and GCP, and how many services it covers per provider out of the box.
- Real-Time Metrics & Dashboards: Granularity matters here. I look for sub-minute polling and customizable dashboards that teams can tailor to specific clusters or regions.
- Alerting & Anomaly Detection: I evaluate how alerts are configured, what notification channels are supported, and whether the tool offers dynamic thresholds beyond static rules.
- Log & Event Correlation: Connecting a CPU spike to a failed deployment is the real test. I look for unified views that tie logs and events to metric timelines.
- Container & Orchestration Visibility: I check for cluster, node, pod, and workload-level metrics across orchestration platforms.
- Auto-Discovery & Topology Mapping: New instances spin up constantly—I evaluate whether the tool detects them automatically and maps dependencies without manual input.
I rank each vendor on a scale from 0 (does not offer the functionality) to 5 (excels in this area) for each criterion.
Vendors need to achieve a minimum average score to be considered for inclusion on my list. From there, I consider what sets each platform apart.
Differentiating Factors (What Sets Vendors Apart)
Once I've curated my list, here's how I contrast and compare different vendors in this space:
Standout Features
I look for AI-driven root cause analysis that can help teams cut through noise during incident responses by prioritizing actionable alerts. Tools offering deep cost observability allow DevOps and SREs to connect infrastructure performance with cloud spend, which is crucial for organizations focused on FinOps. Distributed tracing and end-to-end APM are especially valuable when you need to connect low-level infrastructure data to application-level experiences, supporting quick troubleshooting in microservices environments.
Beyond Features
Pricing transparency is a major differentiator in this space. I evaluate whether vendors charge by host, data volume, or custom metrics—and how predictable costs stay as you scale. Integration ecosystem breadth also matters. I check for OpenTelemetry support and native connections to ITSM and CI/CD tools like ServiceNow and Jenkins, since monitoring rarely lives in isolation. For regulated industries, I look at compliance certifications like SOC 2 Type II, HIPAA, and FedRAMP, along with RBAC and audit logging capabilities.
How to Choose Cloud Infrastructure Monitoring Tools
It’s easy to get bogged down in long feature lists and complex pricing structures. To help you stay focused as you work through your unique software selection process, here’s a checklist of factors to keep in mind:
| Factor | What to Consider |
|---|---|
| Scalability | Make sure the tool can handle growing infrastructure needs. Your monitoring solution should scale as your cloud environment expands, adding new instances and services without performance issues. |
| Integrations | Look for a tool that integrates with your existing cloud providers (AWS, Azure, GCP) and third-party services (like Slack, Jira). This helps centralize monitoring data and automate alerts. |
| Customizability | Choose a solution that lets you create custom dashboards, reports, and alerts to match your team's specific needs and workflows. Flexibility in data visualization is key. |
| Ease of Use | A user-friendly interface reduces the learning curve and speeds up issue resolution. Make sure the tool is intuitive for both developers and non-technical users. |
| Budget | Check the pricing structure for hidden costs like data retention, premium support, or additional integrations. Compare different pricing tiers to avoid overpaying. |
| Security Safeguards | Ensure the tool offers encryption, role-based access control, and secure API connections to protect sensitive infrastructure data. Compliance with industry standards (like SOC 2) is a bonus. |
| Automation | Look for automation features like anomaly detection, auto-remediation, and performance tuning to reduce manual work and improve efficiency. |
| Real-Time Alerts | Make sure the tool provides real-time alerts and notifications via multiple channels (email, Slack, etc.) to respond to issues quickly. |
Trends in Cloud Infrastructure Monitoring Tools
In my research, I sourced countless product updates, press releases, and release logs from different cloud infrastructure monitoring tool vendors. Here are some of the emerging trends I’m keeping an eye on:
- AI-driven insights: More tools are using AI and machine learning to predict failures, detect anomalies, and suggest fixes before issues escalate. This helps teams be proactive instead of reactive.
- Granular cost tracking: Monitoring tools are now providing deeper insights into cloud spending, helping teams identify waste and optimize resource allocation. Some tools even offer automated cost-saving recommendations.
- Unified observability: Vendors are combining infrastructure, application, and network monitoring into a single platform. This gives teams a complete view of their environment without switching between tools.
- Edge monitoring: As more workloads move to the edge, tools are expanding to monitor edge devices and microservices. This helps teams maintain performance and availability across distributed environments.
- Enhanced security monitoring: Tools are adding real-time threat detection and security logging features. Some now offer integrations with SIEM (Security Information and Event Management) platforms for faster incident response.
What Are Cloud Infrastructure Monitoring Tools?
Cloud infrastructure monitoring tools provide an automated way to oversee the operational processes within a cloud-based IT infrastructure. Primarily utilized by IT professionals, network engineers, and system administrators, these tools are invaluable in tracking the status, performance, and health of servers, databases, networks, and application services residing in the cloud.
They serve a critical function in swiftly identifying issues, preventing potential outages, and ensuring the smooth running of business operations. These monitoring tools offer insights and analytics that assist in the optimization of resources, thus, playing a pivotal role in strategic decision-making and enhancing overall system performance.
Features of Cloud Infrastructure Monitoring Tools
When selecting cloud infrastructure monitoring tools, keep an eye out for the following key features:
- Real-time monitoring: Provides instant visibility into infrastructure performance, helping you catch and resolve issues quickly.
- Custom dashboards: Allows you to create personalized views of key metrics, making it easier to track what matters most to your team.
- Anomaly detection: Uses machine learning and log monitoring software to identify unusual patterns and flag potential problems before they impact performance.
- Alerting and notifications: Sends alerts through multiple channels (email, Slack, etc.) to notify your team of issues in real time.
- Log aggregation: Collects and organizes logs from different systems, making it easier to troubleshoot problems and find root causes.
- Cost tracking: Breaks down cloud spending by service, region, or project, helping you identify waste and optimize costs.
- Role-based access control: Lets you define user permissions to ensure team members have access to only the data they need.
- Historical data analysis: Stores historical performance data, allowing you to identify trends and make informed decisions.
- Multi-cloud solutions: Monitors infrastructure across different cloud providers like AWS, Azure, and Google Cloud in a single platform.
- APIs and integrations: Connects with other tools and platforms to automate workflows and centralize data.
Benefits of Cloud Infrastructure Monitoring Tools
Implementing cloud infrastructure monitoring tools provides several benefits for your team and your business. Here are a few you can look forward to:
- Improved uptime: Monitoring tools help catch performance issues early, reducing downtime and keeping services available for users.
- Faster issue resolution: Real-time alerts and detailed logs make it easier for your team to identify and fix problems quickly.
- Better cost management: Cost tracking and resource optimization features help you avoid over-provisioning and reduce waste.
- Increased security: Built-in threat detection and security logging help you spot vulnerabilities and respond to attacks faster.
- More informed decision-making: Historical data and trend analysis give you insights into performance patterns and resource needs.
- Simplified multi-cloud management: Unified dashboards and multi-cloud support let you monitor different cloud environments from one place.
- Enhanced team collaboration: Role-based access and shared dashboards ensure everyone on your team has the data they need to make decisions.
Costs and Pricing of Cloud Infrastructure Monitoring Tools
Selecting cloud infrastructure monitoring tools requires an understanding of the various pricing models and plans available. Costs vary based on features, team size, add-ons, and more. The table below summarizes common plans, their average prices, and typical features included in cloud infrastructure monitoring tools:
Plan Comparison Table for Cloud Infrastructure Monitoring Tools
| Plan Type | Average Price | Common Features |
|---|---|---|
| Free Plan | $0 | Basic performance monitoring tools, limited alerts, community support, and single cloud integration. |
| Personal Plan | $10–$30/user/month | Performance tracking, real-time alerts, basic log analysis, and single-user access. |
| Business Plan | $40–$100/user/month | Multi-cloud support, advanced anomaly detection, custom dashboards, and team-based permissions. |
| Enterprise Plan | $150–$500/user/month | AI-driven insights, automated remediation, security monitoring, dedicated account manager, and compliance tracking. |
Cloud Infrastructure Monitoring Tools FAQs
Here are some answers to common questions about cloud infrastructure monitoring tools:
How do these tools handle monitoring in multi-cloud environments?
Many cloud infrastructure monitoring tools support multi-cloud environments, allowing you to monitor resources across different cloud providers like AWS, Azure, and Google Cloud from a single platform. This unified approach helps your team maintain consistent oversight and simplifies management.
Can these tools integrate with existing DevOps workflows?
Yes, most monitoring tools offer integrations with popular DevOps monitoring tools such as Jenkins, GitHub, and Slack. These integrations enable your team to incorporate monitoring data into your existing workflows, enhancing collaboration and streamlining processes.
How do these tools assist in optimizing cloud costs?
Many monitoring tools provide features that track resource usage and identify underutilized resources. By analyzing this data, you can make informed decisions to optimize your cloud spending and allocate resources more efficiently.
What security features are typically included in these tools?
Security features often include real-time threat detection, vulnerability assessments, and compliance monitoring. These capabilities help your team identify and address potential security issues promptly, maintaining the integrity of your infrastructure.
How customizable are the dashboards and reports in these tools?
Most tools offer customizable dashboards and reports, allowing you to tailor the display of metrics and analytics to your team’s specific needs. This flexibility ensures that you can focus on the most relevant data for your operations.
Do these tools support automated responses to detected issues?
Yes, many monitoring tools support automation features that can trigger predefined actions in response to specific alerts or anomalies. This automation helps your team address issues promptly, reducing downtime and improving system reliability.
What's Next?
If you're in the process of researching cloud infrastructure monitoring tools, connect with a SoftwareSelect advisor for free recommendations.
You fill out a form and have a quick chat where they get into the specifics of your needs. Then you'll get a shortlist of software to review. They'll even support you through the entire buying process, including price negotiations.