The 10 Best Performance Monitoring Tools For SaaS

10 Best Performance Monitoring Tools Shortlist
Here's my pick of the 10 best software from the 25 tools reviewed.


Performance monitoring tools help you track how your systems and applications are running so you can catch issues early and keep everything running smoothly.
Many teams look for these tools when they’re dealing with slow load times, unpredictable performance, or trouble finding the root cause of problems. Without the right tool, you risk spending hours chasing vague alerts or missing performance dips altogether.
I’ve helped teams set up performance monitoring systems that actually surface useful data and reduce guesswork. This guide pulls from that experience to help you choose a tool that fits your workflow and helps you stay on top of what matters.
Why Trust Our Software Reviews
We’ve been testing and reviewing software since 2023. As tech leaders ourselves, we know how critical and difficult it is to make the right decision when selecting software.
We invest in deep research to help our audience make better software purchasing decisions. We’ve tested more than 2,000 tools for different tech use cases and written over 1,000 comprehensive software reviews. Learn how we stay transparent & our software review methodology.
Best Performance Monitoring Tools Summary
This comparison chart summarizes pricing details for my top performance monitoring tools selections to help you find the best one for your budget and business needs.
| Tool | Best For | Trial Info | Price | ||
|---|---|---|---|---|---|
| 1 | Best for automatic network mapping | 14-day free trial available | Pricing upon request | Website | |
| 2 | Best for session replay insights | Free plan + free demo available | From $26/month (billed annually) | Website | |
| 3 | Best for hybrid cloud monitoring | 30-day free trial + free demo available | From $10/month (billed annually) | Website | |
| 4 | Best for code-level insights | 30-day free trial + free demo + free plan availabl | From $199/year | Website | |
| 5 | Best for network performance monitoring | Free demo available | From $245/25 devices | Website | |
| 6 | Best for real-time error tracking | 14-day free trial + free demo available | From $49/host/month (billed annually) | Website | |
| 7 | Best for AI-driven diagnostics | 15-day free trial | From $7/month | Website | |
| 8 | Best for automated hybrid infrastructure monitoring | Free 15-day trial | From $16/hybrid unit/month | Website | |
| 9 | Best for uptime and website speed insights | 30-day free trial + demo available | From $10/month | Website | |
| 10 | Best for comprehensive IT infrastructure monitoring | Free plan and free demo available | From $2,595 (perpetual license for 100 nodes) | Website |
-

Site24x7
Visit WebsiteThis is an aggregated rating for this tool including ratings from Crozdesk users and ratings from other sites.4.7 -
GitHub Actions
Visit WebsiteThis is an aggregated rating for this tool including ratings from Crozdesk users and ratings from other sites.4.8 -
Docker
Visit WebsiteThis is an aggregated rating for this tool including ratings from Crozdesk users and ratings from other sites.4.6


Best Performance Monitoring Tools Reviews
Below are my detailed summaries of the best performance monitoring tools that made it onto my shortlist. My reviews offer a detailed look at the key features, pros & cons, integrations, and ideal use cases of each tool to help you find the best one for you.

Auvik is a network management tool that provides performance monitoring features to help you track network performance and optimize your infrastructure. It's designed to give you a clear view of your network's health, enabling you to quickly identify and resolve issues.
Why I Picked Auvik: One of the reasons I picked Auvik as a performance monitoring tool is its ability to automatically map devices and connections. This feature allows you to see your entire network layout, making it easier to pinpoint where issues might arise. Additionally, Auvik monitors hardware health and tracks performance metrics across various device types from over 700 vendors, ensuring you have comprehensive data to keep your network running smoothly. Another feature that stands out is Auvik's customizable alerts. These alerts allow you to set specific thresholds and receive notifications when something goes awry, so you're always in the loop and can take action promptly. The platform also supports remote management and configuration backups, which means you can manage your network from anywhere and ensure that your data is secure and recoverable.
Standout Features & Integrations:
Features include intuitive network mapping, which provides a visual representation of your network's structure, helping you quickly understand its layout. Auvik also offers global alert settings, allowing you to configure alerts across your entire network with ease. Moreover, the platform supports configuration comparisons, enabling you to track changes and identify potential issues before they escalate. Integrations include ConnectWise, Cisco, Datto, ServiceNow, Slack, Microsoft Intune, Salesforce, Fortinet, Sophos, Splunk, Palo Alto Networks, and Zendesk.
Pros and Cons
Pros:
- Network mapping improves troubleshooting efficiency
- Automatic configuration backups ensure data safety
- Real-time monitoring enhances performance tracking
Cons:
- Resource-intensive for large deployments
- Limited customization options for users
New Product Updates from Auvik
Auvik Adds Alert Insights Report and Enhanced Alerting Controls
Auvik introduces the Alert Insights Report (Beta), count-based alert delays, and automatic alert dismissal. These updates help reduce alert noise and improve how teams monitor and manage alerts. For more information, visit Auvik’s official site.
 .
.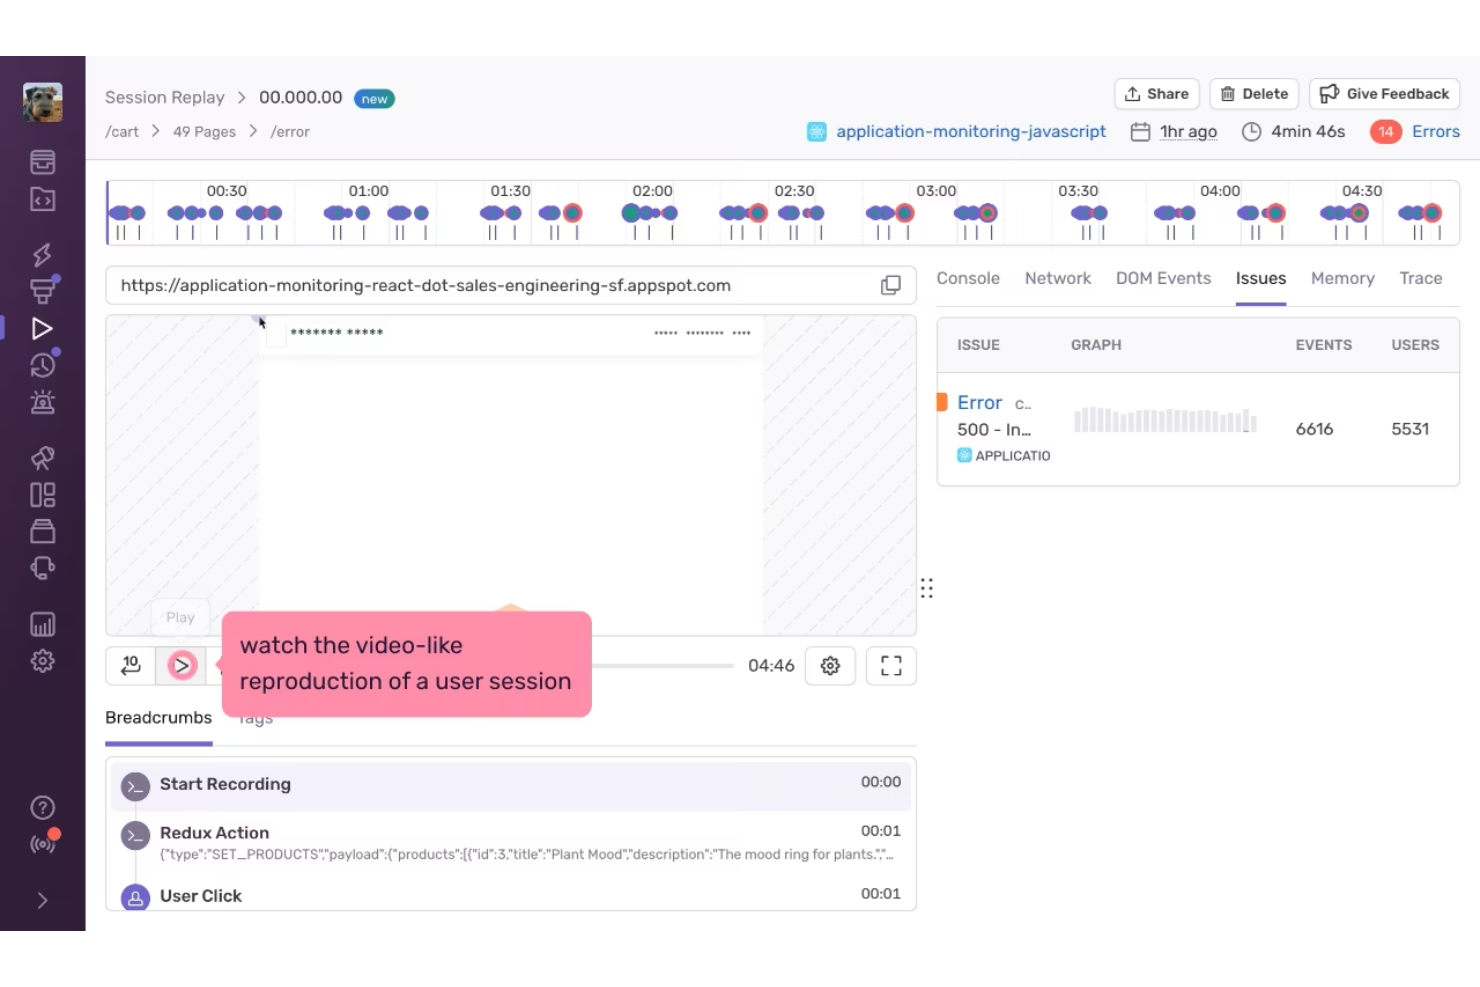
Sentry is a performance monitoring tool used by developers and businesses to understand how their applications behave in real use, with added insight from session replay. It offers error tracking, tracing, and replay tools that help teams see where users encounter issues and slowdowns. By giving clearer visibility into performance problems, Sentry helps teams reduce downtime and improve the overall user experience.
Why I Picked Sentry
I picked Sentry for its session replay insights, which let teams see exactly what users experience when performance issues occur. This makes it easier to connect errors and slowdowns to real user actions, rather than relying solely on logs or metrics. Combined with error tracking and tracing, Sentry helps teams identify and fix problems faster with clearer context.
Sentry Key Features
In addition to session replay insights, Sentry offers:
- Code Coverage: Offers insights into which parts of your code are tested, helping prioritize tests and streamline development efforts.
- Mobile App Crash Reporting: Supports mobile platforms by identifying and resolving crash issues, ensuring a smooth user experience on mobile devices.
- AI Observability: Monitors AI applications, aiding in the detection and resolution of performance issues specific to AI-driven functionalities.
Sentry Integrations
Integrations include GitHub, Slack, Jira, Bitbucket, Trello, GitLab, PagerDuty, Microsoft Teams, and Asana.
Pros and Cons
Pros:
- Session replay helps teams understand issues from the user’s perspective
- Strong error tracking with clear stack traces
- Alerts help teams respond quickly to critical issues
Cons:
- Not a full infrastructure monitoring or observability platform
- Session replay may require careful setup to manage data volume and privacy
New Product Updates from Sentry

Sentry Adds AI Dashboard Generation in Beta
Sentry introduces AI Dashboard Generation in beta, enabling users to create dashboards using prompts through an agent. This makes dashboard setup faster and easier without manual configuration. For more information, visit Sentry’s official site.
 .
.
Site24x7 offers businesses a comprehensive tool to monitor hybrid cloud environments, ensuring optimal performance and uptime. Given the increasing adoption of hybrid cloud architectures by businesses, Site24x7's specialized tools fill a vital niche in monitoring both on-premises and cloud components cohesively.
Why I Picked Site24x7: After comparing various monitoring tools, Site24x7 stood out for its dedicated focus on hybrid cloud environments. I determined that its capability to holistically monitor both on-premises and cloud infrastructure sets it apart from its competitors. This unique emphasis is why I regard Site24x7 as the best choice for organizations looking to oversee their hybrid cloud setups.
Standout Features & Integrations:
Site24x7 boasts features that include real-time performance metrics, automated incident remediation, and advanced AIOps capabilities. When it comes to integrations, the platform smoothly connects with leading cloud services providers, such as AWS, Microsoft Azure, and Google Cloud, facilitating broader oversight across various services.
Pros and Cons
Pros:
- Strong AIOps capabilities for enhanced insights
- Automated incident remediation reduces manual intervention
- Tailored for hybrid cloud environments
Cons:
- Reporting interface could be more intuitive for certain users
- Initial setup may require a learning curve
- Some advanced monitoring features are limited to premium tiers
New Product Updates from Site24x7

Site24x7 Enhances Network Monitoring With Device and Visibility Updates
Site24x7 introduces proactive hardware health monitoring, expanded device support, centralized network controls, and enhanced SD-WAN visualization to improve network monitoring and management. For more information, visit Site24x7’s official site.
 .
.
ManageEngine Applications Manager is a performance monitoring and observability solution that provides full-stack visibility into cloud and on-premise applications. It supports over 150 technologies, helping IT teams detect and resolve performance bottlenecks before they affect users.
Why I Picked ManageEngine Applications Manager: I like its ability to provide deep diagnostics through code-level insights and distributed transaction tracing. You can monitor application performance across various programming languages, including Java, .NET, Python, and Ruby. With application service maps, you get a clear view of dependencies, helping your team pinpoint slow transactions and optimize code execution. Additionally, real user monitoring offers detailed front-end performance metrics based on actual user traffic, including response times by geography, browser, and network.
Standout Features & Integrations:
Other features include synthetic transaction monitoring, which simulates user interactions using Selenium-based test scripts to proactively check website performance from multiple locations. Additionally, automated discovery and dependency mapping help you visualize relationships between applications, databases, and services, dynamically updating as your environment changes. Integrations include ManageEngine ServiceDesk Plus, ServiceNow, Site24x7, AlarmsOne, Slack, Prometheus, AWS, Google Cloud, Microsoft Azure, Oracle, and MySQL.
Pros and Cons
Pros:
- Simplifies management of applications and their relationships
- Real-time alerting system helps teams respond promptly to issues
- Monitors a wide range of applications and infrastructure components
Cons:
- The tool can be resource-intensive
- Setting up the tool to meet specific needs can be challenging
New Product Updates from ManageEngine Applications Manager
ManageEngine Applications Manager Adds Veeam Monitoring
ManageEngine Applications Manager adds Veeam Enterprise Manager monitoring. This update enables tracking of backup infrastructure, job performance, and storage usage. For more information, visit ManageEngine’s official site.
 .
.
ManageEngine OpManager is a network performance monitoring tool that helps you keep an eye on your network's health and performance. It monitors devices like routers, switches, servers, and virtual machines to ensure they're running smoothly.
Why I Picked ManageEngine OpManager: I chose OpManager for its ability to monitor network performance in real-time. It tracks important metrics such as latency, packet loss, and response time, giving you a clear picture of your network's status. This real-time monitoring means you can detect and address issues promptly, helping to prevent downtime and keep your operations running smoothly. I also like that OpManager offers over 100 built-in reports that you can tailor to your needs, providing insights into network availability, usage trends, and performance analysis.
Standout Features & Integrations:
Other features include network traffic analysis, which allows you to monitor bandwidth usage and identify top users and network configuration management, enabling you to schedule configuration backups and track changes. It also offers IP address and switch port management, helping you manage IP addresses and map switch ports to devices. Some integrations include ADManager Plus, ADAudit Plus, ADSelfService Plus, M365 Manager Plus, PAM360, Password Manager Pro, ServiceDesk Plus, and Log360.
Pros and Cons
Pros:
- Comprehensive monitoring capabilities
- Real-time alerting
- Scalability for growing networks
Cons:
- Complex initial setup
- Could offer more integration options
New Product Updates from ManageEngine OpManager
ManageEngine OpManager Vendor Templates and NCM XML Import
ManageEngine OpManager introduces enhanced vendor template integration and device template import for the NCM module using XML files. This update helps teams improve device classification and speed up configuration workflows. For more information, visit ManageEngine OpManager’s official site.
 .
.
Atatus specializes in giving its users a clear and immediate insight into errors as they happen, so there's no delay in troubleshooting. This tool thrives on its ability to catch errors in real time, providing clarity and swift action when systems glitch or break.
Why I Picked Atatus: Out of all the tools I evaluated, Atatus struck a chord due to its singular focus on real-time error detection. I chose Atatus because, in my opinion, it offers a clear-cut advantage when it comes to immediate error tracking, setting it apart from many other monitoring tools. The essence of its prowess lies in its capability to reduce downtime and maximize operational efficiency, which is why I determined it's best for real-time error tracking.
Standout Features & Integrations:
Atatus offers application performance metrics alongside its error tracking, meaning users get a comprehensive view of application health. Their alerts system is both prompt and customizable, ensuring the right people know about issues immediately. On the integration front, Atatus supports a range of platforms including Slack, JIRA, and Webhooks, allowing for efficient communication and issue resolution across teams.
Pros and Cons
Pros:
- A broad range of integrations for team communication
- Comprehensive application performance metrics
- Immediate error detection and alerts
Cons:
- Limited features in the basic pricing plan
- An interface may seem complex for beginners
- Might require some setup for specific environments

Dynatrace is a comprehensive application performance monitoring solution that delves deep into your IT environment to diagnose issues. What sets it apart is its AI-powered engine that facilitates precise diagnostics and offers actionable insights.
Why I Picked Dynatrace: When selecting monitoring platforms for inclusion, Dynatrace's robust AI capabilities quickly caught my attention. I judged its diagnostic precision, powered by AI, to be a key differentiator from many other tools in the market. In an era where AI-driven insights are revolutionizing IT operations, Dynatrace stands out as particularly adept at leveraging this technology.
Standout Features & Integrations:
Dynatrace shines with features like real-user monitoring, infrastructure monitoring, and its unique "Davis AI" engine which automates anomaly detection and root cause analysis. It provides integrations with a wide array of platforms, including AWS, Azure, Kubernetes, and many more, offering a well-rounded monitoring experience.
Pros and Cons
Pros:
- User-friendly interface and visualizations
- Comprehensive monitoring across multiple platforms
- Exceptional AI-driven diagnostic capabilities
Cons:
- Some users may find the configuration process intricate.
- The extensive range of features can have a steeper learning curve for newcomers
- Pricing might be on the higher side for small businesses

LogicMonitor offers a cloud-based platform that specializes in monitoring and observing hybrid infrastructures, encompassing both on-premises systems and cloud-based deployments. Its automated approach to tracking the performance of various infrastructure components makes it particularly valuable for companies with complex and diverse environments.
Why I Picked LogicMonitor: When choosing monitoring solutions for this list, I judged their capabilities, and LogicMonitor consistently stood out. What differentiates it from others is its automation capabilities, especially for hybrid setups, combining both traditional and cloud environments.
In my opinion, its proficiency in this aspect positions it as the best for automated hybrid infrastructure monitoring.
Standout Features & Integrations:
Key features of LogicMonitor include automated device discovery, dynamic thresholding, and advanced alerting mechanisms. Integration-wise, LogicMonitor has compatibility with a plethora of services such as AWS, Azure, Cisco, VMware, and many more, ensuring broad coverage across multiple platforms.
Pros and Cons
Pros:
- Supports a wide array of integrations
- Robust automation features reduce manual intervention
- Comprehensive hybrid infrastructure monitoring
Cons:
- Some users report occasional lags in alert notifications.
- Advanced features might be overwhelming for smaller deployments
- The interface can be intricate for beginners

Pingdom provides businesses with invaluable insights into website uptime, performance, and speed. Recognizing that a site's accessibility and loading speed can significantly influence user experience and conversions, Pingdom offers specialized tools to track these crucial metrics.
Why I Picked Pingdom: Throughout my assessment of web monitoring tools, Pingdom constantly emerged as a leader. I chose Pingdom primarily because it specializes in delivering precise uptime and speed metrics, which are crucial for any online business. The depth and accuracy of its insights validate my judgment that it's best for obtaining clear website speed and uptime data.
Standout Features & Integrations:
Pingdom shines with its real-time performance monitoring, providing instant alerts the moment issues are detected. Its root cause analysis feature offers valuable insights to address potential problems swiftly. Integration-wise, Pingdom supports several platforms, including Slack, Opsgenie, and PagerDuty, ensuring teams are promptly notified of any discrepancies.
Pros and Cons
Pros:
- Supports multiple integrations for enhanced team communication
- Comprehensive root cause analysis for swift problem-solving
- Real-time monitoring and instant alerts
Cons:
- Some advanced features only available in higher-priced tiers
- Limitations on the number of checks in basic plans
- The interface might be slightly complex for beginners

With Nagios, users gain a wide-lens view of their entire IT infrastructure, ensuring that every component, from servers to applications, functions optimally. Recognizing the vital role of reliable IT infrastructure in modern businesses, Nagios has tailored its tool to provide a holistic monitoring solution.
Why I Picked Nagios: In my journey of evaluating monitoring tools, Nagios consistently appeared as a top contender. I chose Nagios because of its comprehensive approach to IT infrastructure monitoring, ensuring no component goes unchecked.
This all-encompassing nature is why I've judged Nagios to be best for businesses wanting thorough IT infrastructure oversight.
Standout Features & Integrations:
Nagios excels in providing both visual and detailed reports, granting IT teams a clear picture of their infrastructure's health. Its alerting system is particularly robust, immediately notifying teams of any potential disruptions. On the integration front, Nagios supports a variety of plugins and has a strong community backing, ensuring compatibility with a wide array of systems and tools.
Pros and Cons
Pros:
- Extensive plugin support and active community backing
- Proactive alerting system for timely issue resolution
- Detailed and visual reporting capabilities
Cons:
- Requires consistent maintenance for optimal performance
- The interface might feel dated to some users
- Initial setup can be complex for newcomers
Other Performance Monitoring Tools
Below is a list of additional performance monitoring tools that I shortlisted, but did not make it to the top 10. They are definitely worth checking out.
- Datadog
For integrated cloud-scale monitoring
- AppDynamics
For end-to-end business transaction tracing
- New Relic
For DevOps and SRE collaboration
- SolarWinds AppOptics
For granular application performance metrics
- Paessler PRTG
For flexible network monitoring options
- Sematext
For centralized logs and metrics
- Dotcom Monitor
For complex, scripted monitoring for APIs
- Coralogix
Good for real-time log analytics and insights
- Raygun
Good for error tracking and crash reports
- Zabbix
Good for open-source server monitoring
- Prometheus
Good for real-time alerting and time series analysis
- LogRocket
Good for understanding user behaviors in web apps
- Stackify Retrace
Good for developers seeking in-depth code insights
- Catchpoint
Good for user experience and network monitoring
- IBM Instana
Good for end-to-end application visibility


Performance Monitoring Tool Selection Criteria
When selecting the best performance monitoring tools to include in this list, I considered common buyer needs and pain points like scalability and ease of integration. I also used the following framework to keep my evaluation structured and fair:
Core Functionality (25% of total score)
To be considered for inclusion in this list, each solution had to fulfill these common use cases:
- Monitor application performance
- Track server uptime
- Provide real-time analytics
- Offer alert notifications
- Support multi-platform environments
Additional Standout Features (25% of total score)
To help further narrow down the competition, I also looked for unique features, such as:
- Customizable dashboards
- AI-driven insights
- Distributed tracing
- Anomaly detection
- User experience monitoring
Usability (10% of total score)
To get a sense of the usability of each system, I considered the following:
- Intuitive interface design
- Ease of navigation
- Customization options
- Learning curve
- Accessibility features
Onboarding (10% of total score)
To evaluate the onboarding experience for each platform, I considered the following:
- Availability of training videos
- Interactive product tours
- Access to templates
- Chatbot assistance
- Webinars and live demos
Customer Support (10% of total score)
To assess each software provider’s customer support services, I considered the following:
- 24/7 availability
- Multichannel support options
- Responsiveness to queries
- Availability of a knowledge base
- Personalized support services
Value For Money (10% of total score)
To evaluate the value for money of each platform, I considered the following:
- Competitive pricing
- Pricing transparency
- Availability of free trials
- Range of features in each pricing tier
- Discounts for annual subscriptions
Customer Reviews (10% of total score)
To get a sense of overall customer satisfaction, I considered the following when reading customer reviews:
- User satisfaction ratings
- Commonly reported issues
- Praise for specific features
- Feedback on support services
- Overall recommendation rates
How to Choose Performance Monitoring Tool
It’s easy to get bogged down in long feature lists and complex pricing structures. To help you stay focused as you work through your unique software selection process, here’s a checklist of factors to keep in mind:
| Factor | What to Consider |
|---|---|
| Scalability | Can the tool grow with your business needs? Consider if it supports increasing data loads and user numbers without performance issues. |
| Integrations | Does it integrate with your existing tech stack? Check for compatibility with key systems like AWS, Azure, or Kubernetes to avoid data silos. |
| Customizability | Can you tailor the tool to your workflows? Look for options that allow you to adjust dashboards and reports to fit your team's specific needs. |
| Ease of use | Is the interface intuitive for your team? A steep learning curve can slow down adoption, so look for user-friendly designs and clear navigation. |
| Implementation and onboarding | How long will it take to get up and running? Evaluate the availability of resources like tutorials and support to ease the transition. Network services from WAN optimization vendors may have more complex onboarding procedures than other tools. |
| Cost | Is the pricing transparent and within your budget? Consider not just upfront costs but also long-term expenses, including potential add-ons or upgrades. |
| Security safeguards | Does the tool comply with your security standards? Ensure it offers robust data protection features like encryption and regular security updates. |
| Support availability | Is help available when you need it? Check the support hours and channels, like chat or phone, to ensure they align with your team's requirements. |
What Are Performance Monitoring Tools?
Performance monitoring tools are software solutions used to track and analyze the performance of applications, servers, and networks. IT professionals, developers, and operations teams generally use these tools to ensure systems run efficiently and to identify potential issues before they escalate.
Real-time monitoring, alert notifications, and customizable dashboards help with maintaining system health and optimizing performance. Comprehensive hardware monitoring software extend this capability by providing detailed insights into physical infrastructure components. These tools provide essential insights that enable teams to improve reliability and user satisfaction.
Features
When selecting performance monitoring tools, keep an eye out for the following key features:
- Alert notifications: Sends immediate alerts to notify users of system anomalies, allowing for swift responses to potential problems.
- Customizable dashboards: Allows users to tailor the display of metrics and data to fit their specific needs and preferences.
- Anomaly detection: Identifies unusual patterns and deviations in performance metrics, aiding in the quick diagnosis of issues.
- Application performance insights: Offers detailed analysis of application health and efficiency, helping teams optimize software performance.
- Integration capabilities: Ensures compatibility with existing systems and platforms, reducing data silos and enhancing workflow.
- User experience monitoring: Tracks end-user interactions and experiences, providing insights to improve satisfaction and engagement.
- Real-time monitoring: Provides continuous data on system performance, helping teams quickly identify and address issues as they arise. Popular solutions like Nagios alternatives offer various approaches to system monitoring.
- Automated discovery: Simplifies the setup process by automatically identifying and mapping system components.
- Security safeguards: Provides data protection features like encryption to maintain system integrity and compliance with standards.
Benefits
Implementing performance monitoring tools provides several benefits for your team and your business. Here are a few you can look forward to:
- Improved system reliability: Real-time monitoring and alert notifications help maintain system uptime by quickly identifying and resolving issues.
- Enhanced user satisfaction: User experience monitoring provides insights into end-user interactions, allowing for improvements that boost satisfaction.
- Optimized performance: Application performance insights and anomaly detection aid in identifying bottlenecks, leading to better software efficiency.
- Efficient resource management: Customizable dashboards and integration capabilities ensure that data is easily accessible and actionable across platforms.
- Increased security: Security safeguards protect data integrity, ensuring compliance with industry standards and reducing risk.
- Proactive issue resolution: Automated discovery and real-time alerts allow teams to address potential problems before they impact operations.
- Streamlined workflows: Integration capabilities ensure smooth data flow between systems, reducing manual workload and enhancing productivity.
Costs & Pricing
Selecting performance monitoring tools requires an understanding of the various pricing models and plans available. Costs vary based on features, team size, add-ons, and more. The table below summarizes common plans, their average prices, and typical features included in performance monitoring tools solutions:
Plan Comparison Table for Performance Monitoring Tools
| Plan Type | Average Price | Common Features |
|---|---|---|
| Free Plan | $0 | Basic monitoring, limited data retention, and community support. |
| Personal Plan | $5-$25/user/month | Real-time monitoring, alert notifications, customizable dashboards, and email support. |
| Business Plan | $30-$75/user/month | Advanced analytics, integration capabilities, user experience monitoring, and phone support. |
| Enterprise Plan | $100-$200/user/month | Full-stack visibility, dedicated account management, advanced security features, and 24/7 premium support. |
Performance Monitoring Tools FAQs
Here are some answers to common questions about performance monitoring tools:
What considerations would you likely take in picking a performance monitoring tool?
When choosing a performance monitoring tool, consider security, data protection, and privacy. Ensure the tool complies with industry standards like GDPR or HIPAA. Evaluate how well it integrates with your existing systems and its ability to scale with your business needs. For teams seeking comprehensive options beyond traditional solutions, our guide to New Relic alternatives offers detailed comparisons of top-rated tools.
How do performance monitoring tools handle data privacy?
Performance monitoring tools often include features to ensure data privacy by encrypting data and providing access controls. You should verify that the tool you choose complies with relevant data protection regulations and offers audit logs to track data access and usage.
How do performance monitoring tools integrate with existing systems?
Most performance monitoring tools offer APIs and connectors to integrate with other systems. Check if the tool supports your current tech stack, including cloud services and on-premises applications, to ensure smooth data flow and avoid silos.
How do performance monitoring tools alert users to issues?
These tools typically use real-time alerting systems to notify users of performance issues. Alerts can be sent via email, SMS, or integrated messaging platforms. Look for customizable alert thresholds and escalation paths to fit your team’s workflow.
What kind of support can you expect from performance monitoring tool vendors?
Support varies by vendor but often includes 24/7 assistance through chat, email, or phone. Some vendors offer dedicated account managers or premium support plans. Evaluate the level of support you need and ensure it’s available in your preferred channels.
How do performance monitoring tools help in optimizing resources?
By providing insights into system performance and identifying bottlenecks, these tools help optimize resource allocation. They enable you to adjust workloads, scale resources efficiently, and improve overall system performance, leading to cost savings and better resource management.
What’s Next:
If you're in the process of researching performance monitoring tools, connect with a SoftwareSelect advisor for free recommendations.
You fill out a form and have a quick chat where they get into the specifics of your needs. Then you'll get a shortlist of software to review. They'll even support you through the entire buying process, including price negotiations.