10 Migliori Alternative a Grafana per il 2026

Shortlist delle alternative a Grafana


Le migliori alternative a Grafana combinano una visualizzazione dati flessibile, solide integrazioni per l’osservabilità e dashboard scalabili. Di conseguenza, questi strumenti aiutano i team a monitorare sistemi complessi in modo più efficace.
Se stai valutando delle alternative, probabilmente hai bisogno di supportare diverse fonti di dati e di analisi in tempo reale. Inoltre, ti servono strumenti che si integrano facilmente con i tuoi flussi di lavoro esistenti.
Inoltre, molte piattaforme includono funzionalità come il monitoraggio delle prestazioni applicative e l’analisi dei log. Offrono anche visualizzazioni come heatmap e opzioni per incorporare dashboard per una fruizione più ampia.
In generale, questi strumenti si concentrano su interfacce intuitive e su una curva di apprendimento ridotta. Pertanto, semplificano le attività di monitoraggio e troubleshooting, garantendo allo stesso tempo il soddisfacimento delle tue esigenze tecniche e operative.
Che cos’è un’alternativa a Grafana?
Un’alternativa a Grafana è qualsiasi piattaforma di visualizzazione dati e osservabilità che offre funzionalità simili a quelle di Grafana in termini di dashboard, monitoraggio e analisi. In altre parole, questi strumenti aiutano i team IT a raccogliere, visualizzare e analizzare metriche, log e tracce provenienti da varie fonti. Inoltre, scegliere un’alternativa a Grafana ti consente di soddisfare esigenze specifiche come le preferenze di integrazione, la scalabilità o i requisiti open source. Allo stesso tempo, puoi mantenere una visibilità chiara sulla tua infrastruttura e sulle applicazioni.
Riepilogo delle migliori alternative a Grafana
Questa tabella di confronto riassume i dettagli sui prezzi delle mie principali alternative a Grafana, per aiutarti a trovare quella più adatta al tuo budget ed esigenze aziendali.
| Tool | Best For | Trial Info | Price | ||
|---|---|---|---|---|---|
| 1 | Ideale per automazione dell’osservabilità basata su IA | Versione di prova gratuita disponibile | Da $7/host/mese | Website | |
| 2 | Ideale per il monitoraggio di ambienti multi-cloud | Piano gratuito disponibile | Da $15/host/mese (fatturazione annuale) | Website | |
| 3 | Ideale per il monitoraggio dell'infrastruttura in tempo reale | Prova gratuita di 14 giorni + piano gratuito + demo gratuita disponibile | Da $4.50/node/mese (fatturazione annuale) | Website | |
| 4 | Ideale per la correlazione della telemetria full-stack | Piano gratuito disponibile | From $49/user/month | Website | |
| 5 | Ideale per l’ingestione dati su scala aziendale | Prova gratuita di 14 giorni + demo gratuita disponibile | Prezzo su richiesta | Website | |
| 6 | Ideale per la visualizzazione dei dati Elasticsearch | Prova gratuita di 7 giorni disponibile | Prezzi su richiesta | Website | |
| 7 | Ideale per la creazione di dashboard tramite codice | Prova gratuita di 14 giorni + demo gratuita disponibile | Da $0,20/milione di punti dati metrici | Website | |
| 8 | Ideale per il tracing distribuito open-source | Prova gratuita di 30 giorni + demo gratuita disponibile | Da $49/mese | Website | |
| 9 | Il migliore con motore integrato di ricerca e analisi | Piano gratuito disponibile | Gratuito e open-source con prezzi opzionali per il servizio gestito dai provider cloud | Website | |
| 10 | Ideale per la personalizzazione dei template delle dashboard | Gratuito, open source | Gratuito | Website |
Perché Fidarti delle Nostre Recensioni Software
Testiamo e recensiamo software dal 2023. Come leader tecnologici, sappiamo quanto sia cruciale e difficile prendere la decisione giusta nella scelta di un software.
Investiamo in una ricerca approfondita per aiutare il nostro pubblico a effettuare scelte migliori di acquisto software. Abbiamo testato oltre 2.000 strumenti per diversi casi d’uso tecnologici e scritto più di 1.000 recensioni complete. Scopri come restiamo trasparenti e la nostra metodologia di recensione del software.
-

TestDevLab
Visit Website -
Site24x7
Visit WebsiteThis is an aggregated rating for this tool including ratings from Crozdesk users and ratings from other sites.4.7 -
GitHub Actions
Visit WebsiteThis is an aggregated rating for this tool including ratings from Crozdesk users and ratings from other sites.4.8


Recensioni sulle alternative a Grafana
Di seguito trovi i miei riassunti dettagliati delle alternative a Grafana che sono entrate nella mia shortlist. Le mie recensioni offrono uno sguardo dettagliato su funzionalità, integrazioni e casi d’uso consigliati di ciascuna piattaforma, per aiutarti a individuare quella giusta per te.
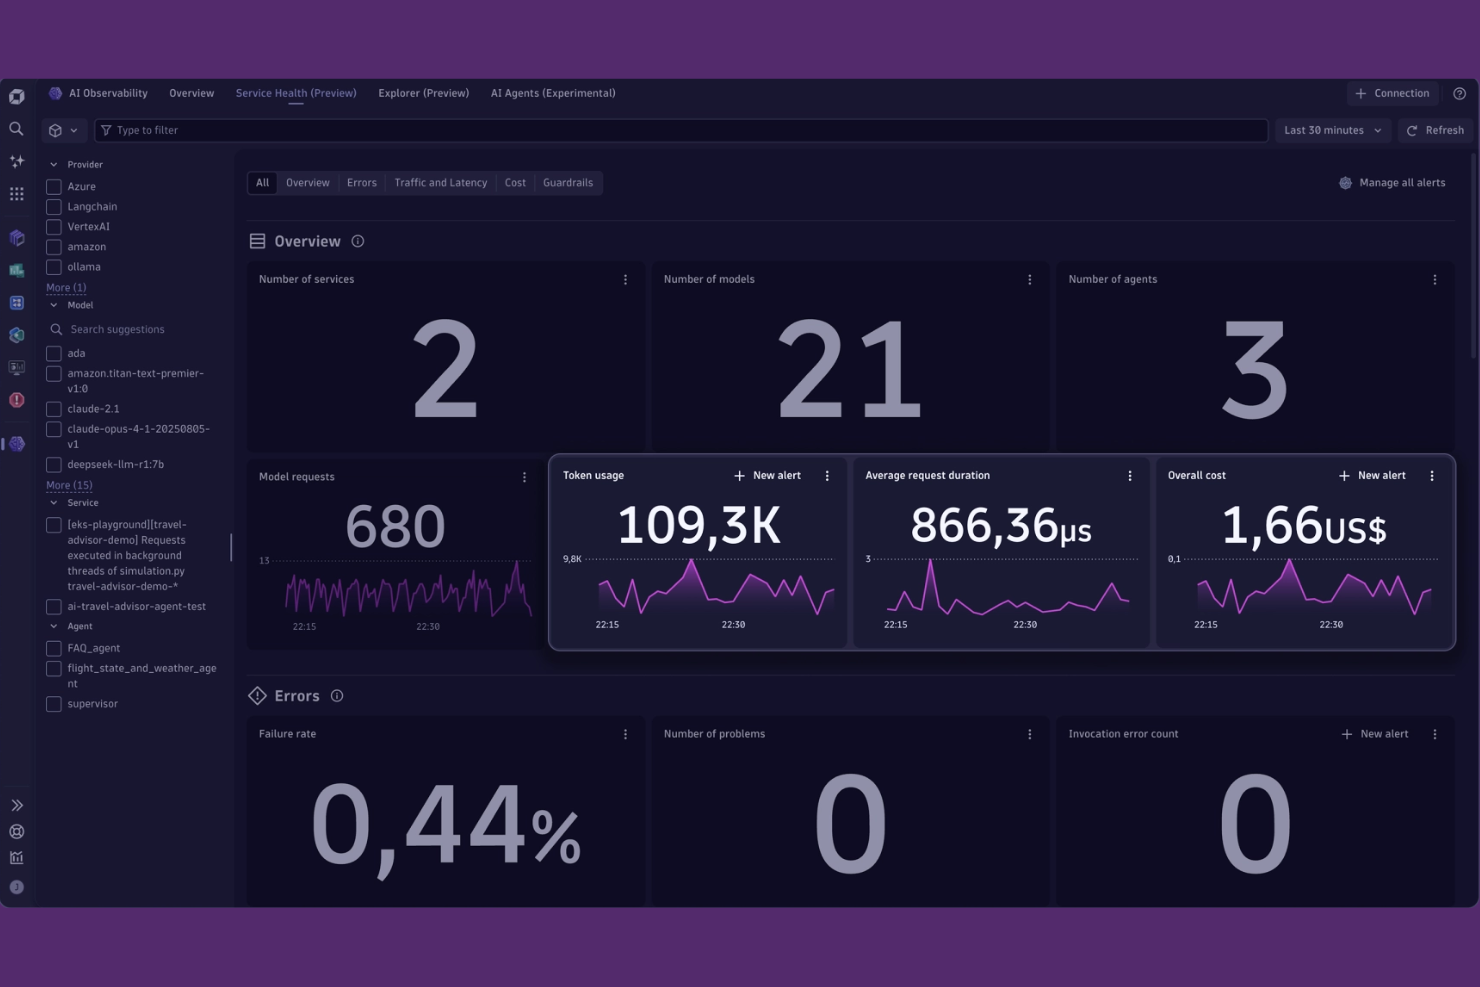
Dynatrace è una piattaforma di osservabilità full-stack progettata per le organizzazioni che gestiscono ambienti complessi e dinamici. Si rivolge a team IT e ingegneri della reliability che necessitano di insight automatizzati e analisi delle cause radice attraverso sistemi cloud-native e ibridi. Se cerchi una soluzione che vada oltre i dashboard per offrire osservabilità ricca di contesto e guidata dall’IA, Dynatrace merita considerazione.
Per chi è ideale Dynatrace?
Dynatrace è particolarmente adatto ai team IT aziendali e agli ingegneri della site reliability che gestiscono ambienti su larga scala, cloud-native o ibridi.
Perché Dynatrace è una valida alternativa a Grafana
Quando cerco piattaforme di osservabilità che vadano oltre la semplice visualizzazione, Dynatrace si distingue per l’automazione alimentata dall’IA. Il suo motore Davis AI analizza continuamente i dati di telemetria, rilevando automaticamente le anomalie e individuando le cause radice senza intervento manuale. Questo livello di automazione aiuta i team a ridurre la fatica da allarmi e accelerare la risposta agli incidenti, soprattutto in contesti complessi e distribuiti. Per le organizzazioni che desiderano più che semplici dashboard e puntano a insight proattivi e automatizzati, Dynatrace rappresenta una valida alternativa a Grafana.
Funzionalità principali di Dynatrace
Altre funzionalità che rendono Dynatrace una scelta solida per osservabilità e visualizzazione includono:
- Mappatura topologica full-stack: Visualizza in tempo reale le dipendenze tra infrastruttura, applicazioni e servizi.
- Tracing distribuito: Tiene traccia delle richieste end-to-end tra microservizi e ambienti ibridi.
- Creatore di dashboard personalizzati: Consente di creare dashboard su misura con una vasta gamma di widget di visualizzazione.
- Analisi dei log: Centralizza i dati di log e consente interrogazioni avanzate e correlazione con metriche e trace.
Integrazioni Dynatrace
Le integrazioni includono AWS, Google Cloud, Kubernetes, Slack, Jira, PagerDuty, GitHub, JetBrains, Cursor IDE, e molto altro.
Pros and Cons
Pros:
- Analisi delle cause radice degli incidenti basata su IA
- Tracing distribuito integrato per microservizi
- Monitoraggio unificato di infrastruttura, applicazioni e log
Cons:
- I widget personalizzati per le dashboard sono più limitati
- Richiede l’installazione di un agente sugli host monitorati

Datadog è una piattaforma di osservabilità basata su cloud pensata per le organizzazioni che gestiscono sistemi complessi e distribuiti. È particolarmente utile per i team IT e i professionisti DevOps che necessitano di un monitoraggio unificato di infrastrutture, applicazioni e servizi. Se cerchi una visibilità approfondita in ambienti multilivello e desideri correlare metriche, tracce e log in un unico posto, Datadog offre una soluzione integrata e completa.
Per chi è più indicato Datadog?
Datadog è una scelta solida per i team operativi IT e DevOps di medie e grandi imprese che necessitano di un monitoraggio unificato in ambienti multi-cloud e ibridi.
Perché Datadog è una valida alternativa a Grafana
Per i team che monitorano ambienti multi-cloud, Datadog offre una visibilità unificata su AWS, Azure, Google Cloud e sistemi on-premise all’interno di un’unica piattaforma. Ho scelto Datadog perché correla automaticamente metriche, tracce e log provenienti da fonti diverse, facilitando l’individuazione dei problemi che attraversano diversi provider cloud. Le sue integrazioni pronte all’uso e le mappe dei servizi aiutano a visualizzare dipendenze e prestazioni in architetture distribuite. Questo rende Datadog una valida alternativa a Grafana per le organizzazioni che necessitano di una profonda osservabilità cross-cloud senza dover integrare diversi strumenti.
Caratteristiche principali di Datadog
Alcune funzionalità che distinguono Datadog nella visualizzazione dei dati e nell’osservabilità includono:
- Dashboard personalizzabili: crea visualizzazioni su misura utilizzando widget drag-and-drop e una vasta gamma di tipi di grafici.
- Monitoraggio sintetico: simula le interazioni degli utenti e monitora gli endpoint API per rilevare preventivamente eventuali problemi.
- Rilevamento anomalie: identifica automaticamente pattern insoliti nelle metriche utilizzando algoritmi di apprendimento automatico.
- Controllo degli accessi basato sui ruoli: gestisci i permessi degli utenti e limita l’accesso a dati e dashboard sensibili.
Integrazioni Datadog
Le integrazioni includono AWS, Google Cloud, Kubernetes, Docker, Slack, PagerDuty, Jenkins, GitHub, MongoDB e altri.
Pros and Cons
Pros:
- Supporta il monitoraggio unificato tra diversi provider cloud
- Offre gestione e analisi dei log integrate
- Fornisce avvisi in tempo reale con soglie personalizzabili
Cons:
- Supporto limitato agli ambienti solo on-premise
- Alcune funzionalità avanzate richiedono una fatturazione separata
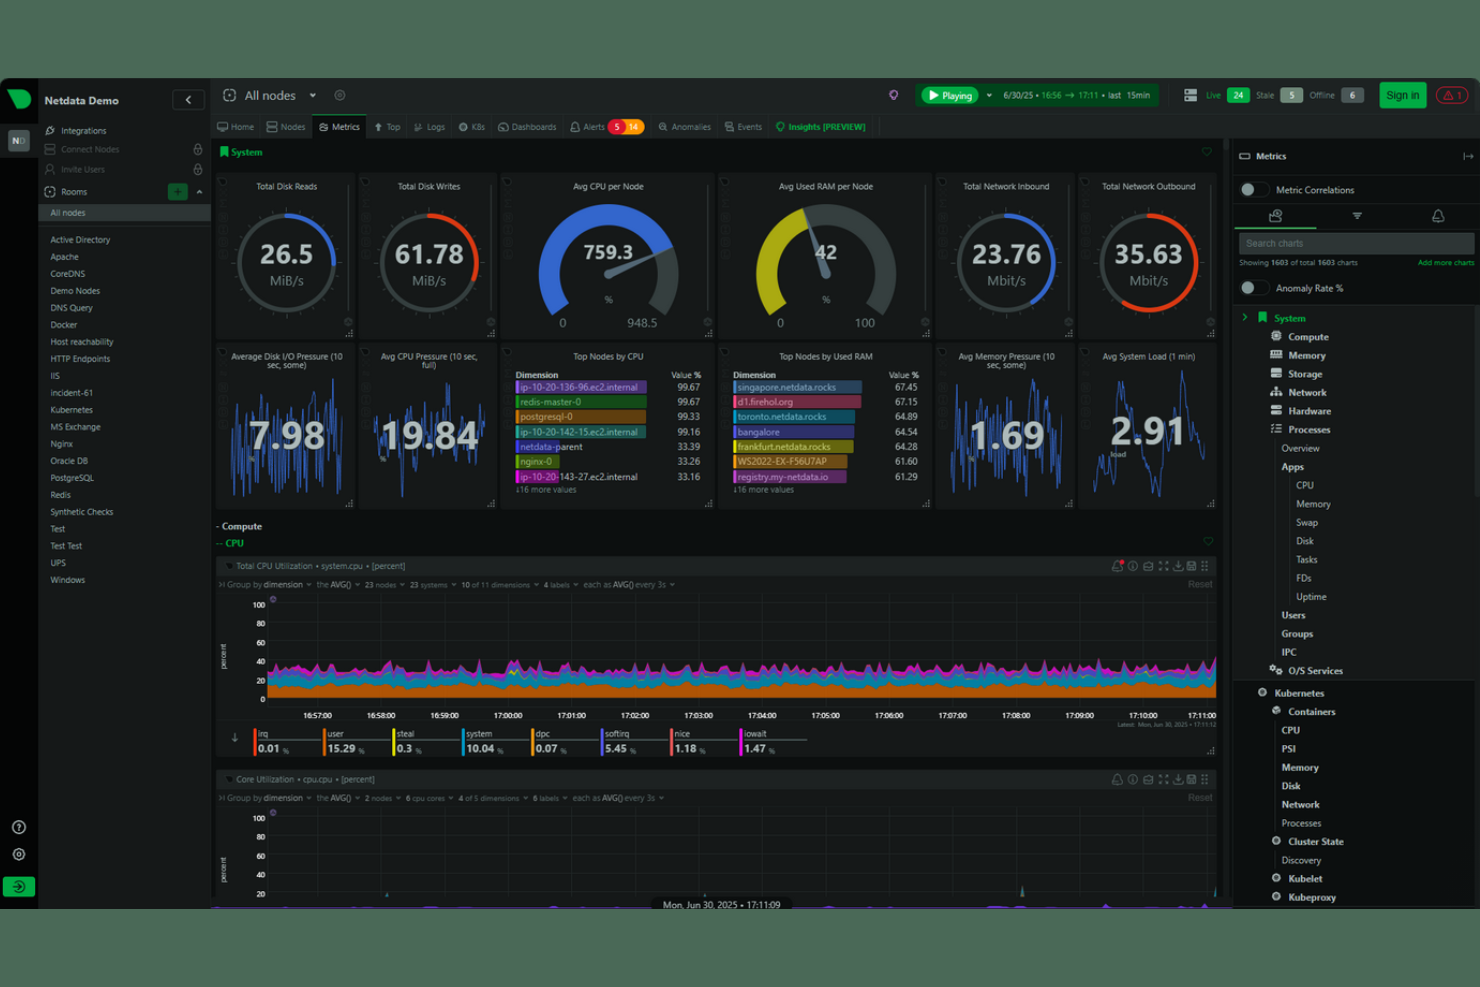
Netdata offre una piattaforma specializzata per il monitoraggio e la risoluzione dei problemi dell'infrastruttura in tempo reale. È progettata per i team IT e gli amministratori di sistema che necessitano di una visibilità istantanea sullo stato di salute e sulle prestazioni dei loro server, container e applicazioni. A differenza di molti altri strumenti di osservabilità, Netdata punta sulla raccolta di dati ad alta frequenza e su metriche granulari al secondo per una rapida individuazione dei problemi.
Per chi è ideale Netdata?
Netdata è una scelta solida per i team di operations IT e gli amministratori di sistema in organizzazioni che richiedono un monitoraggio in tempo reale e ad alta risoluzione dell'infrastruttura su ambienti distribuiti.
Perché Netdata è una valida alternativa a Grafana
Netdata si distingue per i team che necessitano di monitoraggio dell'infrastruttura in tempo reale con granularità dei dati al secondo. Ho scelto Netdata perché raccoglie e visualizza metriche ad alta frequenza su server, container e applicazioni senza ritardi evidenti. La sua rilevazione automatica di centinaia di metriche e le funzionalità di rilevamento istantaneo delle anomalie lo rendono particolarmente utile per la risoluzione di problemi live. Chiunque abbia bisogno di analisi immediate e dettagliate sulla salute dell'infrastruttura, trova in Netdata un livello di visibilità in tempo reale che molte altre piattaforme, inclusa Grafana, non offrono nativamente.
Caratteristiche principali di Netdata
Altre funzionalità di Netdata che risultano preziose per osservabilità e visualizzazione includono:
- Dashboard predefiniti: Netdata fornisce dashboard pronti all'uso per componenti infrastrutturali comuni, facilitando l'avvio del monitoraggio senza configurazioni manuali.
- Monitoraggio dello stato di salute e avvisi: La piattaforma include controlli integrati dello stato di salute e regole di avviso personalizzabili per una rilevazione proattiva dei problemi.
- Raccolta dati distribuita: Netdata supporta il monitoraggio su più nodi e località, aggregando i dati per una visione unificata.
- Vasta compatibilità con plugin: Gli utenti possono estendere le capacità di monitoraggio con plugin per database, server web e altre tecnologie diffuse.
Integrazioni di Netdata
Le integrazioni includono Kubernetes, AWS, GCP GCE, Blackbox, Docker, VMware, Proxmox, Red Hat, Windows, Hetzner e molte altre.
Pros and Cons
Pros:
- Monitoraggio dell'infrastruttura in tempo reale, al secondo
- Agente leggero con utilizzo minimo delle risorse
- Controlli integrati dello stato di salute e avvisi
Cons:
- Opzioni limitate per la conservazione dei dati storici
- Nessun supporto integrato per dashboard personalizzati

Se stai cercando una piattaforma di osservabilità unificata che integri metriche, tracce e log, New Relic merita sicuramente attenzione. È progettata per team IT, ingegneri DevOps e SRE che necessitano di una profonda visibilità sugli stack applicativi moderni. New Relic ti aiuta a individuare rapidamente i problemi e a comprendere lo stato di salute dei sistemi in ambienti complessi e distribuiti.
Per chi è più indicato New Relic?
New Relic è una scelta valida per i team DevOps e le organizzazioni IT di medie e grandi imprese che gestiscono sistemi complessi e distribuiti.
Perché New Relic è una valida alternativa a Grafana
Ciò che distingue New Relic come alternativa a Grafana è la sua capacità di correlare la telemetria dell'intero stack—metriche, tracce e log—in un'unica piattaforma. Ho scelto New Relic per i team che hanno bisogno di collegare rapidamente i dati tra infrastruttura, applicazione e esperienza utente senza cambiare strumento. Il suo linguaggio di query unificato e le visualizzazioni curate facilitano l'analisi degli incidenti e la comprensione del comportamento dei sistemi in ambienti distribuiti. Questo approccio aiuta i team IT e DevOps a superare la semplice creazione di dashboard per ottenere una vera osservabilità end-to-end.
Caratteristiche principali di New Relic
Altre funzionalità che rendono New Relic un'opzione solida per l'osservabilità e la visualizzazione includono:
- Monitoraggio sintetico: Simula le interazioni degli utenti per testare proattivamente le prestazioni di applicazioni e API.
- Politiche di avviso personalizzabili: Ti consente di definire soglie e condizioni specifiche per l'invio di avvisi sull'intero stack.
- Monitoraggio di app mobili e browser: Monitora in tempo reale le esperienze reali degli utenti su applicazioni web e mobile.
- Monitoraggio dell'infrastruttura: Fornisce visibilità dettagliata su server, container e risorse cloud.
Integrazioni di New Relic
Le integrazioni includono AWS, Azure, Google Cloud Platform, Kubernetes, Prometheus, Kafka, MySQL, NGINX, WordPress e Docker.
Pros and Cons
Pros:
- Correla metriche, tracce e log in modo nativo
- Tracing distribuito integrato per microservizi
- Rilevamento automatico di anomalie con insight di intelligenza artificiale
Cons:
- I widget delle dashboard personalizzate sono più limitati
- Richiede l'installazione di un agente su tutti gli host

Splunk è una piattaforma dati progettata per le organizzazioni che hanno bisogno di raccogliere, ricercare e analizzare enormi volumi di dati macchina. È particolarmente apprezzata dai team IT, di sicurezza e delle operazioni nelle grandi imprese che necessitano di visibilità in tempo reale su ambienti complessi. Se cerchi una soluzione in grado di gestire origini dati eterogenee e offrire insight azionabili su larga scala, Splunk è da prendere in considerazione.
Per chi è ideale Splunk?
Splunk è adatto a grandi imprese e team IT che devono acquisire, monitorare e analizzare grandi volumi di dati macchina su sistemi diversi.
Perché Splunk è una valida alternativa a Grafana
Quando hai bisogno di gestire l'ingestione dati a livello aziendale, Splunk offre funzionalità che vanno oltre la maggior parte degli strumenti di visualizzazione. Ho scelto Splunk per la sua capacità di raccogliere, indicizzare e cercare enormi volumi di dati macchina da praticamente qualsiasi fonte in tempo reale. Le sue funzioni di correlazione degli eventi e ricerca avanzata aiutano i team IT e di sicurezza a identificare rapidamente pattern e anomalie in ambienti complessi. Per le organizzazioni che desiderano centralizzare l'osservabilità e interpretare flussi di dati ad alta velocità, Splunk si distingue come una solida alternativa a Grafana.
Funzionalità principali di Splunk
Altre funzionalità che distinguono Splunk per osservabilità e visualizzazione includono:
- Dashboard personalizzabili: Crea dashboard interattive con un'ampia gamma di opzioni di visualizzazione su misura per i tuoi dati.
- Avvisi e notifiche: Configura avvisi e notifiche in tempo reale basati su specifici criteri di ricerca o soglie.
- Accelerazione dei modelli di dati: Velocizza report e analisi creando modelli di dati accelerati per i set di dati interrogati più frequentemente.
- Controllo degli accessi basato sui ruoli: Gestisci i permessi degli utenti e l'accesso ai dati con controlli dettagliati basati sui ruoli.
Integrazioni Splunk
Le integrazioni includono AWS, Microsoft Windows, Google Cloud Platform, Microsoft Cloud Services, Unix e Linux, Okta Identity Cloud, ServiceNow e altri.
Pros and Cons
Pros:
- Gestione e analisi dei log di altissimo livello
- Gestisce enormi volumi di dati su larga scala
- Gestione avanzata e monitoraggio degli avvisi
Cons:
- Velocità di ricerca più lenta su dataset molto ampi
- Interfaccia utente datata rispetto ai concorrenti

Kibana è una piattaforma di visualizzazione e analisi progettata specificamente per i dati archiviati in Elasticsearch. È una scelta ideale per i team che devono esplorare, analizzare e presentare grandi volumi di dati di log o di eventi in tempo reale. Se la tua organizzazione si affida all'Elastic Stack per la ricerca o l'osservabilità, Kibana ti aiuta a trasformare i dati grezzi in informazioni utili per l'azione.
A chi è più adatto Kibana?
Kibana è adatto ai team IT e DevOps di organizzazioni che utilizzano Elasticsearch per gestire e analizzare dati di log, eventi o operativi su larga scala.
Perché Kibana è una valida alternativa a Grafana
Kibana si distingue come alternativa a Grafana perché è stato progettato appositamente per la visualizzazione e l'analisi dei dati archiviati in Elasticsearch. Ho scelto Kibana per i team che necessitano di una profonda integrazione nativa con l'Elastic Stack, soprattutto quando si lavora con dati di log ed eventi su larga scala. Le sue funzionalità, come le dashboard interattive in tempo reale e le avanzate capacità di ricerca, permettono di analizzare i dati di Elasticsearch senza configurazioni aggiuntive. Se i tuoi flussi di lavoro di osservabilità dipendono da Elasticsearch, Kibana offre strumenti di visualizzazione strettamente allineati alle tue fonti dati.
Funzionalità principali di Kibana
Altre funzionalità di Kibana che risultano preziose per la visualizzazione dei dati e l'osservabilità includono:
- Canvas Workpad: Crea visualizzazioni infografiche curate nei minimi dettagli utilizzando dati live di Elasticsearch.
- Integrazione con il Machine Learning: Rileva anomalie e prevede tendenze direttamente all'interno delle tue dashboard.
- Controllo degli accessi basato sui ruoli: Gestisci in modo granulare i permessi e l'accesso ai dati degli utenti.
- Strumenti di reporting e condivisione: Esporta dashboard e visualizzazioni in formato PDF o condividile in modo sicuro con gli stakeholder.
Integrazioni di Kibana
Le integrazioni includono Elasticsearch, Logstash, Beats, Amazon Web Services, Microsoft Azure, Google Cloud, Slack, PagerDuty, ServiceNow, GitHub e altro ancora.
Pros and Cons
Pros:
- Query e visualizzazione dei dati di log in tempo reale
- Machine learning integrato per il rilevamento delle anomalie
- Canvas Workpad per dashboard infografiche personalizzate
Cons:
- Supporto limitato per fonti dati diverse da Elasticsearch
- Le funzionalità di alerting richiedono configurazione aggiuntiva

Dash0 è una piattaforma di osservabilità moderna progettata per i team che desiderano creare dashboard in modo programmatico. È particolarmente attraente per sviluppatori e data engineer che preferiscono flussi di lavoro basati su codice piuttosto che su interfacce punta-e-clicca. Se hai bisogno di un controllo granulare sulla creazione delle dashboard e vuoi automatizzare la visualizzazione come parte del tuo processo di deployment, Dash0 offre un approccio unico rispetto agli strumenti tradizionali.
Per chi è ideale Dash0?
Dash0 è particolarmente adatto a team di sviluppatori e data engineer in organizzazioni guidate dalla tecnologia che desiderano automatizzare la creazione delle dashboard tramite codice.
Perché Dash0 è una valida alternativa a Grafana
Quello che distingue Dash0 da Grafana e da altre alternative è il suo approccio programmatico nella creazione delle dashboard. Ho selezionato Dash0 per i team che vogliono definire, versionare e distribuire dashboard come codice, rendendo più semplice integrare la visualizzazione nelle pipeline CI/CD. La piattaforma supporta definizioni di dashboard basate su YAML e offre una CLI per gestirle in modo programmatico. Questo approccio dà agli sviluppatori maggiore controllo e flessibilità, soprattutto quando si automatizzano i flussi di lavoro di osservabilità su larga scala.
Caratteristiche principali di Dash0
Altre funzionalità che rendono Dash0 uno strumento distintivo per la visualizzazione dei dati e l'osservabilità comprendono:
- Anteprima dati in tempo reale: Visualizza aggiornamenti in tempo reale nelle dashboard mentre modifichi il codice, aiutandoti a validare subito le modifiche.
- Controllo degli accessi basato sui ruoli: Gestisci le autorizzazioni degli utenti e limita l’accesso a dashboard o fonti dati sensibili.
- Supporto per più fonti dati: Connettiti a una varietà di database e servizi cloud, inclusi PostgreSQL, MySQL e servizi AWS.
- Sviluppo widget personalizzati: Crea e riutilizza i tuoi componenti di visualizzazione tramite il framework estendibile di widget di Dash0.
Integrazioni Dash0
Le integrazioni includono AWS, Google Cloud Platform, Prometheus, OpenTelemetry, Kubernetes, PostgreSQL, MySQL, RabbitMQ, Slack e altro ancora.
Pros and Cons
Pros:
- Abilita la versioning delle dashboard tramite repository di codice
- Supporta l’anteprima in tempo reale dei dati durante le modifiche
- Permette lo sviluppo di widget personalizzati in JavaScript
Cons:
- Nessun editor integrato drag-and-drop per le dashboard
- Plugin e widget sviluppati dalla community limitati
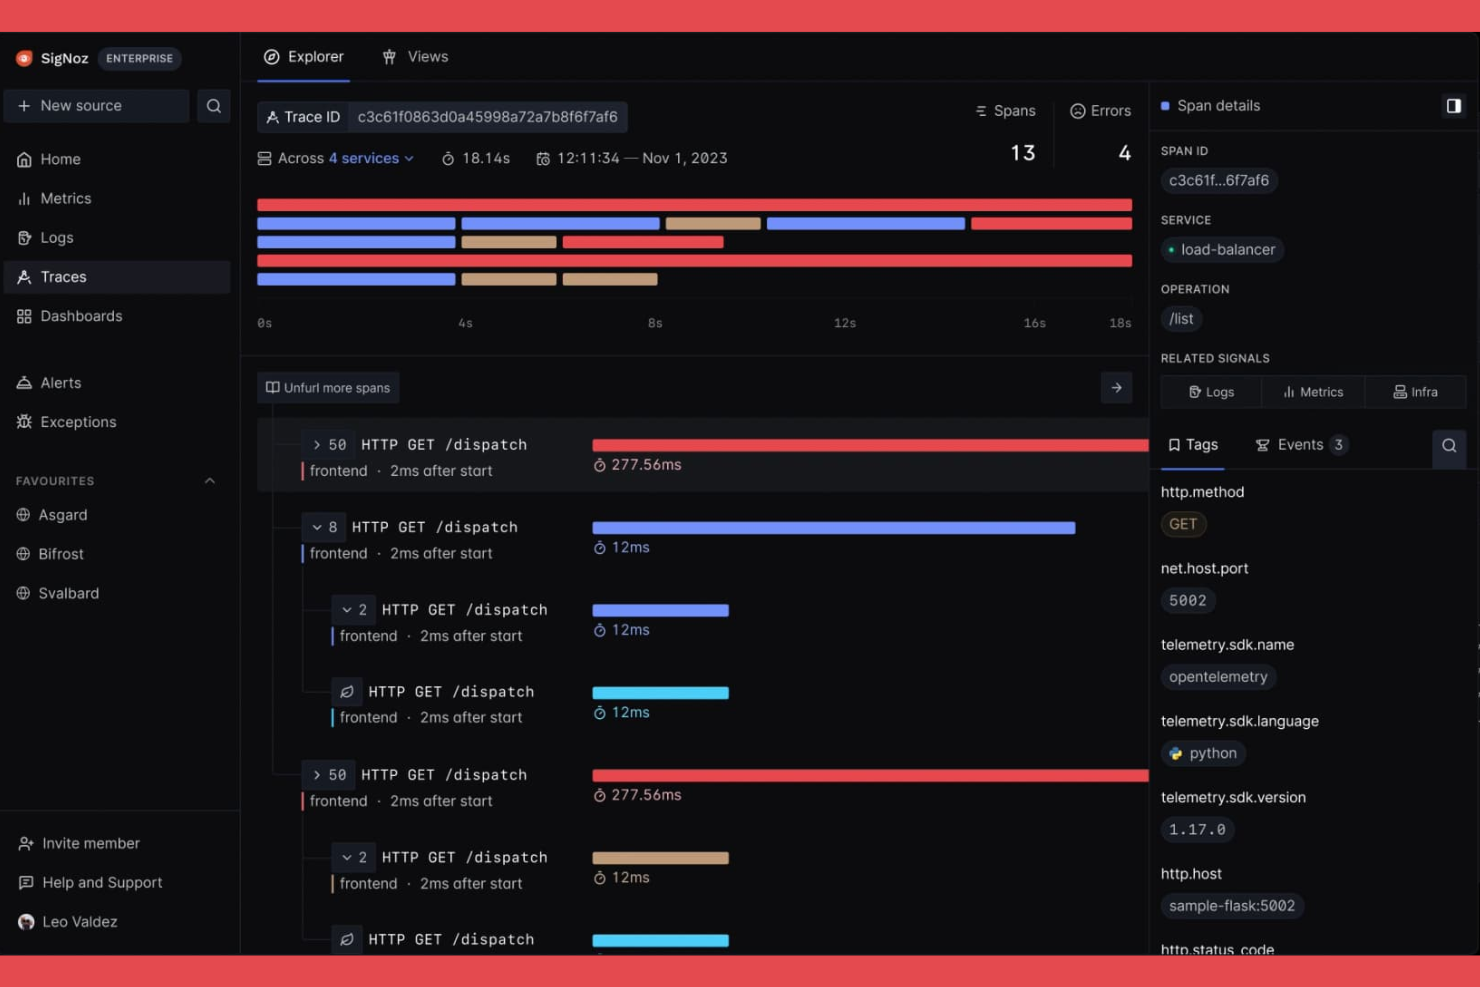
Se cerchi una piattaforma di osservabilità open-source pensata per i moderni sistemi distribuiti, SigNoz merita certamente attenzione. È progettata per i team di ingegneria che hanno bisogno di monitorare, visualizzare e risolvere i problemi delle prestazioni applicative su microservizi e ambienti cloud-native. SigNoz ti aiuta a individuare i colli di bottiglia e a tracciare i problemi nelle architetture complesse, rendendola una scelta solida per le organizzazioni che gestiscono applicazioni distribuite su larga scala.
Per chi è consigliato SigNoz?
SigNoz è adatta ai team di ingegneria in aziende guidate dalla tecnologia che necessitano di osservabilità open-source e tracing distribuito su microservizi e ambienti cloud-native.
Perché SigNoz è una valida alternativa a Grafana
Ciò che rende SigNoz una valida alternativa a Grafana è il suo forte focus sul tracing distribuito open-source. Ho scelto SigNoz per i team che devono visualizzare e analizzare trace su microservizi, qualcosa che Grafana non offre nativamente fin da subito. SigNoz offre supporto integrato per OpenTelemetry, permettendoti di acquisire, archiviare e interrogare i dati di tracing insieme a metriche e log. Questo approccio unificato all’osservabilità ti aiuta a individuare rapidamente i problemi di prestazioni in ambienti distribuiti e complessi.
Caratteristiche principali di SigNoz
Oltre alle funzionalità di tracing distribuito, SigNoz offre diverse altre caratteristiche che supportano le esigenze di osservabilità e visualizzazione:
- Dashboard personalizzabili: Crea e personalizza dashboard per visualizzare metriche e log da più fonti in un unico luogo.
- Motore di alerting: Configura avvisi basati su soglie metriche o anomalie per monitorare in modo proattivo la salute del sistema.
- Visualizzazione delle mappe di servizio: Visualizza le dipendenze e le interazioni tra servizi per comprendere meglio l’architettura applicativa.
- Controllo degli accessi basato sui ruoli: Gestisci i permessi utente e l’accesso ai dati con controlli di sicurezza granulari per i team.
Integrazioni SigNoz
Tra le integrazioni trovi Redis, PostgreSQL, MongoDB, Clickhouse, Microsoft SQL Server, Nginx, AWS EC2, AWS Lambda, AWS RDS, Temporal e altri ancora.
Pros and Cons
Pros:
- Metriche, tracce e log integrati in un’unica interfaccia
- Distribuzione flessibile in locale o cloud
- Comunità attiva con aggiornamenti frequenti alle funzionalità
Cons:
- Le funzionalità di alerting sono meno mature
- Richiede più configurazioni manuali delle dashboard
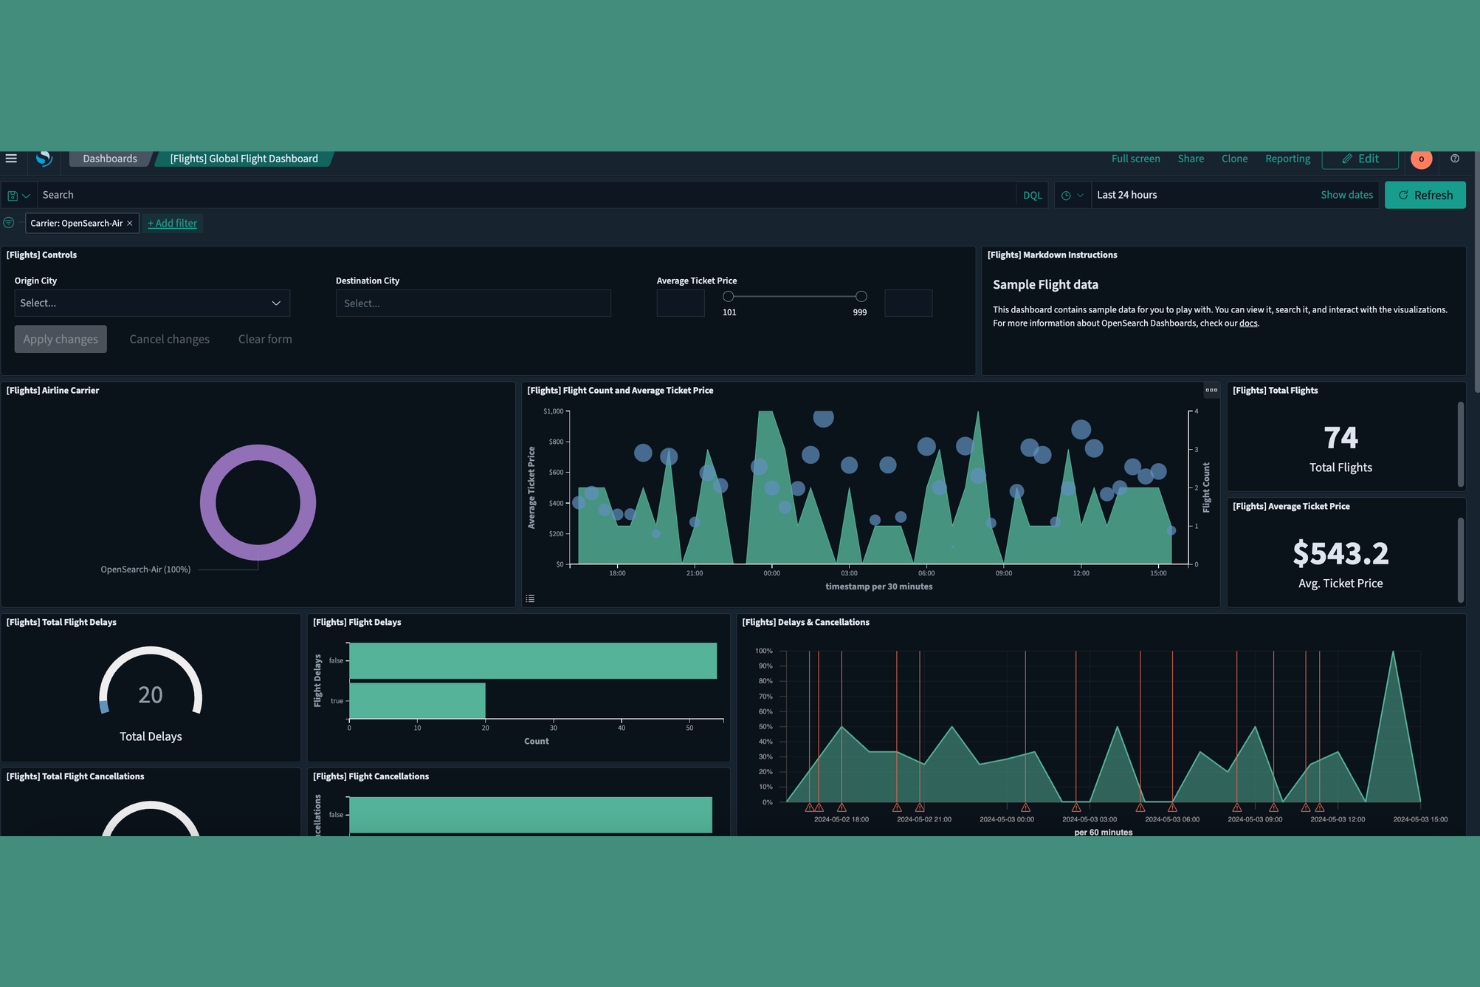
OpenSearch è una piattaforma open-source progettata per team che necessitano di funzionalità di ricerca avanzata e analisi insieme all'osservabilità. È una soluzione ideale per le organizzazioni che gestiscono grandi quantità di dati di log o che richiedono capacità di ricerca personalizzabili attraverso sistemi distribuiti. Se cerchi una soluzione che vada oltre la semplice creazione di dashboard e offra un'esplorazione approfondita dei dati, OpenSearch si distingue.
A chi è maggiormente indicato OpenSearch?
OpenSearch è una buona scelta per team IT e ingegneri in aziende o organizzazioni di medie dimensioni che necessitano di ricerca, analisi e osservabilità scalabili su infrastrutture distribuite.
Perché OpenSearch è una valida alternativa a Grafana
Ciò che distingue OpenSearch come alternativa a Grafana è il suo motore integrato di ricerca e analisi, che va oltre la semplice creazione di dashboard. Ho scelto OpenSearch per i team che hanno necessità di interrogare, analizzare e visualizzare enormi volumi di dati di log ed eventi in tempo reale. Le sue capacità di ricerca full-text e il linguaggio di query personalizzabile consentono di esplorare in profondità i dati, non solo di visualizzarli. La piattaforma supporta anche l'allertamento e il rilevamento di anomalie, rendendola una scelta robusta per i casi d'uso di osservabilità in cui gli insight basati sulla ricerca sono fondamentali.
Funzionalità principali di OpenSearch
Altre funzioni che rendono OpenSearch una scelta solida per osservabilità e visualizzazione includono:
- Dashboard: Crea dashboard interattive e personalizzabili per visualizzare metriche, log e tracce provenienti da più fonti di dati.
- Controllo degli accessi basato sui ruoli: Gestisci i permessi degli utenti e l'accesso ai dati con controlli di sicurezza granulari per diversi team o individui.
- Gestione degli indici: Automatizza e monitora le politiche di ciclo di vita degli indici per ottimizzare lo storage e le prestazioni di grandi insiemi di dati.
- Pipeline di acquisizione dati: Acquisisci ed elabora dati da diverse fonti tramite pipeline integrate che supportano trasformazione e arricchimento.
Integrazioni di OpenSearch
Le integrazioni includono client Python, Java, JavaScript (Node.js), Go, Ruby, PHP, .NET, Rust e Hadoop, ed è disponibile un'API per integrazioni personalizzate.
Pros and Cons
Pros:
- Acquisizione dati flessibile da molteplici fonti
- Ottimo supporto per il controllo degli accessi basato sui ruoli
- Comunità attiva e frequenti aggiornamenti delle funzionalità
Cons:
- La documentazione può essere frammentata o obsoleta
- Le funzionalità di allertamento sono meno mature rispetto alla concorrenza

Perses è una piattaforma open source per l'osservabilità, progettata per i team che desiderano il pieno controllo sulla loro esperienza di dashboard. È particolarmente indicata per le organizzazioni che necessitano di strumenti di visualizzazione flessibili e indipendenti dal fornitore, senza la complessità delle soluzioni tradizionali. Se stai cercando un'alternativa moderna a Grafana che dia importanza alla semplicità e all'estensibilità, Perses merita considerazione.
Per chi è più indicato Perses?
Perses è la scelta ideale per team DevOps e ingegneri di piattaforma in organizzazioni che necessitano di soluzioni dashboard altamente personalizzabili e open source per l’osservabilità.
Perché Perses è una valida alternativa a Grafana
Ciò che distingue Perses da altre alternative a Grafana è la sua attenzione alla personalizzazione dei template delle dashboard. Ho scelto Perses perché permette di definire e riutilizzare template di dashboard come codice, facilitando la standardizzazione delle visualizzazioni tra team e ambienti diversi. L'approccio open source della piattaforma consente di adattare la struttura delle dashboard alle esigenze di monitoraggio senza restare vincolati a un formato proprietario. Per chi desidera automatizzare la creazione delle dashboard e mantenere coerenza su larga scala, Perses offre una soluzione moderna e flessibile.
Caratteristiche principali di Perses
Oltre alle sue funzionalità di template per dashboard, Perses offre diverse altre funzioni che supportano le esigenze di osservabilità e visualizzazione:
- Supporto per sorgente dati Prometheus: Perses si collega nativamente a Prometheus, permettendo di visualizzare metriche direttamente dallo stack di monitoraggio esistente.
- Configurazione basata su JSON: Tutte le dashboard e i pannelli sono definiti in JSON, il che li rende facili da gestire tramite versioning e da automatizzare.
- Architettura a plugin per pannelli: La piattaforma supporta tipi di pannelli estendibili, così puoi aggiungere nuove opzioni di visualizzazione man mano che le esigenze evolvono.
- Controllo degli accessi basato sui ruoli: Il sistema RBAC integrato consente di gestire i permessi degli utenti e limitare l'accesso alle dashboard sensibili.
Integrazioni di Perses
Le integrazioni includono Prometheus, Loki, Tempo, Pyroscope e altri ancora.
Pros and Cons
Pros:
- Supporto nativo per Prometheus e dati temporali
- Distribuzione leggera con dipendenze minime
- La configurazione basata su JSON permette il controllo delle versioni
Cons:
- Ecosistema di plugin più piccolo rispetto a Grafana
- Nessun supporto integrato per sorgenti dati SQL
Altre alternative a Grafana
Ecco alcune ulteriori alternative a Grafana che non sono entrate nella mia shortlist, ma che meritano comunque di essere considerate:
- OpenObserve
Ideale per l'analisi dei log ad alta ingestione
- SquaredUp
Ideale per l'integrazione con l'ecosistema Microsoft
- Chronosphere
Ideale per la scalabilità e l'affidabilità cloud-native


Criteri di selezione delle alternative a Grafana
Quando ho selezionato le migliori alternative a Grafana da includere in questo elenco, ho considerato le esigenze e i punti dolenti più comuni degli acquirenti relativi ai prodotti per la visualizzazione dei dati e le piattaforme di osservabilità, come la gestione dell’acquisizione di grandi volumi di dati e la capacità di fornire insight azionabili in tempo reale. Ho anche utilizzato il seguente schema per mantenere la valutazione strutturata ed equa:
Funzionalità principali (25% del punteggio totale)
Per essere inclusa in questa lista, ogni soluzione doveva soddisfare questi requisiti d’uso comuni:
- Visualizzare dati su serie temporali ed eventi
- Monitorare lo stato di sistemi e applicazioni
- Impostare avvisi e notifiche in tempo reale
- Aggregare dati da più fonti
- Abilitare la creazione di dashboard personalizzati
Ulteriori funzionalità distintive (25% del punteggio totale)
Per affinare ulteriormente la selezione, ho anche ricercato funzionalità uniche, come:
- Rilevamento delle anomalie basato su AI
- Workflow di risposta agli incidenti integrati
- Supporto per l'analisi di dati ad alta cardinalità
- Controlli avanzati di accesso basati sui ruoli
- Integrazioni native con fornitori di servizi cloud
Usabilità (10% del punteggio totale)
Per avere un'idea dell'usabilità di ciascun sistema, ho preso in considerazione i seguenti aspetti:
- Dashboard intuitiva e design della navigazione
- Opzioni chiare di visualizzazione dei dati
- Interfaccia utente reattiva e veloce
- Personalizzazione di viste e layout
- Accessibilità sia per utenti tecnici che non tecnici
Onboarding (10% del punteggio totale)
Per valutare l'esperienza di onboarding di ciascuna piattaforma, ho preso in esame i seguenti elementi:
- Disponibilità di tour guidati del prodotto
- Accesso a video di formazione e documentazione
- Dashboard preimpostate e modelli di allerta
- Checklist di onboarding interattive o chatbot
- Webinar di onboarding dal vivo o registrati
Assistenza Clienti (10% del punteggio totale)
Per valutare i servizi di assistenza clienti offerti da ciascun fornitore software, ho considerato i seguenti fattori:
- Disponibilità del supporto 24/7
- Accesso a un portale di supporto dedicato
- Opzioni di supporto tramite chat live e telefono
- Forum della community e knowledge base
- Tempi di risposta e risoluzione rapidi
Rapporto Qualità-Prezzo (10% del punteggio totale)
Per valutare il rapporto qualità-prezzo di ogni piattaforma, ho considerato i seguenti elementi:
- Modelli di prezzo trasparenti e flessibili
- Opzioni di prova gratuita o freemium
- Funzionalità incluse in ogni fascia di prezzo
- Scalabilità dei costi per esigenze di dati crescenti
- Allineamento del prezzo con la profondità delle funzionalità
Recensioni dei Clienti (10% del punteggio totale)
Per avere un'idea della soddisfazione generale dei clienti, ho preso in considerazione quanto segue durante la lettura delle recensioni:
- Feedback positivi su affidabilità e uptime
- Segnalazioni di supporto clienti reattivo
- Soddisfazione degli utenti per le funzionalità di visualizzazione
- Commenti sulle capacità di integrazione
- Feedback sulla facilità di configurazione e utilizzo
Perché Cercare un'Alternativa a Grafana?
Sebbene Grafana sia una buona scelta come piattaforma di visualizzazione dei dati e osservabilità, esistono vari motivi per cui alcuni utenti cercano soluzioni alternative. Potresti essere alla ricerca di un'alternativa a Grafana perché…
- Hai bisogno di gestione e analisi dei log integrata
- Richiedi sicurezza e conformità di livello enterprise
- Vuoi supporto nativo per dati ad alta cardinalità
- Hai bisogno di funzionalità avanzate di alerting e risposta agli incidenti
- Preferisci una soluzione cloud completamente gestita
Se ti ritrovi in uno di questi casi, sei nel posto giusto. Il mio elenco contiene diverse piattaforme di visualizzazione dati e osservabilità, più adatte a team che affrontano queste sfide con Grafana e che sono in cerca di soluzioni alternative.
Funzionalità Principali di Grafana
Ecco alcune delle funzionalità principali di Grafana, per aiutarti a confrontare e valutare cosa offrono le soluzioni alternative:
- Dashboard personalizzati: Crea e organizza dashboard interattivi che visualizzano dati provenienti da più fonti in tempo reale, permettendo ai team di monitorare metriche e tendenze a colpo d'occhio.
- Plugin per sorgenti dati: Connettiti a un'ampia gamma di database, servizi cloud e strumenti di monitoraggio tramite plugin nativi, rendendo semplice aggregare e visualizzare set di dati eterogenei.
- Sistema di allerta: Configura avvisi flessibili basati su regole che notificano gli utenti via email, Slack, PagerDuty o altri canali quando le metriche superano soglie definite.
- Templating: Usa variabili e template dinamici per creare dashboard riutilizzabili che si adattano a diversi ambienti, team o progetti senza riconfigurazioni manuali.
- Annotazioni: Aggiungi note contestuali e marcatori direttamente sui grafici per evidenziare incidenti, deploy o altri eventi significativi per una migliore analisi della causa principale.
- Controlli di accesso utente: Gestisci i permessi e i ruoli per controllare chi può visualizzare, modificare o amministrare dashboard e sorgenti dati, favorendo la collaborazione sicura.
- Editor dei pannelli: Personalizza i pannelli di visualizzazione con una varietà di tipi di grafici, opzioni di visualizzazione ed editor di query per adattare la presentazione dei dati alle esigenze specifiche.
- Controlli per l’intervallo temporale: Regola le finestre temporali in modo interattivo per approfondire periodi specifici o confrontare tendenze su diversi intervalli, supportando un'analisi dettagliata.
- Ecosistema di plugin: Estendi le funzionalità di Grafana con una vasta libreria di plugin community e commerciali per nuove visualizzazioni, sorgenti dati e integrazioni applicative.
- Condivisione snapshot: Condividi snapshot statici o in tempo reale dei dashboard con gli stakeholder, facilitando la comunicazione dei risultati o la collaborazione nel troubleshooting senza esporre dati sensibili.