10 Migliori Strumenti di Mappatura della Rete Recensiti nel 2026

Migliori strumenti di mappatura della rete - Shortlist


I migliori strumenti di mappatura della rete aiutano i team a visualizzare le infrastrutture, individuare i dispositivi connessi, tracciare le dipendenze e ridurre i tempi di inattività causati da problemi di configurazione. Questi strumenti offrono ai team IT e di rete una visione chiara di come i sistemi interagiscono tra loro, così i problemi possono essere risolti più rapidamente.
I team si affidano spesso agli strumenti di mappatura della rete quando i diagrammi manuali non sono più aggiornati, le configurazioni errate provocano interruzioni o la presenza di dispositivi sconosciuti crea falle nella sicurezza. Queste sfide rallentano la risoluzione dei problemi, aumentano i rischi e rendono più difficile la collaborazione tra i team di rete, sicurezza e operations.
Con oltre 20 anni di esperienza nel settore come Chief Technology Officer, ho testato e recensito decine di strumenti di mappatura delle reti in ambienti reali per valutarne precisione, integrazioni e facilità d'uso. Questa guida evidenzia i migliori strumenti di mappatura della rete che migliorano la visibilità, supportano una risoluzione dei problemi più rapida e aiutano i team a mantenere un funzionamento affidabile della rete. Ogni recensione copre funzionalità, vantaggi e svantaggi e casi d'uso ideali per aiutarti a scegliere lo strumento giusto.
Perché fidarti delle nostre recensioni sui software
Testiamo e recensiamo software di sviluppo SaaS dal 2023. In quanto esperti di tecnologia, sappiamo quanto sia fondamentale e difficile prendere la decisione giusta quando si tratta di scegliere un software. Investiamo in ricerche approfondite per aiutare il nostro pubblico a prendere decisioni d'acquisto più consapevoli.
Abbiamo testato più di 2.000 strumenti per diversi casi d'uso nello sviluppo SaaS e scritto oltre 1.000 recensioni approfondite di software. Scopri come rimaniamo trasparenti & dai un'occhiata alla nostra metodologia di valutazione dei software.
Table of Contents
Riepilogo migliori strumenti di mappatura della rete
Questo grafico comparativo riassume i dettagli sui prezzi delle migliori selezioni di strumenti di mappatura della rete, così potrai trovare quello più adatto al tuo budget e alle tue esigenze di business.
| Tool | Best For | Trial Info | Price | ||
|---|---|---|---|---|---|
| 1 | Best for automated network discovery | 14-day free trial available | Pricing upon request | Website | |
| 2 | Best for network mapping & insights for MSPs | 14-day free trial + free demo available | Pricing upon request | Website | |
| 3 | Best for real-time network visualization | Free demo available | From $245/25 devices | Website | |
| 4 | Best for remote monitoring | Free 14-day trial | From $1.50/month/managed device | Website | |
| 5 | Best for dependency mapping | Free plan + free demo + 14-day free trial available | From $19,000/up to 300 servers/year | Website | |
| 6 | Best for small networks | Not available | Free plan available | Website | |
| 7 | Best for security auditing | Not available | Free to use | Website | |
| 8 | Best for real-time mapping | 30-day free trial | From $302/year | Website | |
| 9 | Best for customizable alerts | Free trial available | From 2,149/year | Website | |
| 10 | Best for threat detection | Free demo available | Pricing upon request | Website |

-

TestDevLab
Visit Website -
Site24x7
Visit WebsiteThis is an aggregated rating for this tool including ratings from Crozdesk users and ratings from other sites.4.7 -
GitHub Actions
Visit WebsiteThis is an aggregated rating for this tool including ratings from Crozdesk users and ratings from other sites.4.8


Recensioni dei migliori strumenti di mappatura della rete
Qui sotto trovi i miei riepiloghi dettagliati dei migliori strumenti di mappatura della rete della mia shortlist. Le mie recensioni esaminano a fondo le principali funzionalità, i pro e i contro, le integrazioni e i casi d’uso ideali di ogni strumento, per aiutarti a trovare quello più adatto a te.
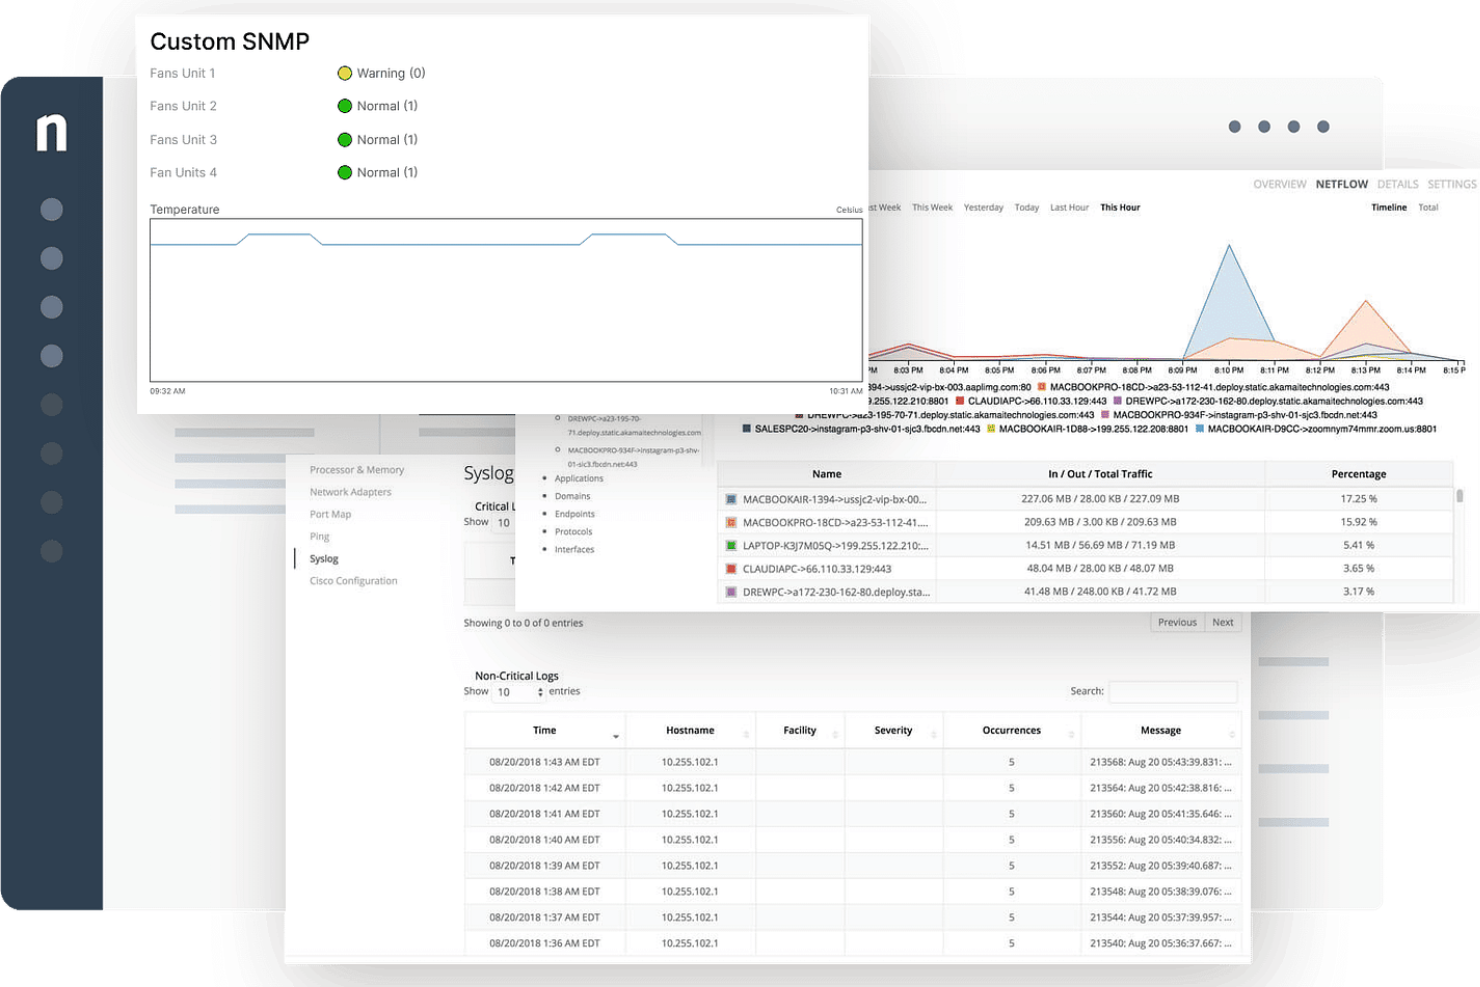
NinjaOne is an endpoint management platform that provides automated network discovery, device inventory, and real-time monitoring for mapping and managing networked assets.
Who Is NinjaOne Best For?
NinjaOne is a strong fit for IT teams and managed service providers (MSPs) that need centralized visibility and control across large, distributed device environments.
Why I Picked NinjaOne
I've included NinjaOne in my top picks because its credential-free scanning is genuinely useful when you're trying to get fast visibility across a network without the overhead of deploying agents first. It automatically discovers Windows, macOS, Linux, network hardware, and IoT devices across any IP range—managed, unmanaged, or unknown. I also like that you can schedule recurring discovery scans or run them on demand, and all results feed into a centralized Discovered Devices view where you can classify and convert devices into managed assets. That combination of agentless discovery and a unified inventory makes it a practical choice for IT teams dealing with sprawling or frequently changing environments.
NinjaOne Key Features
- Autonomous patch management: Automates patch deployment across Windows, macOS, and Linux endpoints, covering over 200 applications with continuous compliance enforcement.
- Condition-based endpoint remediation: Uses scripting triggers to automatically detect and correct endpoint issues without requiring manual technician intervention.
- Real-time health monitoring: Tracks device health, configurations, and compliance status across all managed endpoints from a single console.
- Software and OS deployment: Rolls out software, updates, and configurations across endpoints using repeatable, automation-driven workflows.
NinjaOne Integrations
NinjaOne offers native integrations with ConnectWise, Autotask, TeamViewer, Splashtop, Webroot, Bitdefender, and StorageCraft. An API is available for custom integrations.
Pros and Cons
Pros:
- Comprehensive endpoint management capabilities
- Effective patch management automation
- Centralized control over device configurations
Cons:
- Initial setup may require time and resources
- The mobile app could offer more functionalities
New Product Updates from NinjaOne
NinjaOne Adds Windows Agent Deployment to Network Discovery
NinjaOne adds Windows agent deployment directly from Network Discovery. This update helps IT teams move from discovering unmanaged Windows devices to monitoring, patching, and managing them faster. For more information, visit NinjaOne’s official site.

Auvik is a cloud-based network mapping and monitoring platform that provides automated network discovery, real-time topology visualization, and configuration management for IT teams and managed service providers.
Who Is Auvik Best For?
Auvik is a strong fit for MSPs and internal IT teams that manage multi-site or multi-client network environments and need centralized visibility across all of them.
Why I Picked Auvik
I picked Auvik as one of the best network mapping tools because of how well it handles the multi-client complexity that MSPs deal with every day. The automated topology mapping updates in real time as networks change, so my team is never working from a stale diagram when troubleshooting a client issue. I also like the multi-layer visibility feature, which lets you toggle between physical, VLAN, and clustered topology views on the same map—that's genuinely useful when you're trying to trace a path from a device to the internet across a client's infrastructure. The path analysis feature ties it all together, showing you every alert and performance data point along a specific device path so you can pinpoint root cause without jumping between tools.
Auvik Key Features
- Network traffic analysis: Auvik captures and analyzes NetFlow and sFlow data so you can see who's on your network, what applications they're running, and where traffic is going—even when it's encrypted.
- Configuration backup and change tracking: Auvik automatically backs up device configurations and logs every change, letting you compare versions side-by-side and restrict modifications to authorized admins.
- Automated network inventory: Auvik continuously captures device details—IP addresses, firmware versions, interfaces, and more—and keeps that inventory updated without manual input.
- Customizable alerting: Auvik includes a library of 64+ preconfigured alerts and lets you tailor routing so the right technician gets notified for the right issue.
Auvik Integrations
Auvik offers native integrations with ConnectWise Manage, Autotask, ServiceNow, Slack, PagerDuty, Freshdesk, Zendesk, and Microsoft Teams. An API is available for custom integrations.
Pros and Cons
Pros:
- Granular role-based access control
- Cloud-based with remote accessibility
- Automated network mapping feature
Cons:
- Some alerts may trigger false positives
- Limited offline functionality support
New Product Updates from Auvik
Auvik Launches Aurora AI Assistance
Auvik adds Aurora AI assistance to help teams prioritize issues, troubleshoot problems, and take action using network context. This update brings AI-powered support directly into Auvik workflows. For more information, visit Auvik’s official site.
 .
.
ManageEngine OpManager is a network mapping and monitoring platform that provides automated network discovery, real-time topology visualization, and performance monitoring for IT infrastructure.
Who Is ManageEngine OpManager Best For?
ManageEngine OpManager is a good fit for IT teams in mid-size to large enterprises that need centralized visibility across complex, multi-vendor network environments.
Why I Picked ManageEngine OpManager
I picked ManageEngine OpManager as one of the best because of how much ground its real-time network visualization covers in a single console. I particularly like the Layer 2 maps, which don't just show device connections—they also map uplink dependencies between seed routers and downstream devices, so when a router goes down, my team can immediately see the blast radius instead of chasing alerts one by one. The business views feature is another one I rely on heavily: you can drag and drop devices into custom maps grouped by business service, then watch live traffic, speeds, and availability update in real time. For teams managing distributed infrastructure across multiple sites, that kind of at-a-glance visibility into what's healthy and what isn't is genuinely hard to replicate.
ManageEngine OpManager Key Features
- Automatic network discovery: OpManager discovers devices across your network using SNMP, ICMP, and WMI protocols, identifying and classifying over 15,000 interfaces per minute.
- Topology-aware fault correlation: When a core device fails, OpManager suppresses redundant alerts from dependent devices and visually flags the affected path on the map.
- 3D data center floor view: Create a 3D replica of your data center with all racks, showing real-time device status across your physical infrastructure.
- IT workflow automation: Build drag-and-drop rule-based workflows that trigger automated responses to network incidents, such as pinging dependent nodes or restarting an interface.
ManageEngine OpManager Integrations
ManageEngine OpManager offers native integrations with ServiceDesk Plus, Jira Service Management, Slack, Microsoft Teams, and Opsgenie. An API is available for custom integrations.
Pros and Cons
Pros:
- Automated, scheduled network discovery
- Supports multiple vendor environments
- Real-time, auto-updating network maps
Cons:
- Pricing may be high for small teams
- Initial setup can be complex
New Product Updates from ManageEngine OpManager
ManageEngine OpManager Vendor Templates and NCM XML Import
ManageEngine OpManager introduces enhanced vendor template integration and device template import for the NCM module using XML files. This update helps teams improve device classification and speed up configuration workflows. For more information, visit ManageEngine OpManager’s official site.
 .
.
Domotz is a network monitoring and mapping platform that provides automated device discovery, real-time topology visualization, and remote access tools for managing complex IT environments.
Who Is Domotz Best For?
Domotz is a strong fit for MSPs and IT teams that manage distributed networks across multiple client sites.
Why I Picked Domotz
I picked Domotz because its remote monitoring performs well across distributed, multi-site environments. The VPN on Demand feature gives direct access to devices on a remote network without a pre-configured VPN tunnel, so my team can access a client's environment and manage multiple devices remotely without an on-site visit. I also like the secure remote connection tool; it automatically scans open ports and lets you access device consoles via TCP, SSH, RDP, or Telnet with a single click. That kind of access, paired with real-time alerting, means my team is often investigating and resolving issues before a client even notices something is wrong.
Domotz Key Features
- Network topology mapping: Automatically plots all endpoints and network topology in an intuitive, navigable visual map.
- SNMP monitoring: Monitors any SNMP (v1, v2, v3) OID values and lets you configure custom thresholds for alerting on specific sensors.
- Perimeter security scan: Continuously monitors for open ports on devices that could create vulnerabilities across your network.
- Network reporting: Generates automated or on-demand monthly reports covering network and device performance, user activity logging, and other metrics.
Domotz Integrations
Domotz offers native integrations with ConnectWise, Datto Autotask PSA, Freshservice, ServiceNow, Slack, Microsoft Teams, Webhooks, and has an API for custom integrations.
Pros and Cons
Pros:
- Automated alerts for network issues
- Remote network monitoring capability
- Intuitive and user-friendly interface
Cons:
- Can generate excessive alert noise
- Requires agent installation on devices

Faddom is a network mapping platform that provides agentless discovery, real-time topology visualization, and application dependency mapping for hybrid IT environments.
Who Is Faddom Best For?
Faddom suits IT and infrastructure teams in mid-to-large enterprises that need visibility into complex, hybrid environments spanning on-premises and cloud systems.
Why I Picked Faddom
Faddom earns its spot on my shortlist because of how well it handles application dependency mapping in hybrid environments. I like that it uses agentless, passive traffic analysis to automatically discover and map dependencies between servers, applications, and services—without requiring any configuration changes or downtime. My team can see exactly what's talking to what across on-premises and cloud infrastructure in near real-time. The change detection feature flags dependency shifts so we're not caught off guard during migrations or incident response.
Faddom Key Features
- Business application grouping: Automatically groups discovered servers and services into logical business applications based on observed traffic patterns.
- Wave-based migration planning: Organizes servers and applications into migration waves, letting you sequence data center or cloud migrations based on dependency data.
- IT asset documentation: Continuously maintains an up-to-date inventory of all servers, instances, and their connections across physical, virtual, and cloud environments.
- Internal attack surface visibility: Identifies unexpected or unauthorized server-to-server communication paths to support microsegmentation and security posture reviews.
Faddom Integrations
Integrations include ServiceNow, Splunk, AWS (including VPC Flow Logs), Microsoft Azure, Google Cloud Platform (GCP), VMware, New Relic, Docker, and various SIEM and CMDB platforms via API.
Pros and Cons
Pros:
- Agentless deployment with minimal friction
- Strong integration capabilities
- Automated discovery & dependency mapping
Cons:
- Domain-join dependency with login limitations
- Limited reporting and export functionality
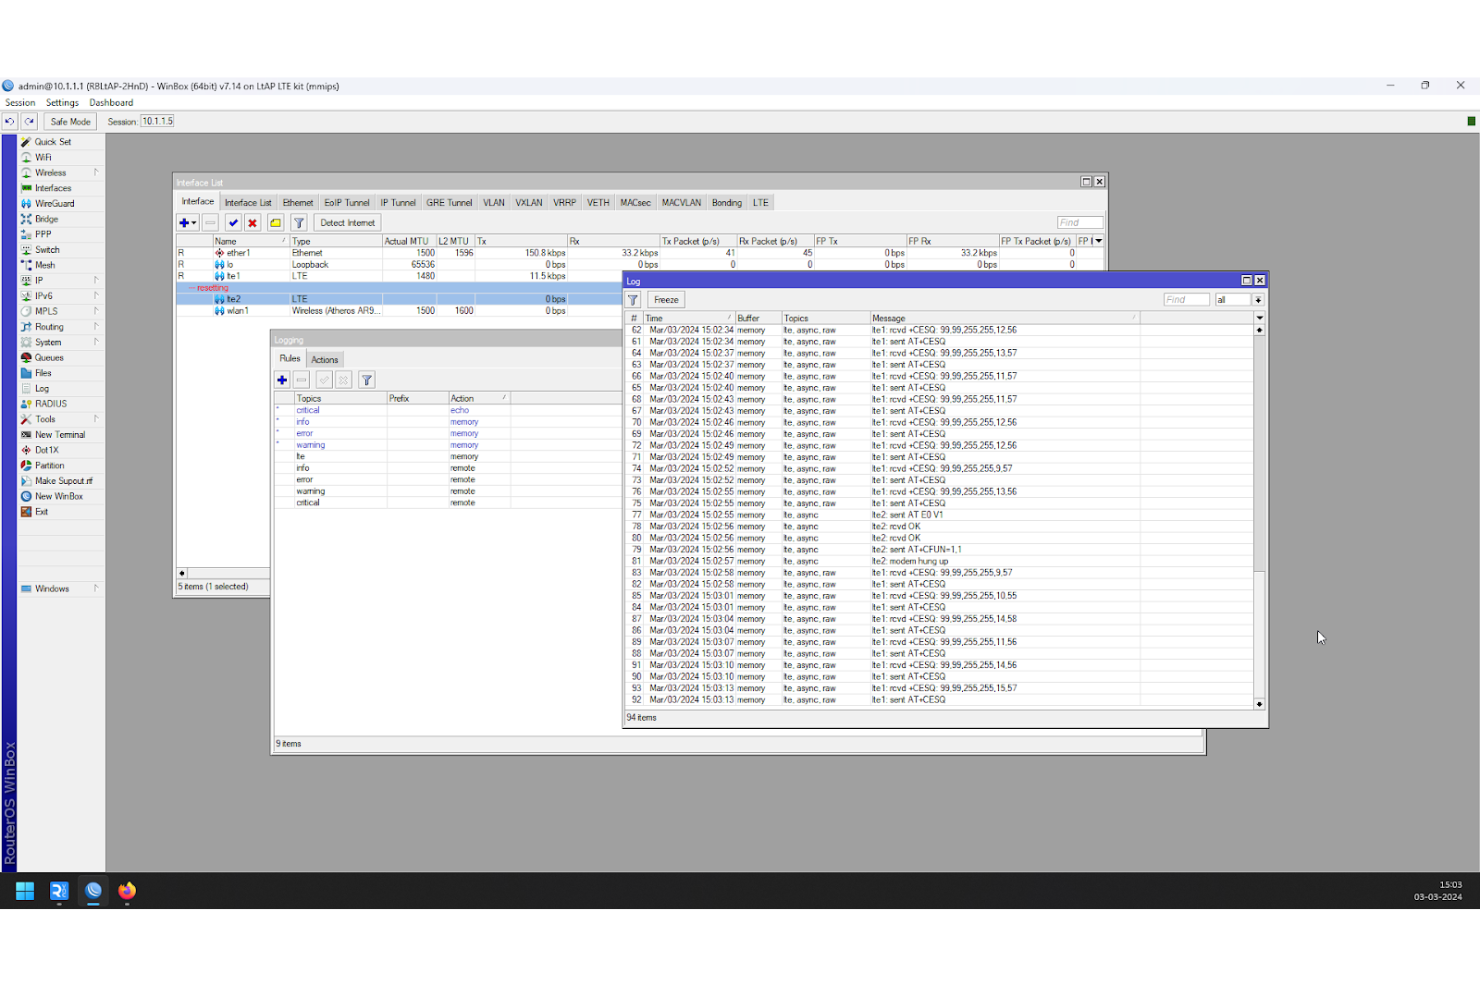
MikroTik (The Dude) is a network mapping and monitoring tool that automatically discovers devices, visualizes network topology, and provides real-time status updates for connected hardware.
Who Is MikroTik (The Dude) Best For?
The Dude is a good fit for IT administrators and network engineers managing small networks who need a free, lightweight tool for device discovery and topology visualization.
Why I Picked MikroTik (The Dude)
The Dude earns its spot on my shortlist because it's one of the few network mapping tools that's genuinely built with small networks in mind—no licensing tiers, no device limits, no bloat. I like that it automatically scans specified subnets and draws a live topology map without requiring any manual device entry, which means I can get a full picture of a small office or branch network in minutes. The dependency mapping feature is particularly useful: when a parent device like a core router goes down, The Dude suppresses alerts for all downstream devices, so I'm not chasing phantom outages. It also runs as a package directly on MikroTik RouterOS hardware, so there's no need for a dedicated monitoring server.
MikroTik (The Dude) Key Features
- Custom data charts: Create graphs from SNMP OIDs or RouterOS command output to track metrics like CPU, memory, and disk usage over time.
- Built-in network tools: Run ping, traceroute, SNMP walk, bandwidth tests, and torch (real-time traffic monitoring) directly from the map interface.
- Syslog server: Collect and store device log data centrally within The Dude, with full log history viewable from the server interface.
- Web interface access: Connect to The Dude server from any browser via the built-in Webfig interface, with no client installation required.
MikroTik (The Dude) Integrations
Integrations include RouterOS, WinBox, SNMP-enabled devices (Cisco, Ubiquiti, Netonix), Syslog, ICMP, DNS, TCP, and Telegram.
Pros and Cons
Pros:
- Custom alerts for network issues
- Supports SNMP for detailed insights
- Automated network discovery tools
Cons:
- Interface may feel outdated
- Windows-only application support

NMap is an open-source network mapping and security scanning tool that helps you discover hosts, identify services, and analyze network infrastructure.
Who Is NMap Best For?
NMap suits network engineers, security professionals, and system administrators who need deep visibility into their network infrastructure.
Why I Picked NMap
NMap is on my shortlist because of the breadth of its security-auditing features. I use the Nmap Scripting Engine (NSE) to run vulnerability detection scripts against live hosts—after a vulnerability like Heartbleed is disclosed, my team can deploy a targeted NSE script within hours to identify exposed systems across the network. I also rely on NMap's OS and service version detection to build an accurate picture of what's running on each host, which is the foundation of any audit.
NMap Key Features
- Host discovery: Scan a network range to identify which hosts are online using techniques like ping sweeps and ARP requests.
- Port scanning: Detect open, closed, and filtered ports across target hosts using multiple scan types, including SYN and UDP scans.
- Traceroute: Map the network path between your machine and a target host to visualize routing and identify network hops.
- Output formats: Save scan results in multiple formats, including XML, grepable text, and normal output, for reporting and further analysis.
NMap Integrations
Integrations include Zenmap, Ncat, Ndiff, Nping, Metasploit, Nessus, OpenVAS, Splunk, ELK Stack, ManageEngine Log360, and n8n. NMap offers an API for custom integrations.
Pros and Cons
Pros:
- User-friendly interface
- Multi-platform compatibility
- Strong community support
Cons:
- Resource-intensive on large networks
- Potential legal concerns if misused
Fortra Intermapper is a network mapping and monitoring tool that provides automated network discovery, live topology visualization, and device status tracking for IT teams managing complex environments.
Who Is Fortra Intermapper Best For?
Intermapper is a good fit for network engineers and IT operations teams in mid-to-large organizations that need continuous visibility into distributed or complex network infrastructure.
Why I Picked Fortra Intermapper
I picked Intermapper as one of the best network mapping tools because of how it handles live topology visualization. The map updates in real time as device states change—when a switch goes down, the color-coded status on the map flips immediately, so my team can see exactly where the fault is without digging through logs. I also like that Intermapper auto-discovers every IP-enabled device on the network and pulls it into the map automatically, which means you're not manually building topology diagrams from scratch. On top of that, the sub-map structure lets you build a top-level overview map and drill down into segment-level detail, which is genuinely useful when you're managing a multi-site environment and need to isolate an issue to a specific building or VLAN.
Fortra Intermapper Key Features
- SNMP monitoring: Polls SNMP-enabled devices continuously to track interface status, traffic, and device health across your network.
- Multi-protocol device probing: Uses built-in probes beyond SNMP—including ICMP, TCP, HTTP, and others—to monitor servers, applications, and network devices from a single platform.
- Configurable alerting: Sends notifications via email, SMS, or sound when a device or interface crosses a defined threshold or goes down.
- Layer 3 traffic monitoring: Tracks VLAN traffic statistics, locates switch ports by MAC address, and maps Layer 3 connections across your infrastructure.
Fortra Intermapper Integrations
Integrations include AWS, Automate, Splunk, Google Earth, Google Maps, LDAP, Active Directory, RADIUS, Kerberos, and various SIEM platforms via API.
Pros and Cons
Pros:
- Customizable dashboards and reports
- Automated network performance alerts
- Real-time network visualization tools
Cons:
- Limited mobile app functionality
- Interface can feel slightly outdated
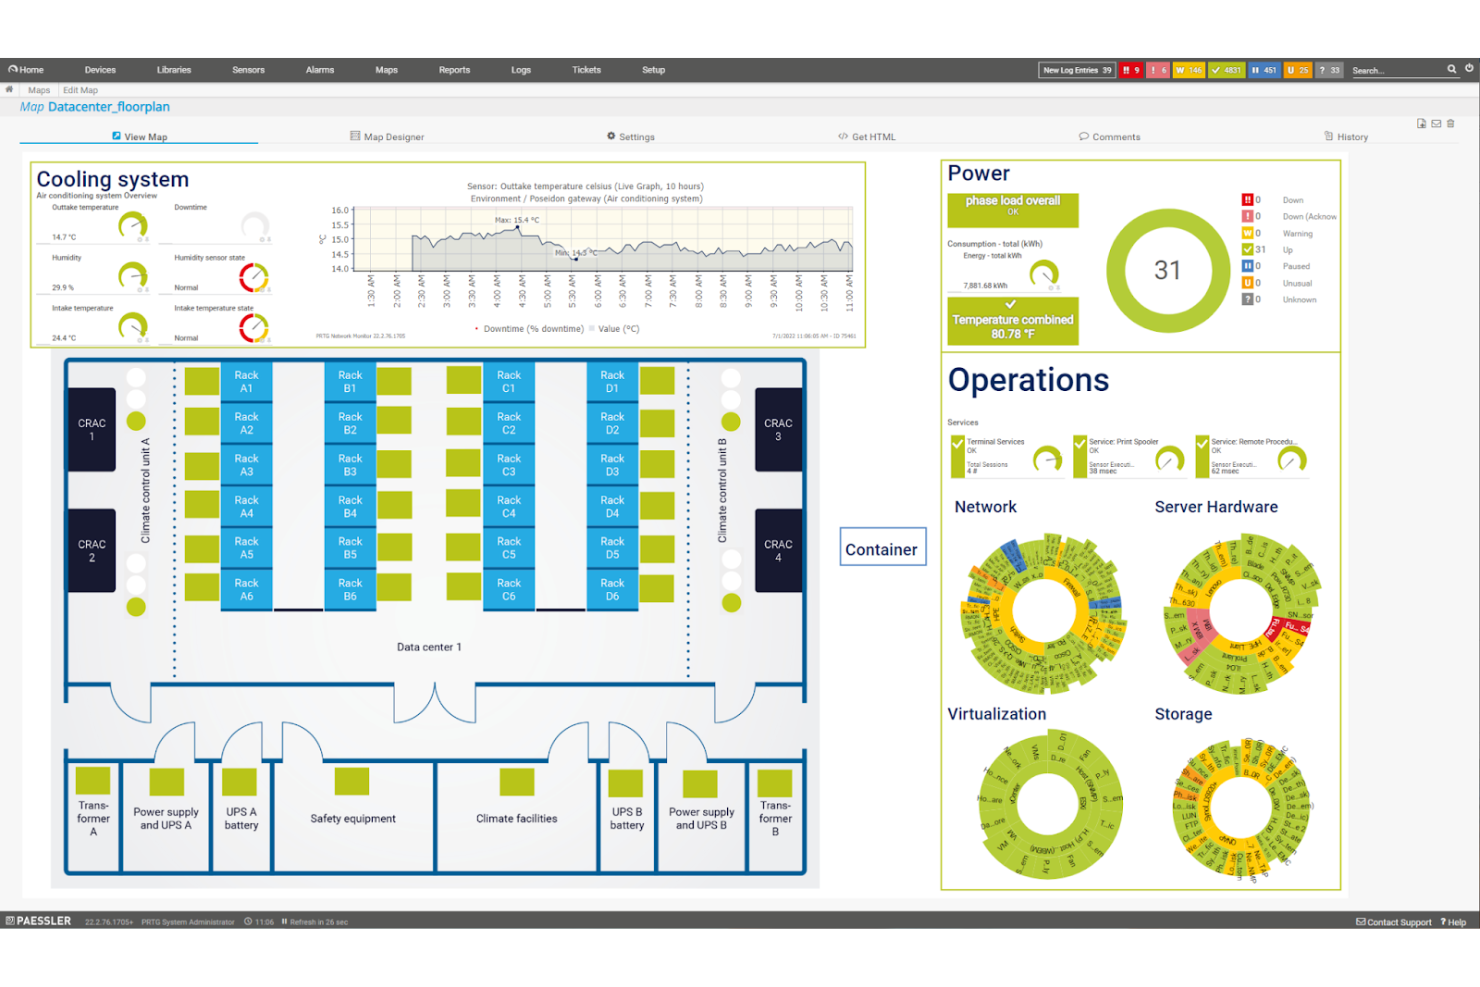
PRTG Network Monitor is a network mapping and monitoring platform that combines automated network discovery, visual topology mapping, and real-time device monitoring for IT environments.
Who Is PRTG Network Monitor Best For?
PRTG Network Monitor is a good fit for IT teams in mid-size to large organizations that need centralized visibility across complex, multi-device network environments.
Why I Picked PRTG Network Monitor
I picked PRTG Network Monitor because its alerting system goes well beyond basic up/down notifications. I like that you can define granular notification triggers based on status changes, speed thresholds, or metric values crossing specific limits—so my team catches degradation before it becomes an outage. PRTG also supports escalation levels. If the first alert goes unacknowledged, it automatically notifies a different team or switches to another channel, such as SMS, Microsoft Teams, or push notifications. You can also schedule alerts to suppress low-priority noise during off-hours, reducing alert fatigue while preserving visibility into critical issues.
PRTG Network Monitor Key Features
- Auto-discovery scanning: PRTG automatically scans IP ranges to detect all devices on your network and adds them to your monitoring environment without manual configuration.
- Network maps and dashboards: Build real-time visual network maps using the drag-and-drop map designer, displaying live device status and traffic data across your infrastructure.
- Distributed monitoring: Monitor multiple remote locations from a single pane of glass using PRTG's probe-based architecture, with TLS-encrypted communication between components.
- 250+ preconfigured sensors: Deploy out-of-the-box sensors for SNMP, WMI, packet sniffing, NetFlow, and more to monitor devices, bandwidth, servers, and applications across your environment.
PRTG Network Monitor Integrations
PRTG Network Monitor offers native integrations with Amazon CloudWatch, Microsoft 365, Azure, VMware, and Cisco devices, and provides an API for custom integrations.
Pros and Cons
Pros:
- Customizable alerting and triggers
- Supports both agentless monitoring
- Intuitive web-based user interface
Cons:
- Can be resource-intensive at scale
- Licensing based on sensor count

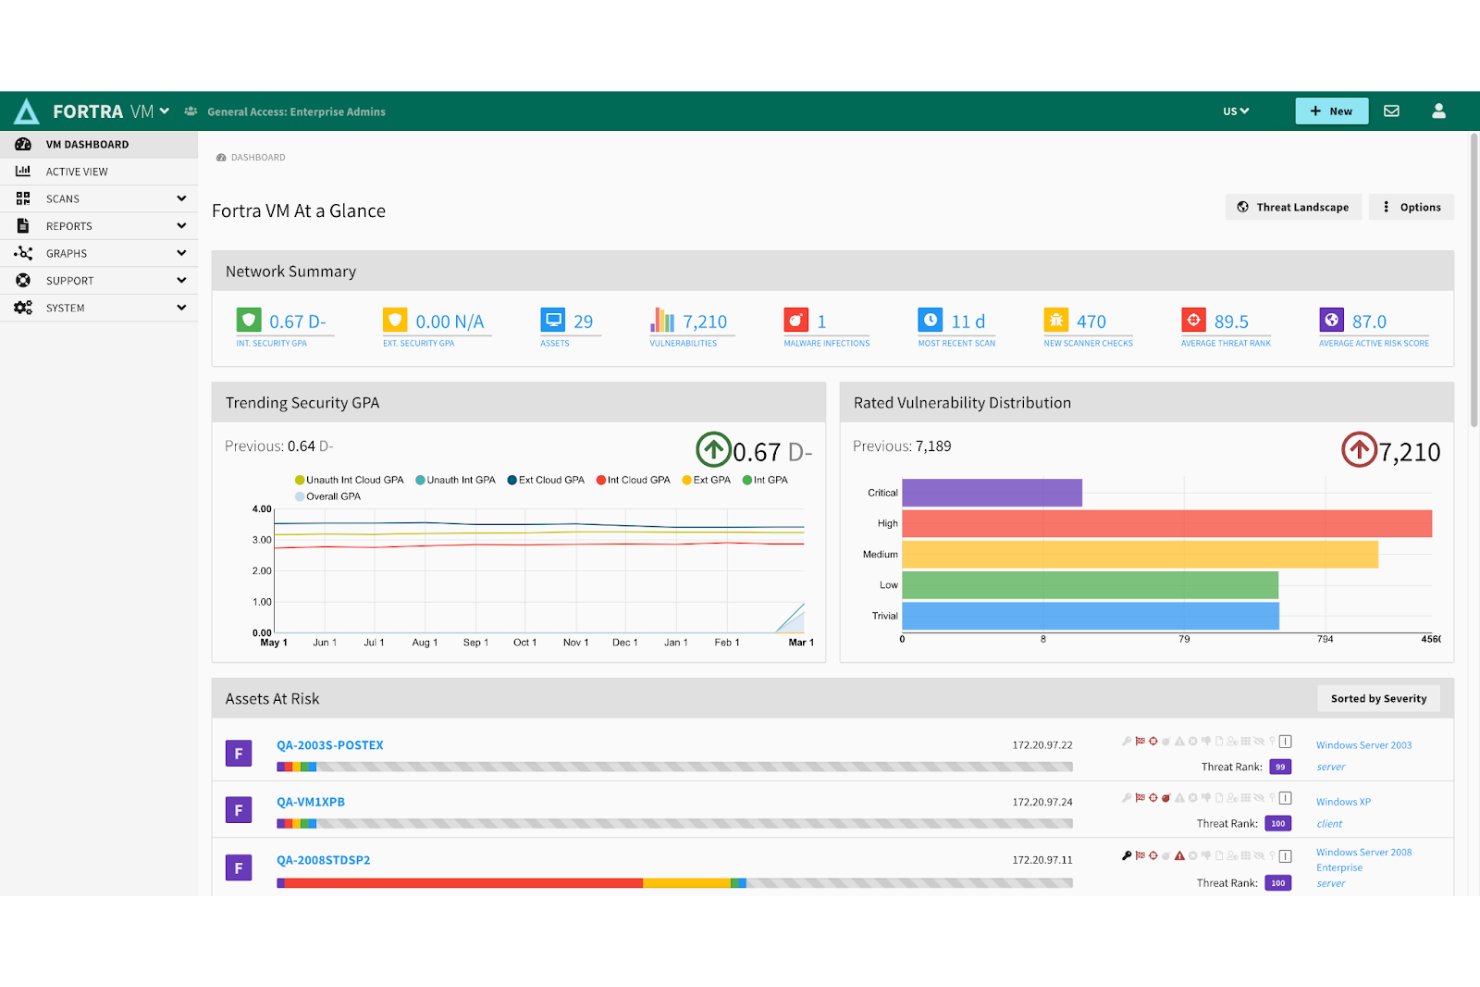
RevealX is a network detection and response platform that provides automated network mapping, real-time device discovery, and deep traffic analysis for IT and security teams.
Who Is RevealX Best For?
RevealX is a strong fit for enterprise security and IT operations teams that need deep visibility into complex, hybrid network environments.
Why I Picked RevealX
RevealX earns its spot on my shortlist because of how it handles threat detection at the network level, where many tools struggle. I particularly like its out-of-band decryption capability, which decodes traffic across 90+ enterprise protocols at up to 100 Gbps without impacting network performance. This lets my team see credential abuse or privilege escalation hidden inside encrypted traffic that other tools miss. The cloud-scale machine learning layer continuously tunes detection models to surface real threats with fewer false positives, easing alert triage across large hybrid environments.
RevealX Key Features
- Asset autodiscovery: RevealX continuously discovers and profiles every device, user, and application communicating on your network, collecting over 5,000 metrics per endpoint.
- Intrusion detection system (IDS): Cloud-updated signatures provide full-spectrum detection coverage to stop known attacks and detect encrypted threats moving laterally across your network.
- Packet forensics: Capture, query, and analyze packets across hybrid and multi-cloud environments from within a single platform, with context retained for future investigation.
- AI-assisted analysis: ML models establish baselines for device behavior and network performance to surface anomalies, unexpected changes, and risks across on-premises and cloud networks.
RevealX Integrations
RevealX offers native integrations with Splunk, ServiceNow, Palo Alto Networks, IBM QRadar, and AWS Security Hub. An API is available for custom integrations.
Pros and Cons
Pros:
- Scalable for enterprise use
- Real-time network traffic analysis
- AI-driven threat detection system
Cons:
- No built-in endpoint protection features
- High resource consumption on servers
Altri strumenti di mappatura della rete
Ecco altre opzioni di strumenti di mappatura della rete che non sono entrate nella mia shortlist ma che vale comunque la pena considerare.
- NetCrunch
For SNMP monitoring
- Network Glue
For MSPs
- Obkio
For network performance
- LANTopoLog
For topology discovery
- Checkmk
For hybrid IT environments
- Site24x7
For cloud-based monitoring
- SolarWinds Network Performance Monitor
For scalable network management
- Zabbix
For open-source flexibility
- Icinga
For data visualization
- Nagios
For customizable monitoring solutions
- Atera
For IT automation
- ManageEngine (OpManager)
For multi-vendor network monitoring


How I Evaluate Network Mapping Tools
I split my evaluation into two layers: the baseline capabilities a tool must have—like automated discovery and topology visualization—and what sets one platform apart for your environment.
Core Functionality (Table Stakes for This List)
These core capabilities serve as the acceptance criteria for inclusion on my list of network mapping tools:
- Automated Network Discovery: I check whether a tool can scan across protocols like SNMP, ICMP, LLDP, and CDP to find every device on the network—without someone manually entering each asset.
- Topology Visualization: Clear, interactive Layer 2 and Layer 3 maps are what I evaluate here, including drill-down capability so you can move from a high-level view to a specific switch port.
- Real-Time Status Monitoring: I look for live device and link status reflected directly on the map, with alerts when a core switch goes down or a WAN link degrades.
- Device & Asset Inventory: Every discovered node should populate an inventory with details like IP/MAC, hostname, vendor, model, and OS—useful when you're auditing assets or planning upgrades.
- Multi-Vendor & Protocol Support: Mixed environments with Cisco, Juniper, Fortinet, and HP gear are the norm, so I evaluate how well a tool handles heterogeneous infrastructure.
- Map Export & Documentation: I look for export options (Visio, PDF, PNG) that produce audit-ready diagrams you can hand to compliance teams or attach to change management tickets.
I rank each vendor on a scale from 0 (does not offer the functionality) to 5 (excels in this area) for each criterion.
Vendors need to achieve a minimum average score to be considered for inclusion on my list. From there, I consider what sets each platform apart.
Differentiating Factors (What Sets Vendors Apart)
Once I've curated my list, here's how I contrast and compare different vendors in the network mapping tools space:
Standout Features
Application dependency mapping stands out when I need to visualize the impact of network changes on specific services, helping teams quickly trace outages or performance issues. I also look for cloud and hybrid visibility, so that no assets or connections in AWS, Azure, or SD-WAN environments are missed. Configuration change tracking is another key factor, as it allows for proactive monitoring and rollback when routers or firewalls are updated. AI-driven anomaly detection is valuable for surfacing unexpected device activity or possible threats without drowning IT in noise.
Beyond Features
Licensing models vary widely in this space—per-node, per-device, or flat-rate—so I evaluate how pricing scales as your network grows to avoid surprises after deployment. Integrations matter just as much; I check whether a tool connects to your ITSM platform (like ServiceNow or Jira) and your SIEM stack so discovered assets and alerts flow into existing workflows. Compliance is another factor I weigh, especially RBAC, audit logging, and SNMPv3 support, since network maps expose sensitive topology data that regulated environments need to protect.
Come scegliere gli strumenti di mappatura della rete
È facile perdersi in lunghe liste di funzionalità e strutture di prezzo complesse. Ecco una checklist di fattori da ricordare per restare concentrato durante il tuo processo di selezione del software.
| Fattore | Cosa Considerare |
| Scalabilità | Assicurati che il mappatore di topologie di rete possa crescere insieme alla tua rete. Cerca soluzioni in grado di gestire un aumento del traffico dati e dei dispositivi senza compromettere le prestazioni o creare colli di bottiglia. |
| Integrazioni | Verifica se si integra con i sistemi esistenti, come servizi cloud, piattaforme di sicurezza o altri strumenti di gestione IT, per aumentarne la funzionalità. |
| Personalizzazione | Considera strumenti che permettano di personalizzare dashboard e report in base alle tue esigenze specifiche, facilitando l’interpretazione dei dati da parte del tuo team. |
| Facilità d’Uso | Cerca interfacce intuitive e una navigazione semplice. Il tuo team dovrebbe adattarsi rapidamente all’utilizzo dello strumento senza necessità di formazione approfondita. |
| Budget | Allinea il costo dello strumento al tuo budget. Valuta le funzionalità offerte in ciascun livello di prezzo per assicurarti di ottenere un buon rapporto qualità-prezzo. |
| Salvaguardie di Sicurezza | Verifica che lo strumento includa funzionalità per proteggere i dati di rete sensibili, come crittografia e controlli di accesso. |
| Servizi di Supporto | Considera la disponibilità e la qualità del supporto clienti, compresi i tempi di risposta e i canali di assistenza. |
| Monitoraggio delle Prestazioni | Assicurati che lo strumento offra un monitoraggio in tempo reale per identificare e risolvere rapidamente i problemi di rete. |
Tendenze negli Strumenti di Mappatura di Rete
Nelle mie ricerche, ho raccolto innumerevoli aggiornamenti di prodotto, comunicati stampa e log di rilascio da diversi fornitori di strumenti di mappatura della rete. Ecco alcune delle tendenze emergenti che sto monitorando.
- Analisi guidata dall’IA: L’IA analizza i dati di rete in modo più efficiente, offrendo approfondimenti utili per prevedere e prevenire problemi di rete. I fornitori come ExtraHop stanno integrando l’IA per potenziare le capacità di rilevamento delle minacce.
- Gestione dei dispositivi IoT: Con la proliferazione dei dispositivi IoT, gli strumenti di mappatura di rete si stanno evolvendo per gestire e monitorare efficacemente questi dispositivi. Questa tendenza è cruciale per le aziende che fanno grande affidamento sulla tecnologia IoT.
- Soluzioni cloud-native: Sempre più strumenti sono progettati specificamente per ambienti cloud, offrendo migliori integrazioni e prestazioni per reti basate sul cloud. Questo è particolarmente utile per le aziende che migrano verso infrastrutture cloud.
- Miglioramenti dell’esperienza utente: I fornitori si concentrano sul miglioramento dell’interfaccia utente per rendere i dati di rete complessi più accessibili. Ciò include dashboard intuitivi e migliori strumenti di visualizzazione, che aiutano gli utenti a prendere decisioni rapide e informate.
- Integrazione della sicurezza: Gli strumenti di mappatura della rete stanno integrando sempre più funzionalità di sicurezza per offrire un approccio più completo alla gestione della rete. Questa tendenza risponde alla crescente necessità di protezione a causa dell’aumento delle minacce informatiche.
Cosa Sono gli Strumenti di Mappatura di Rete?
Gli strumenti di mappatura della rete aiutano i team a visualizzare e gestire la disposizione e le prestazioni di una rete. Professionisti IT e amministratori di rete li utilizzano per garantire la salute e l’efficienza della rete.
Monitoraggio in tempo reale, mappatura automatica e rilevamento delle minacce aiutano a individuare i problemi, gestire i dispositivi e mantenere la sicurezza. Questi strumenti forniscono informazioni essenziali per una gestione efficiente della rete e la risoluzione dei problemi.
Caratteristiche degli Strumenti di Mappatura di Rete
Quando scegli strumenti di mappatura di rete, cerca le seguenti caratteristiche chiave.
- Mappatura automatica: Un tipo di software di automazione della rete che scopre e mappa automaticamente la tua rete, risparmiando tempo e garantendo una panoramica aggiornata della rete.
- Monitoraggio in tempo reale: Fornisce aggiornamenti continui sulle prestazioni di rete, aiutandoti a identificare e risolvere rapidamente i problemi.
- Notifiche di allarme: Invia avvisi per anomalie di rete, consentendo risposte tempestive ai potenziali problemi.
- Dashboard personalizzabili: Ti permette di personalizzare l’interfaccia per mostrare le informazioni più rilevanti alle tue esigenze, migliorando l'usabilità.
- Gestione dispositivi IoT: Monitora e gestisce i dispositivi IoT all'interno della tua rete, supportando il crescente trend dell'integrazione IoT.
- Analisi guidata dall’AI: Utilizza l’intelligenza artificiale per analizzare i dati di rete, offrendo insight per prevenire e prevedere i problemi.
- Integrazione della sicurezza: Integra funzionalità di sicurezza per proteggere i dati di rete e gestire in modo sicuro la rete complessiva.
- Soluzioni cloud-native: Progettate per funzionare senza problemi in ambienti cloud, offrendo una miglior integrazione per le reti basate su cloud.
- Visualizzazione della topologia: Fornisce una rappresentazione visiva chiara e interattiva delle connessioni e delle relazioni tra i dispositivi di rete, semplificando troubleshooting e gestione.
- Compatibilità multi-vendor: Supporta una vasta gamma di produttori hardware e software di rete, assicurando flessibilità in diversi ambienti.
- Supporto SNMP: Utilizza il Simple Network Management Protocol (SNMP) per raccogliere dati in tempo reale dai dispositivi di rete, migliorando la precisione del monitoraggio.
- Analisi storica della rete: Archivia dati storici della rete, consentendo analisi delle tendenze di performance e diagnosi dei problemi nel tempo.
- Mappatura Livello 2 e Livello 3: Offre visibilità sia sulle connessioni fisiche (Livello 2) che logiche (Livello 3), permettendo un’analisi approfondita della rete.
- Monitoraggio della larghezza di banda: Tieni traccia del traffico di scansione della rete e dell’utilizzo della banda per ottimizzare le prestazioni ed evitare congestioni.
- Scoperta e classificazione dei dispositivi: Identifica tutti i dispositivi connessi e li classifica in base a tipo, ruolo e funzione nei nodi della rete.
- Reportistica automatizzata: Genera report dettagliati sulle prestazioni della rete, eventi di sicurezza e stato dei dispositivi, facilitando la conformità e il controllo operativo.
- Integrazione API: Fornisce API per la connettività fluida con altri strumenti di gestione IT, abilitando workflow automatizzati e funzionalità estese.
- Accesso remoto alla rete: Permette agli amministratori di monitorare e gestire la topologia della rete da qualsiasi luogo, migliorando l’efficienza operativa.
- Visualizzazione della segmentazione della rete: Aiuta a visualizzare ed applicare le policy di segmentazione, migliorando la sicurezza e offrendo alte prestazioni di rete.
- Controllo accessi basato sui ruoli (RBAC): Limita l’accesso alla rete in base ai ruoli utente, assicurando che solo il personale autorizzato possa modificare le configurazioni.
- Mappatura di reti virtuali: Estende le capacità di mappatura agli ambienti virtualizzati, fornendo approfondimenti sulle strutture cloud e macchine virtuali nell’intera rete.
- Monitoraggio della conformità: Garantisce il rispetto delle normative di settore e delle policy interne di sicurezza monitorando cambi di configurazione e vulnerabilità potenziali.
- Integrazione con piattaforme ITSM: Si connette con i sistemi di gestione dei servizi IT (ITSM) per ticketing, troubleshooting e gestione degli incidenti avanzata.
Vantaggi degli strumenti di mappatura della rete
L’implementazione di strumenti di mappatura della rete offre numerosi vantaggi per il tuo team e la tua azienda. Ecco alcuni dei benefici che potrai ottenere.
- Migliore visibilità della rete: Mappatura automatica e monitoraggio in tempo reale offrono una visione chiara della rete, rendendo la gestione più semplice.
- Risoluzione più rapida dei problemi: Notifiche di allarme e dati in tempo reale aiutano il tuo team a individuare e risolvere rapidamente i problemi di rete.
- Sicurezza potenziata: Le funzionalità di integrazione della sicurezza proteggono la rete da minacce e vulnerabilità.
- Migliore allocazione delle risorse: L’analisi guidata dall’AI offre insight sulle prestazioni di rete, aiutandoti a ottimizzare l’impiego delle risorse.
- Gestione semplificata dei dispositivi: La gestione dei dispositivi IoT facilita l'organizzazione e il controllo dei dispositivi connessi nella rete.
- Adattabilità alla crescita: Le funzionalità di scalabilità assicurano che la rete possa espandersi senza compromettere le prestazioni.
- Esperienza utente personalizzata: Dashboard personalizzabili ti permettono di adeguare lo strumento alle tue esigenze, migliorando l'usabilità complessiva.
Costi e prezzi degli strumenti di mappatura della rete
La scelta degli strumenti per la mappatura della rete richiede la comprensione dei vari modelli di prezzo e dei piani disponibili. I costi variano in base alle funzionalità, alla dimensione del team, agli add-on e altro ancora. La tabella seguente riassume i piani standard, i prezzi medi e le funzionalità tipiche delle soluzioni per la mappatura della rete.
Tabella comparativa dei piani per strumenti di mappatura della rete
| Tipo di piano | Prezzo medio | Funzionalità comuni |
| Piano gratuito | $0 | Rilevamento di rete di base, supporto dispositivi limitati e supporto della community. |
| Piano personale | $5-$25/ utente/mese | Rilevamento di rete, avvisi base, monitoraggio in tempo reale e reportistica di base. |
| Piano business | $30-$75/ utente/mese | Mappatura automatizzata, dashboard personalizzabili, gestione dispositivi IoT e funzioni di sicurezza avanzate. |
| Piano enterprise | $80-$150/ utente/mese | Accesso completo a tutte le funzionalità, analisi supportate da AI, integrazione di sicurezza avanzata e supporto prioritario. |
FAQ sugli strumenti di mappatura della rete
Ecco alcune risposte alle domande più frequenti sugli strumenti per la mappatura della rete.
Quale protocollo utilizzano gli strumenti di mappatura della rete?
Le soluzioni per la mappatura della rete utilizzano generalmente il Simple Network Management Protocol (SNMP) per individuare e mappare automaticamente gli oggetti della rete. SNMP consente di gestire i dispositivi su reti IP esponendo dati tecnici come variabili sui sistemi gestiti. Questo protocollo è fondamentale per raccogliere informazioni e mantenere la salute della rete.
Qual è lo scopo degli strumenti di mappatura della rete?
Lo scopo principale degli strumenti di mappatura della rete è fornire agli amministratori di rete informazioni sullo stato dei dispositivi, le connessioni fisiche e le metriche di traffico. Queste informazioni aiutano a risolvere rapidamente i problemi e a massimizzare l’operatività, garantendo che la rete funzioni in modo fluido ed efficiente.
In che modo gli strumenti di mappatura della rete aiutano la sicurezza?
Gli strumenti di mappatura della rete migliorano la sicurezza individuando dispositivi non autorizzati e schemi di traffico insoliti. Offrono visibilità sulla rete, consentendo di rilevare precocemente potenziali minacce. Questo approccio proattivo è essenziale per mantenere una sicurezza di rete robusta.
Gli strumenti di mappatura della rete cloud-based sono migliori?
Gli strumenti di mappatura della rete basati sul cloud offrono vantaggi come la facile scalabilità e l’accesso remoto. Si integrano bene con altri servizi cloud, offrendo un’esperienza senza soluzione di continuità alle aziende che adottano soluzioni cloud. Tuttavia, la scelta migliore dipende dalle esigenze specifiche e dall’infrastruttura della rete.
Cosa succede ora?
Accelera la crescita della tua attività SaaS e le tue competenze di leadership. Iscriviti alla nostra newsletter per ricevere gli ultimi approfondimenti da CTO e aspiranti leader tecnologici.
Ti aiuteremo a scalare in modo più intelligente e a guidare con sicurezza grazie a guide, risorse e strategie dei migliori esperti!