Best Application Performance Management Software Shortlist
Here’s my shortlist of the best application performance management software:
The best application performance management software helps teams detect slowdowns early, analyze system behavior, and keep applications running smoothly under varying workloads. These tools make it easier to trace performance issues, reduce downtime, and maintain a consistent user experience across distributed environments.
When misconfigurations cause outages, when manual troubleshooting slows incident response, or when performance issues go unnoticed until they reach production, reliability and efficiency can drop quickly. These challenges delay releases, increase maintenance effort, and make it harder for development and operations teams to understand where problems originate.
With over 20 years in the industry as a Chief Technology Officer, I’ve tested and reviewed dozens of application performance management software solutions across real-world environments to evaluate their accuracy, integrations, and usability. This guide highlights the top application performance management software that improve visibility, support faster diagnostics, and help teams maintain dependable application performance. Each review covers features, pros and cons, and best-fit use cases to help you choose the right tool.
Why Trust Our Software Reviews
We’ve been testing and reviewing software since 2023. As tech leaders ourselves, we know how critical and difficult it is to make the right decision when selecting software.
We invest in deep research to help our audience make better software purchasing decisions. We’ve tested more than 2,000 tools for different tech use cases and written over 1,000 comprehensive software reviews. Learn how we stay transparent & our software review methodology.
Best Application Performance Management Software Summary
This comparison chart summarizes pricing details for my top application performance management software selections to help you find the best one for your budget and business needs.
| Tool | Best For | Trial Info | Price | ||
|---|---|---|---|---|---|
| 1 | Best for SMB IT management | 30-day free trial + free demo + free plan availabl | From $199/year | Website | |
| 2 | Best for load testing large-scale apps | Free trial available + free demo | Pricing upon request | Website | |
| 3 | Best for beginner-friendly automation | Free demo available | Pricing upon request | Website | |
| 4 | Best for real-time user monitoring | 30-day free trial + free demo available | From $10/month (billed annually) | Website | |
| 5 | Best for distributed tracing and session replay | Free plan + free trial + free demo available | From $26/month (billed annually) | Website | |
| 6 | Best for serverless architecture monitoring | Free trial + demo available | Pricing upon request | Website | |
| 7 | Best for developer-centric insights | Free trial + free demo available | Pricing upon request | Website | |
| 8 | Best for comprehensive data analytics | 14-day free trial + free demo available | Pricing upon request | Website | |
| 9 | Best for enterprise-level analytics | Free trial available | Pricing upon request | Website | |
| 10 | Best for code-level diagnostics | Free trial + demo available | From $80/month (billed annually) | Website |
-

QA Wolf
Visit WebsiteThis is an aggregated rating for this tool including ratings from Crozdesk users and ratings from other sites.4.9 -

NordLayer
Visit WebsiteThis is an aggregated rating for this tool including ratings from Crozdesk users and ratings from other sites.4.3 -

Intruder
Visit WebsiteThis is an aggregated rating for this tool including ratings from Crozdesk users and ratings from other sites.4.8
Best Application Performance Management Software Review
Below are my detailed summaries of the best application performance management software that made it onto my shortlist. My reviews offer a detailed look at the key features, pros & cons, integrations, and ideal use cases of each tool to help you find the best one for you.
ManageEngine Applications Manager is an application performance management tool designed for small to medium-sized businesses. It offers monitoring solutions to ensure that IT operations run smoothly and efficiently.
Why I picked ManageEngine Applications Manager: It's ideal for SMBs due to its focus on IT management. The tool provides end-to-end visibility into application performance, helping you quickly identify and resolve issues. It offers customizable dashboards, which allow you to tailor views according to your team's needs. Its ability to handle diverse environments makes it versatile for various IT setups.
Standout features & integrations:
Features include real-time monitoring, which keeps you updated on application performance. The tool's alerting system is customizable, ensuring you get the information you need promptly. It also offers capacity planning, helping you optimize resource use.
Integrations include ServiceNow, Jira, Slack, Microsoft Teams, PagerDuty, Opsgenie, Zendesk, Zoho CRM, Docker, and Nagios.
Pros and Cons
Pros:
- Suitable for diverse environments
- Customizable dashboards
- Real-time performance updates
Cons:
- Initial setup complexity
- Limited advanced analytics
New Product Updates from ManageEngine Applications Manager
ManageEngine Applications Manager Adds Veeam Monitoring
ManageEngine Applications Manager adds Veeam Enterprise Manager monitoring. This update enables tracking of backup infrastructure, job performance, and storage usage. For more information, visit ManageEngine’s official site.
Tricentis NeoLoad is a performance testing tool designed for enterprise applications. It primarily serves businesses looking to conduct load testing and performance monitoring to ensure their applications run efficiently.
Why I picked Tricentis NeoLoad: It's tailored for large-scale applications, focusing on load testing, which is its standout feature. NeoLoad provides browser-based testing through RealBrowser technology, giving accurate end-user performance metrics. It integrates with CI/CD pipelines, allowing for continuous performance evaluations. The tool's no-code and low-code options make it accessible for users with varying technical skills.
Standout features & integrations:
Features include browser-based testing capabilities that simulate real user interactions, integration with CI/CD pipelines for continuous testing, and support for both modern and legacy systems. You can also benefit from its automated test updates, which reduce the time spent on script maintenance.
Integrations include Jenkins, Git, Azure DevOps, Bamboo, Docker, SAP, JMeter, Gatling, New Relic, and Datadog.
Pros and Cons
Pros:
- Realistic user load simulation
- No-code test design options
- Suitable for large-scale applications
Cons:
- Requires initial setup time
- High learning curve for beginners
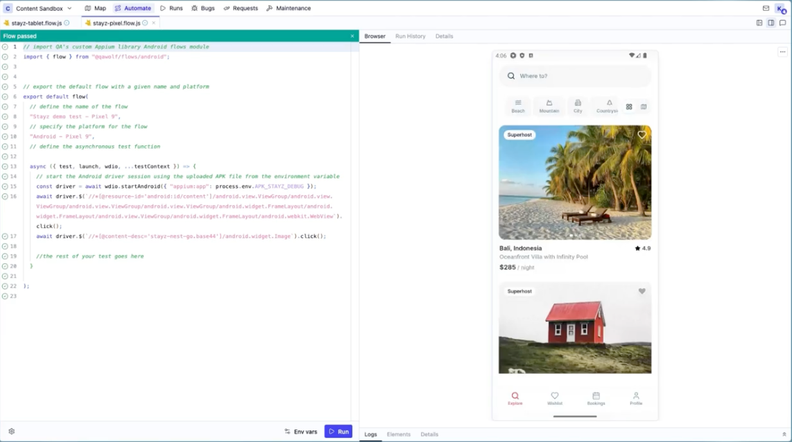
QA Wolf is a cloud-based testing tool designed for teams needing efficient test automation. It caters to businesses seeking to automate their QA processes without requiring extensive technical expertise.
Why I picked QA Wolf: It's perfect for beginners due to its user-friendly automation capabilities. QA Wolf provides an easy-to-use interface, allowing you to create tests quickly without complex coding. The tool's test creation and execution are straightforward, which is ideal if your team lacks deep technical skills. Additionally, its cloud-based nature means you can access and run tests from anywhere.
Standout features & integrations:
Features include the ability to create tests directly in the browser, which simplifies the process for those new to automation. It offers detailed test results, helping you understand where issues arise. The tool also provides built-in video recordings of test executions, making it easier to pinpoint problems.
Integrations include Slack, GitHub, GitLab, Bitbucket, CircleCI, Jenkins, Vercel, Netlify, Heroku, and AWS.
Pros and Cons
Pros:
- Easy test creation process
- No coding required
- Cloud-based access
Cons:
- Limited advanced features
- Not ideal for complex tests
New Product Updates from QA Wolf
QA Wolf Adds Android Emulator Infrastructure for Device Testing
QA Wolf introduces Android emulator infrastructure with expanded device and OS testing support. These updates enable teams to test across real-world device conditions and improve test coverage. For more information, visit QA Wolf’s official site.
Site24x7 is a cloud-based application performance management tool tailored for IT operations teams. It helps businesses monitor real-time user experiences and ensure optimal application performance.
Why I picked Site24x7: It excels in providing real-time user monitoring, making it ideal for teams needing instant insights. The tool offers synthetic monitoring, which simulates user interactions to identify potential issues before they affect real users. Its real user monitoring tracks actual user experiences and provides detailed performance metrics. With its alerting system, you can quickly address performance bottlenecks.
Standout features & integrations:
Features include synthetic monitoring that simulates user paths to detect issues early. The tool's real user monitoring tracks individual user sessions to provide insights into user experiences. An advanced alerting system keeps your team informed about performance anomalies.
Integrations include Slack, Microsoft Teams, Zapier, ServiceNow, Jira, PagerDuty, Zoho CRM, Zoho Desk, Zendesk, and Freshdesk.
Pros and Cons
Pros:
- Real-time user insights
- Synthetic transaction monitoring
- Customizable alert thresholds
Cons:
- Can be resource-intensive
- Limited customization options
New Product Updates from Site24x7
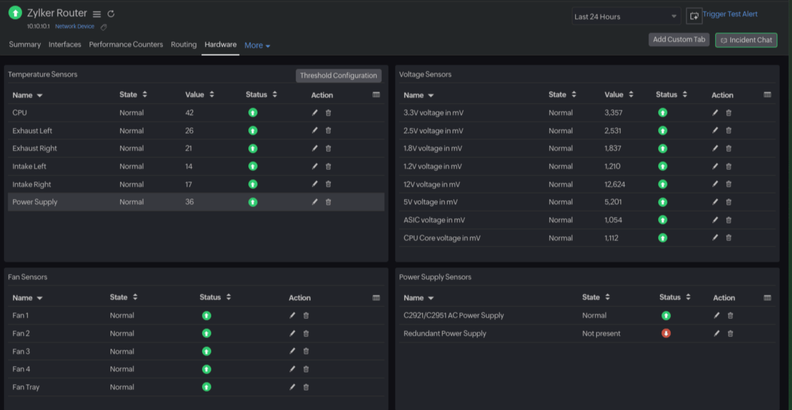
Site24x7 Enhances Network Monitoring With Device and Visibility Updates
Site24x7 introduces proactive hardware health monitoring, expanded device support, centralized network controls, and enhanced SD-WAN visualization to improve network monitoring and management. For more information, visit Site24x7’s official site.
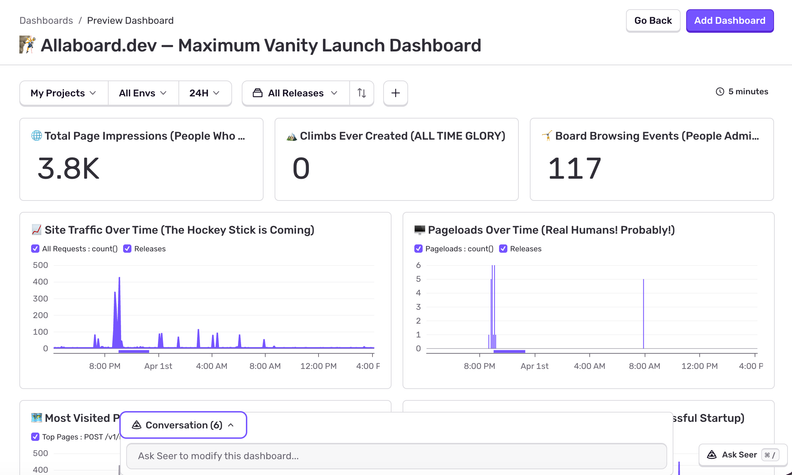
For developers and IT professionals seeking to enhance their application performance management, Sentry offers a compelling solution. Catering to teams across industries like ecommerce, mobile development, and web services, Sentry provides robust tools to track and resolve performance issues. With features like error monitoring and session replay, it empowers you to swiftly identify and address bottlenecks, ensuring a seamless user experience.
Why I Picked Sentry
I picked Sentry for its standout capability in distributed tracing and session replay, which are vital for application performance management. Distributed tracing lets you follow a request as it travels through your system, helping you identify where latency or errors occur. Session replay provides a visual representation of user interactions, giving you a clear view of how errors impact user experience. These features are essential for teams looking to optimize application performance and enhance user satisfaction.
Sentry Key Features
In addition to its tracing and replay capabilities, Sentry offers:
- Error Monitoring: Continuously tracks and logs errors in real time, enabling your team to address issues promptly.
- Profiling: Provides insights into function execution times, helping you identify performance bottlenecks within your applications.
- Uptime Monitoring: Alerts you to downtime incidents, keeping you always aware of your application's availability.
- AI Code Review: Helps identify potential code issues before they affect production, streamlining the debugging process.
Sentry Integrations
Integrations include GitHub, Bitbucket, GitLab, Azure DevOps, Heroku, Vercel, Jira, Trello, Asana, and Slack.
Pros and Cons
Pros:
- Comprehensive monitoring, including performance and crash reporting
- Strong error tracking with clear stack traces
- Session replay helps teams understand issues from the user’s perspective
Cons:
- Less coverage for infrastructure-level monitoring
- Complex implementation especially for diverse platform stacks
New Product Updates from Sentry
Sentry Adds AI Dashboard Generation in Beta
Sentry introduces AI Dashboard Generation in beta, enabling users to create dashboards using prompts through an agent. This makes dashboard setup faster and easier without manual configuration. For more information, visit Sentry’s official site.
Lumigo is a monitoring and troubleshooting platform tailored for serverless applications. It's designed for development teams looking to gain insights into serverless architectures and quickly resolve issues.
Why I picked Lumigo: It's perfect for teams working with serverless environments due to its specialized focus. Lumigo offers distributed tracing, which helps you track requests across services and pinpoint where issues arise. The tool provides real-time alerts, allowing you to address problems as they occur. Additionally, its intuitive dashboards present comprehensive data in an easily digestible format.
Standout features & integrations:
Features include the ability to visualize the entire serverless architecture, which aids in understanding application flow. It provides automatic log collection, ensuring you have all the necessary data for troubleshooting. The tool also tracks cold start times, helping you optimize performance.
Integrations include AWS Lambda, AWS CloudWatch, AWS SNS, AWS SQS, AWS DynamoDB, AWS API Gateway, AWS Step Functions, Slack, Datadog, and PagerDuty.
Pros and Cons
Pros:
- Focus on serverless environments
- Detailed distributed tracing
- Intuitive user interface
Cons:
- Limited to serverless applications
- Requires an AWS environment
New Relic is an application performance management platform aimed at developers and IT teams. It provides comprehensive monitoring and analytics to help you ensure applications run smoothly and efficiently.
Why I picked New Relic: It's tailored for developers who need in-depth insights into application performance. New Relic offers detailed transaction traces, which help you identify bottlenecks in your application's performance. The tool provides real-time data visualization, allowing you to make informed decisions quickly. With custom dashboards, you can tailor the data to fit your team's specific needs.
Standout features & integrations:
Features include real-time error tracking, which helps you catch issues as they happen. The tool's anomaly detection alerts you to unusual behavior in your applications. Additionally, it offers infrastructure monitoring, giving you a complete view of your tech stack.
Integrations include AWS, Azure, Google Cloud Platform, Kubernetes, PagerDuty, Slack, Jira, ServiceNow, Splunk, and Datadog.
Pros and Cons
Pros:
- Developer-focused analytics
- Customizable data dashboards
- Detailed transaction tracing
Cons:
- Requires technical expertise
- Can be data-intensive
Splunk is a data analytics platform primarily used by IT and security teams. It helps organizations turn machine data into valuable insights, facilitating informed decision-making.
Why I picked Splunk: It's renowned for its comprehensive data analytics capabilities, making it a go-to for teams needing deep insights. Splunk offers real-time data processing, allowing you to analyze data as it comes in. Its powerful search and visualization tools help you uncover patterns and anomalies. The platform's scalability ensures it can handle large volumes of data, which is crucial for growing businesses.
Standout features & integrations:
Features include advanced search capabilities that allow you to query large datasets efficiently. Splunk provides customizable dashboards that make it easy to visualize data in meaningful ways. It also supports alerting, so you're notified of critical events in real time.
Integrations include AWS, Microsoft Azure, Google Cloud Platform, ServiceNow, Slack, Jira, GitHub, Docker, Kubernetes, and Salesforce.
Pros and Cons
Pros:
- Handles large data volumes
- Advanced search functions
- Scalable for growing needs
Cons:
- Steep learning curve
- Limited offline capabilities
IBM Cloud APM is an application performance management solution designed for large enterprises. It provides deep insights into application performance, helping organizations maintain optimal operations.
Why I picked IBM Cloud APM: It's tailored for enterprise-level analytics, giving detailed performance metrics across your entire infrastructure. The tool offers real-time monitoring, which is essential for identifying and resolving issues quickly. It includes predictive analytics, helping you anticipate potential problems before they occur. With its customizable dashboards, you can focus on the metrics that matter most to your team.
Standout features & integrations:
Features include predictive analytics that help you foresee and address potential issues. The tool's real-time monitoring keeps you updated on your application's health. It also offers detailed transaction tracking, providing insights into performance bottlenecks.
Integrations include IBM Cloud, AWS, Azure, Google Cloud Platform, Kubernetes, Docker, ServiceNow, Slack, PagerDuty, and Splunk.
Pros and Cons
Pros:
- Enterprise-level analytics
- Predictive analytics capabilities
- Real-time transaction tracking
Cons:
- Complex setup process
- High resource consumption
Stackify Retrace is a performance management and monitoring tool designed for developers. It helps teams find and fix application performance issues by providing detailed code-level diagnostics.
Why I picked Stackify Retrace: It's ideal for developers who need deep insights into code performance. Retrace provides detailed error tracking, which allows you to identify and resolve issues at the code level. It offers application logging, giving you the context needed to understand application behavior. The tool's performance dashboards provide real-time insights, helping you keep track of application health.
Standout features & integrations:
Features include application performance monitoring, which gives you a comprehensive view of your application's health. It offers detailed error tracking to help you pinpoint issues quickly. Additionally, the tool provides customizable alerts, ensuring you're notified of performance anomalies.
Integrations include Azure, AWS, Google Cloud Platform, GitHub, Bitbucket, Jira, Slack, PagerDuty, Microsoft Teams, and Visual Studio.
Pros and Cons
Pros:
- Detailed code-level insights
- Real-time performance dashboards
- Comprehensive error tracking
Cons:
- Requires technical knowledge
- May need frequent updates
Other Application Performance Management Software
Here are some additional application performance management software options that didn’t make it onto my shortlist, but are still worth checking out:
- Apache JMeter
For open-source performance testing
- AppDynamics
For business transaction monitoring
- OverOps
For code change management
- SolarWinds AppOptics
For hybrid cloud environments
- Google Cloud Monitoring
For Google Cloud users
- Instana
For Service level management
- Elastic APM
For end-to-end distributed tracing
- Gatling
For load testing with Scala
- Apache Benchmark (ab)
For HTTP server benchmarking
- Datadog APM
For full-stack observability
- BMC TrueSight
For predictive IT analytics
- Riverbed SteelCentral AppResponse
For network performance analysis
- Microsoft Azure Application Insights
For Azure platform integration
- CA Technologies APM
For digital experience (DX) analytics
- Apache SkyWalking
APM for microservices
- Scout APM
Customer support
Application Performance Management Software Selection Criteria
When selecting the best application performance management software to include in this list, I considered common buyer needs and pain points like scalability and real-time monitoring. I also used the following framework to keep my evaluation structured and fair:
Core Functionality (25% of total score)
- Monitor application performance
- Provide real-time analytics
- Detect and diagnose issues
- Offer detailed reporting
- Support multiple environments
Additional Standout Features (25% of total score)
- Predictive analytics capabilities
- Automated root cause analysis
- Customizable dashboards
- Integration with CI/CD pipelines
- Real-time user monitoring
Usability (10% of total score)
- Intuitive user interface
- Easy navigation between features
- Clear and concise documentation
- Minimal learning curve
- Responsive design for different devices
Onboarding (10% of total score)
- Availability of training videos
- Interactive product tours
- Access to templates and guides
- Live webinars and Q&A sessions
- Supportive chatbots for guidance
Customer Support (10% of total score)
- 24/7 customer support availability
- Multiple support channels (email, chat, phone)
- Access to a comprehensive knowledge base
- Fast response times to queries
- Proactive issue resolution
Value For Money (10% of total score)
- Competitive pricing compared to peers
- Transparent pricing structure
- Flexible pricing plans
- Inclusion of essential features in base plan
- Discounts for long-term commitments
Customer Reviews (10% of total score)
- Overall customer satisfaction ratings
- Feedback on feature effectiveness
- Comments on reliability and uptime
- User experiences with customer support
- Insights on ease of use and implementation
How to Choose Application Performance Management Software
It’s easy to get bogged down in long feature lists and complex pricing structures. To help you stay focused as you work through your unique software selection process, here’s a checklist of factors to keep in mind:
| Factor | What to Consider |
| Scalability | Ensure the software can grow with your business. Look for solutions that handle increased traffic and data without compromising performance. |
| Integrations | Check for compatibility with your existing tools like CI/CD pipelines, cloud services, and monitoring systems to ensure a smooth workflow. |
| Customizability | Consider the ability to tailor dashboards, reports, and alerts to meet your team's specific needs and preferences. |
| Ease of Use | Evaluate how intuitive the interface is. Your team should be able to navigate the software without extensive training or technical expertise. |
| Budget | Align the software's cost with your financial constraints. Ensure you're getting essential features at a reasonable price without hidden fees. |
| Security Safeguards | Look for robust security features like data encryption, access controls, and compliance with regulations to protect sensitive information. |
| Support | Assess the availability of customer support and resources like tutorials, documentation, and community forums to assist your team when needed. |
| Real-Time Analytics | Ensure the software provides live data and insights, helping your team to make informed decisions quickly and address issues as they arise. |
What Is Application Performance Management Software?
Application performance management software is used to monitor how an application behaves, measure performance, and find issues that affect speed or reliability. It’s used by developers, operations teams, and IT staff who need clear insight into slowdowns, errors, and unusual behavior so they can fix problems quickly.
Monitoring tools, tracing tools, and alerting capabilities help with spotting bottlenecks, understanding where issues start, and keeping apps stable under different workloads. Overall, this software helps teams maintain applications that run smoothly and meet user expectations.
Features of Application Performance Management Software
When selecting application performance management software, keep an eye out for the following key features:
- Monitoring: Continuously tracks application performance to ensure optimal operation and quickly identifies issues.
- Real-time analytics: Provides live data insights that help teams make informed decisions and address problems as they occur.
- Custom dashboards: Allow users to tailor data visualization to meet specific needs and preferences, enhancing usability.
- Alerting: Sends notifications about performance anomalies, enabling swift response to potential issues.
- Scalability: Supports growing data and traffic demands without compromising application performance.
- Integration capabilities: Ensures compatibility with existing tools and systems, facilitating a seamless workflow.
- Error tracking: Identifies and logs errors in code, helping developers resolve issues efficiently.
- Predictive analytics: Anticipates potential problems before they occur, improving proactive management.
- Security safeguards: Protects sensitive information with features like data encryption and access controls.
- User interface: Offers an intuitive and easy-to-navigate design, reducing the learning curve for users.
Benefits of Application Performance Management Software
Implementing application performance management software provides several benefits for your team and your business. Here are a few you can look forward to:
- Improved performance: By monitoring and analyzing data in real time, these tools help ensure applications run smoothly and efficiently.
- Faster issue resolution: With error tracking and alerting features, your team can quickly identify and fix problems, minimizing downtime.
- Enhanced user experience: Custom dashboards and real-time analytics allow you to optimize applications, leading to better user satisfaction.
- Proactive management: Predictive analytics help anticipate potential issues, allowing you to address them before they impact performance.
- Scalability: As your business grows, these tools can handle increased traffic and data without losing performance.
- Informed decision-making: Access to comprehensive data insights supports smarter business decisions and strategic planning.
- Security assurance: With security safeguards like encryption, you can protect sensitive data and maintain compliance with regulations.
Costs and Pricing of Application Performance Management Software
Selecting application performance management software requires an understanding of the various pricing models and plans available. Costs vary based on features, team size, add-ons, and more. The table below summarizes common plans, their average prices, and typical features included in application performance management software solutions:
Plan Comparison Table for Application Performance Management Software
| Plan Type | Average Price | Common Features |
| Free Plan | $0 | Basic monitoring, limited data retention, and community support. |
| Personal Plan | $10-$30 /user /month | Real-time analytics, custom dashboards, and error tracking. |
| Business Plan | $50-$100 /user /month | Advanced reporting, predictive analytics, and integration capabilities. |
| Enterprise Plan | $150-$300/user /month | Full customization, dedicated support, and comprehensive security safeguards. |
Application Performance Management Software FAQs
Here are some answers to common questions about application performance management software:
How do you resolve application performance issues?
Resolving application performance issues often involves identifying bottlenecks and optimizing code. Start by using monitoring tools to pinpoint areas of concern. Implement code profiling to understand which parts of your application need improvement. Regularly update your software and conduct load testing to ensure optimal performance.
How do you monitor application performance?
Monitoring application performance requires setting clear performance goals and collecting granular data. Use monitoring tools to track metrics like response times and error rates. Configure dynamic alerting thresholds to get notified of any anomalies. Establish a response plan to address issues quickly when they arise.
What does an APM tool do?
APM tools track key software performance metrics to ensure system availability and optimize response times. It provides insights into application behavior, helping you improve user experiences. By analyzing telemetry data, APM tools help you maintain high performance and quickly resolve issues.
How can APM tools improve user experience?
APM tools enhance user experience by ensuring applications run smoothly and efficiently. They monitor performance metrics and detect issues before they affect users. By providing real-time insights and analytics, these tools help your team make informed decisions to keep applications responsive and reliable.
What are some common challenges in using APM tools?
Common challenges with APM solutions include managing large volumes of data and configuring alerts effectively. Users might face difficulties in integrating these tools with existing systems. Ensuring that the tool provides actionable insights without overwhelming the team with unnecessary data is crucial.
Why is real-time monitoring important in APM?
Real-time monitoring is vital in APM because it allows you to detect and address issues as they happen. This immediate insight ensures that your applications maintain high availability and performance. Real-time data helps your team make informed decisions quickly, reducing downtime and improving user satisfaction.
What's Next?
If you're in the process of researching APM software, connect with a SoftwareSelect advisor for free recommendations.
You fill out a form and have a quick chat where they get into the specifics of your needs. Then you'll get a shortlist of software to review. They'll even support you through the entire buying process, including price negotiations.

