10 Best APM Tools Reviewed in 2026

Best APM Tools Shortlist
Here’s my shortlist of the best APM tools:


The best APM tools help teams detect performance issues early, reduce downtime, trace slow transactions, and understand how applications behave under real-world load. These tools give engineers and operations teams clear visibility into services so they can fix bottlenecks before they affect users.
Teams often look for APM tools when misconfigurations cause outages, manual troubleshooting slows releases, or hidden dependencies make debugging difficult. Issues like inconsistent logs, unclear latency sources, and gaps in monitoring complicate collaboration across development, QA, and operations teams and lead to longer resolution times.
With over 20 years in the industry as a Chief Technology Officer, I’ve tested and reviewed dozens of APM tools across real environments to evaluate their accuracy, integrations, and ease of use. This guide highlights the top APM tools that improve visibility, enhance performance analysis, and help teams maintain reliable, responsive applications. Each review covers features, pros and cons, and best-fit use cases to help you choose the right tool.
Why Trust Our Software Reviews
Best APM Tools Summary
This comparison chart summarizes pricing details for my top APM tools selections to help you find the best one for your budget and business needs.
| Tool | Best For | Trial Info | Price | ||
|---|---|---|---|---|---|
| 1 | Best for developer-focused monitoring | Free plan + free demo available | From $26/month (billed annually) | Website | |
| 2 | Best for cloud-native support | Free demo + 30-day free trial available | From $9/month (billed annually) | Website | |
| 3 | Best for multi-cloud monitoring | 30-day free trial + free demo + free plan availabl | From $199/year | Website | |
| 4 | Best for microservices insights | Free demo + 15-day free trial available | From $7/host/month (billed annually) | Website | |
| 5 | Best for unified observability | Free trial available | Pricing upon request | Website | |
| 6 | Best for real-time data analysis | 14-day free trial + free plan available | From $15/host/month (billed annually) | Website | |
| 7 | Best for code-level diagnostics | 14-days free trial | From $80/month (billed annually) | Website | |
| 8 | Best for AI-driven insights | 14-day free trial | From $87/user/month | Website | |
| 9 | Best for full-stack observability | Free plan available | Pricing upon request | Website | |
| 10 | Best for cloud-native applications | 30-day free trial + free plan available | From $0.05/GB ingested | Website |


Best APM Tool Reviews
Below are my detailed summaries of the best APM tools that made it onto my shortlist. My reviews offer a detailed look at the key features, pros & cons, integrations, and ideal use cases of each tool to help you find the best one for you.

Sentry is an application performance monitoring tool designed for developers. It helps identify and fix errors in real-time, providing insights into application health and performance to improve user experience.
Why I picked Sentry: It's tailored for developers, offering error tracking and performance monitoring in one platform. The tool provides detailed stack traces, which help your team pinpoint the exact source of an issue. With real-time alerts, you’ll know about errors as they happen, allowing for quick resolutions. Sentry's focus on developer needs ensures that you can enhance your code quality and maintain application reliability.
Standout features & integrations:
Features include release tracking, which allows you to monitor the impact of new code releases on performance. User feedback lets your team gather insights directly from users experiencing issues. Sentry also offers detailed performance metrics, helping you analyze and optimize application speed and responsiveness.
Integrations include GitHub, GitLab, Bitbucket, Slack, Trello, Jira, Asana, Microsoft Teams, PagerDuty, and Zendesk.
Pros and Cons
Pros:
- Focused on developer needs
- Real-time error alerts
- Detailed stack trace availability
Cons:
- Some performance data delays
- Basic customization options
New Product Updates from Sentry

Sentry Enhances Alerting Across Uptime and Metrics
Sentry introduces expanded alert configuration for Uptime Monitors and adds alerting support to its Metrics open beta. These updates improve issue detection by enabling more flexible monitoring conditions and proactive alerts. For more information, visit Sentry’s official site.
 .
.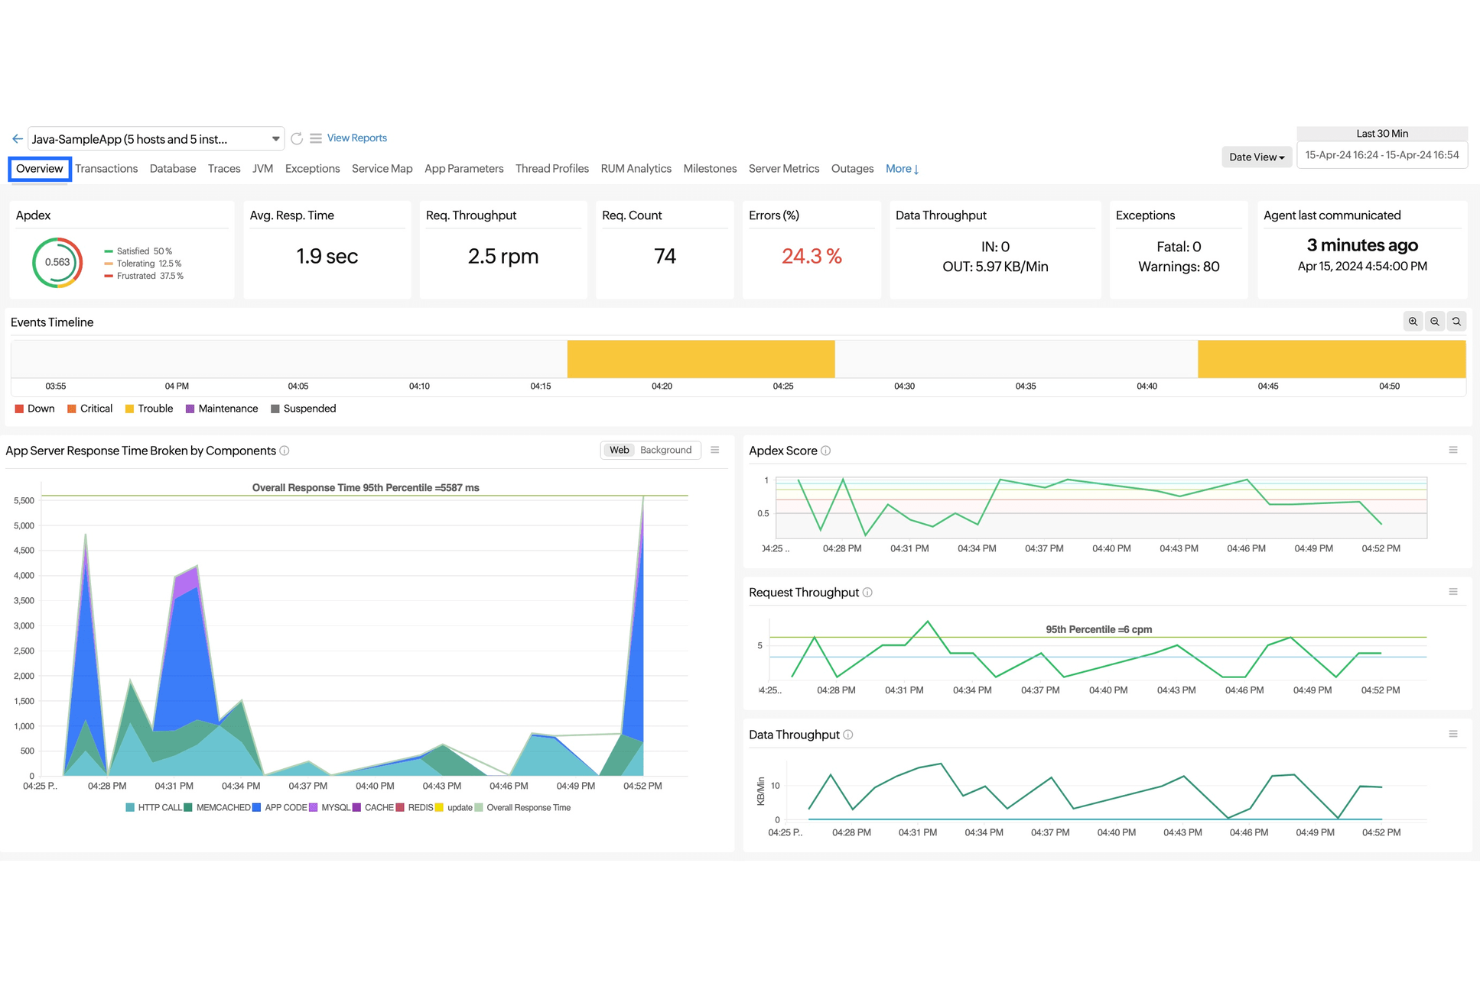
Site24x7 is an application performance monitoring tool designed for DevOps teams. It provides comprehensive insights into both on-premises and cloud-based application environments, focusing on monitoring and managing application performance effectively.
Why I picked Site24x7: It's tailored for cloud-native environments, offering features like end-to-end transaction tracing and automatic application discovery. The tool's AI-powered insights help proactively detect and resolve issues, which is essential for cloud-native support. Thread profiling and integrated metrics further enhance its ability to manage complex applications. These features make it a standout choice for teams needing cloud-native monitoring.
Standout features & integrations:
Features include automatic application discovery, which helps you identify all components of your application landscape. End-to-end transaction tracing allows your team to monitor transaction paths and find bottlenecks. AI-powered insights provide proactive issue detection, ensuring your applications run smoothly.
Integrations include Amazon Web Services, Microsoft Azure, Google Cloud Platform, Slack, Microsoft Teams, PagerDuty, ServiceNow, Zapier, Jira, and Zendesk.
Pros and Cons
Pros:
- Reliable uptime monitoring
- Comprehensive alerting channels
- Flexible monitoring options
Cons:
- Limited customization options
- Advanced setup challenges
New Product Updates from Site24x7

Site24x7 Enhances Monitoring with AI-Powered Features
Site24x7 introduces new AI-powered capabilities to improve monitoring and troubleshooting. These updates help teams identify issues faster and gain insights more efficiently across their systems. For more information, visit Site24x7’s official site.
 .
.
ManageEngine Applications Manager is an application performance monitoring tool aimed at IT and DevOps teams. It supports monitoring across cloud, on-premises, and hybrid environments, providing deep visibility and insights to optimize application performance and troubleshoot issues.
Why I picked ManageEngine Applications Manager: It excels in multi-cloud monitoring, offering features like full-stack observability and AI-powered insights. These capabilities enable your team to monitor applications across different cloud services seamlessly. It also includes digital experience monitoring, which helps in understanding user interactions. Additionally, it supports automated discovery and dependency mapping, ensuring comprehensive coverage of your IT landscape.
Standout features & integrations:
Features include real user monitoring, which allows you to track user interactions with your applications. Synthetic transaction monitoring simulates user actions to detect performance issues. The platform also provides advanced analytics for performance optimization and reporting, helping your team make data-driven decisions.
Integrations include Amazon Web Services, Microsoft Azure, Google Cloud Platform, VMware, Hyper-V, ServiceNow, Jira, Slack, PagerDuty, and Microsoft Teams.
Pros and Cons
Pros:
- Supports hybrid environments
- Advanced analytics capabilities
- Real-time user monitoring
Cons:
- Complex setup process
- Limited customization options
New Product Updates from ManageEngine Applications Manager

ManageEngine Adds Amazon VPC Monitoring Support
ManageEngine Applications Manager now supports Amazon VPC monitoring, allowing users to track network health and activity efficiently. For more information, visit ManageEngine Applications Manager's official site.
 .
.
Dynatrace is an application performance monitoring tool tailored for large enterprises and IT teams. It excels in providing detailed insights into microservices, helping businesses maintain high performance and reliability across complex environments.
Why I picked Dynatrace: It's known for its ability to provide deep insights into microservices, thanks to its AI-driven monitoring. The tool offers automatic discovery and mapping of microservices, which helps your team understand dependencies and performance. Real-time analytics and anomaly detection ensure that you can quickly address any issues. Dynatrace's focus on microservices insights makes it ideal for teams managing distributed applications.
Standout features & integrations:
Features include real user monitoring, which helps you understand how users interact with your applications. Synthetic monitoring allows your team to simulate user actions and catch potential issues. With cloud infrastructure monitoring, you can keep track of your cloud resources and their performance.
Integrations include Amazon Web Services, Microsoft Azure, Google Cloud Platform, Kubernetes, Docker, VMware, ServiceNow, Slack, Jira, and PagerDuty.
Pros and Cons
Pros:
- AI-driven anomaly detection
- Real-time analytics available
- Automatic dependency mapping
Cons:
- High resource consumption
- Complex configuration needed

AppDynamics is an application performance monitoring solution aimed at enterprise IT teams. It provides visibility into application performance across complex environments, helping teams ensure optimal operation and user satisfaction.
Why I picked AppDynamics: It offers unified observability, bringing together performance monitoring for applications, infrastructure, and end-user experience. The tool's application mapping feature helps your team understand dependencies and performance bottlenecks. Real-time business metrics allow you to correlate application performance with business outcomes. AppDynamics' focus on unified observability makes it a strong choice for comprehensive monitoring needs.
Standout features & integrations:
Features include end-to-end transaction tracing, which allows you to track the complete path of transactions. Dynamic baselining helps your team identify anomalies by setting performance benchmarks. The tool also provides business impact analysis, helping you understand how performance issues affect your bottom line.
Integrations include Amazon Web Services, Microsoft Azure, Google Cloud Platform, Docker, Kubernetes, ServiceNow, PagerDuty, Slack, Jira, and Microsoft Teams.
Pros and Cons
Pros:
- Application dependency mapping
- Real-time business metrics
- Comprehensive monitoring capabilities
Cons:
- Resource-intensive monitoring
- Complex configuration process

Datadog is an application performance monitoring tool designed for IT operations teams and developers. It provides real-time insights into application performance and infrastructure health, helping teams quickly identify and resolve issues.
Why I picked Datadog: It excels in real-time data analysis, offering features like live process monitoring and customizable dashboards. These features provide your team with immediate insights into application and infrastructure performance. With anomaly detection, you can catch issues before they become critical. Datadog's focus on real-time analysis makes it ideal for environments where quick response times are crucial.
Standout features & integrations:
Features include distributed tracing, which helps you follow requests across services and understand performance bottlenecks. Log management enables your team to aggregate, search, and analyze logs in real-time. The tool also offers network performance monitoring, allowing you to visualize traffic flow and identify network issues.
Integrations include Amazon Web Services, Microsoft Azure, Google Cloud Platform, Kubernetes, Docker, Slack, Jira, PagerDuty, GitHub, and Bitbucket.
Pros and Cons
Pros:
- Immediate insights into performance
- Distributed tracing capabilities
- Real-time log management
Cons:
- Initial setup complexity
- High resource consumption

Retrace is an application performance monitoring tool designed for developer teams, especially those working with ASP.NET and Java applications. It combines APM, logging, error tracking, and metrics monitoring to support both pre-production and production environments.
Why I picked Retrace: It excels in providing code-level diagnostics, offering features like transaction tracing and metrics monitoring. These capabilities help your team identify performance issues directly within the code. With log management, you can aggregate and analyze logs in real-time. Retrace's targeted focus on code-level insights makes it ideal for development teams needing detailed diagnostics.
Standout features & integrations:
Features include transaction tracing, which helps you follow requests through your application's code. Metrics monitoring allows your team to track performance indicators and identify trends. The tool also offers robust alerting capabilities, ensuring you’re notified of issues promptly.
Integrations include Microsoft Azure, Amazon Web Services, Docker, Kubernetes, GitHub, Jenkins, Slack, Jira, Azure DevOps, and Bitbucket.
Pros and Cons
Pros:
- Comprehensive log management
- Effective transaction tracing
- Detailed code-level insights
Cons:
- Limited advanced analytics
- Initial setup complexity

IBM Instana Observability is a monitoring tool aimed at IT operations and DevOps teams. It provides continuous real-time visibility into application performance, helping teams quickly detect and resolve issues to maintain optimal service delivery.
Why I picked IBM Instana Observability: It offers AI-driven insights, which help your team identify performance anomalies and trends. The tool provides automatic discovery and mapping of application dependencies, ensuring comprehensive coverage. With real-time data processing, you can respond to issues as they occur. Instana's focus on AI-driven insights makes it a strong choice for teams needing proactive monitoring.
Standout features & integrations:
Features include automatic root cause analysis, which helps you quickly pinpoint the source of issues. Contextualized metrics allow your team to view performance data in the context of application dependencies. The tool also offers real-time analytics, providing immediate insights into application health.
Integrations include Amazon Web Services, Microsoft Azure, Google Cloud Platform, Kubernetes, Docker, Slack, Jira, PagerDuty, Splunk, and ServiceNow.
Pros and Cons
Pros:
- AI-driven anomaly detection
- Real-time data processing
- Automatic root cause analysis
Cons:
- Complex setup process
- High resource requirements

New Relic APM 360 is a comprehensive application performance monitoring solution designed to provide real-time insights into your application's health and performance. It serves development and operations teams by offering a unified view of critical telemetry data across the entire application stack and development lifecycle.
Why I picked New Relic APM 360: This tool provides an at-a-glance view of application health, enabling your team to prevent issues before they impact users. It integrates infrastructure insights, error tracking, log patterns, and distributed traces with key performance metrics, allowing you to debug faster with a full-stack perspective. Additionally, guided workflows and data recommendations help eliminate monitoring gaps, ensuring comprehensive observability.
Standout features & integrations:
Features include real-time monitoring of critical health indicators, integration of infrastructure metrics with application performance data, and unified views of distributed traces for efficient troubleshooting.
Integrations include Amazon Web Services, Microsoft Azure, Google Cloud Platform, Kubernetes, Prometheus, SAP, Pivotal Cloud Foundry, Jenkins, PagerDuty, and Slack.
Pros and Cons
Pros:
- Offers unified views of distributed traces
- Integrates infrastructure and application performance data
- Provides real-time insights into application health
Cons:
- Frequent updates may require ongoing adjustments
- Potential for increased costs with high data ingest

Microsoft Azure Monitor is a cloud-based APM solution that provides in-depth insights into applications hosted on Azure. With its tailored features for Azure, it ensures businesses get comprehensive metrics and analytics on their applications within this ecosystem.
Why I Picked Microsoft Azure Monitor: When I embarked on selecting top-tier APM tools, Microsoft Azure Monitor's close-knit integration and performance data relevancy with Azure-based applications made it impossible to overlook. Through a rigorous process of comparison and judging, I've determined that Azure Monitor's specialized insights into Azure-hosted apps are unparalleled.
Hence, I firmly believe this tool is "best for Azure-based application insights."
Standout Features & Integrations:
Azure Monitor excels in visualizations, offering detailed topology views and dependency maps for applications. The tool aids in swift troubleshooting with root cause analysis and end-to-end monitoring of Azure resources.
Notably, Azure Monitor integrates with other Azure services, ensuring a cohesive monitoring solution for applications, infrastructure, and other resources within the Azure ecosystem.
Pros and Cons
Pros:
- Detailed root cause analysis for faster performance issue identification
- Deep integration with other Azure services and resources
- Tailored insights and metrics specifically for Azure-hosted applications
Cons:
- Pricing might not be as competitive for small projects or businesses.
- Complexity might be a bit overwhelming for newcomers to Azure or APM tools
Other APM Tools
Here are some additional APM tools options that didn’t make it onto my shortlist, but are still worth checking out:
- Micro Focus AppPulse
For user experience tracking
- Progress WhatsUp Gold
For network monitoring
- FusionReactor Java APM
For Java developers
- Checkmk
For open-source environments
- Dotcom Monitor
For real user journey simulations
- Coralogix
For real-time log analytics
- Lumigo
For serverless architecture
- Elastic Observability
For search-based monitoring
- Blue Matador
For automated alerts
- Pandora FMS
For flexible monitoring options
- meshIQ
For middleware monitoring
- Scout APM
For pinpointing bottlenecks
- Splunk Application Performance Monitoring
For large-scale data analysis
- OpenText Operations Bridge Manager
For hybrid IT environments
- TrueSight Operations Management
For IT operations
- Alluvio Aternity Digital Experience Management Platform
For user experience insights
- DX Application Performance Management (APM)
For AI-driven analytics
- Firebase Performance Monitoring
For mobile app developers


APM Tool Selection Criteria
When selecting the best APM tools to include in this list, I considered common buyer needs and pain points like identifying performance bottlenecks and ensuring application reliability. I also used the following framework to keep my evaluation structured and fair:
Core Functionality (25% of total score)
To be considered for inclusion in this list, each solution had to fulfill these common use cases:
- Monitor application performance
- Detect and diagnose issues
- Provide real-time alerts
- Track user interactions
- Analyze performance metrics
Additional Standout Features (25% of total score)
To help further narrow down the competition, I also looked for unique features, such as:
- AI-driven insights
- Automatic dependency mapping
- End-to-end transaction tracing
- Customizable dashboards
- Real-time log analytics
Usability (10% of total score)
To get a sense of the usability of each system, I considered the following:
- Intuitive user interface
- Ease of navigation
- Customization options
- Learning curve
- Efficiency of workflow integration
Onboarding (10% of total score)
To evaluate the onboarding experience for each platform, I considered the following:
- Availability of training videos
- Interactive product tours
- Access to webinars
- Comprehensive documentation
- Quality of customer onboarding support
Customer Support (10% of total score)
To assess each software provider’s customer support services, I considered the following:
- Availability of 24/7 support
- Responsiveness of support team
- Access to live chat
- Quality of support documentation
- Availability of dedicated account managers
Value For Money (10% of total score)
To evaluate the value for money of each platform, I considered the following:
- Competitive pricing
- Features included in base price
- Flexibility of pricing plans
- Cost-effectiveness for large teams
- Availability of free trials or demos
Customer Reviews (10% of total score)
To get a sense of overall customer satisfaction, I considered the following when reading customer reviews:
- Overall satisfaction ratings
- Frequency of common complaints
- Praise for specific features
- Feedback on ease of use
- Comments on support experience
How to Choose APM Tools
It’s easy to get bogged down in long feature lists and complex pricing structures. To help you stay focused as you work through your unique software selection process, here’s a checklist of factors to keep in mind:
| Factor | What to Consider |
| Scalability | Ensure the tool can grow with your team and handle increasing workloads without losing performance. Consider future expansion and the tool's ability to support larger applications. |
| Integrations | Look for compatibility with your existing tech stack, including cloud services, databases, and collaboration tools. This ensures seamless data flow and efficiency. |
| Customizability | Check if the tool allows you to tailor dashboards, alerts, and reports to fit your specific monitoring needs and workflows. Personalization enhances usability. |
| Ease of Use | Evaluate the user interface and learning curve. A tool that's easy to navigate and understand will save your team time and reduce frustration. |
| Budget | Compare pricing plans and ensure they align with your financial constraints. Consider total cost of ownership, including hidden fees or necessary add-ons. |
| Security Safeguards | Assess the tool's data protection measures, such as encryption and compliance with industry standards like GDPR, to keep your data secure and private. |
| Support | Consider the availability and quality of customer support. Reliable support can help resolve issues quickly and keep your operations running smoothly. |
| Performance Metrics | Look for comprehensive performance monitoring tools that include real-time analytics and historical data analysis, to ensure optimal application performance. |
Trends in APM Tools
In my research, I sourced countless product updates, press releases, and release logs from different APM tools vendors. Here are some of the emerging trends I’m keeping an eye on:
- AI-Powered Insights: Many APM tools are now using AI to provide predictive analytics and automated anomaly detection. This helps teams identify issues before they impact users. Vendors like IBM Instana are incorporating AI to enhance real-time monitoring and issue resolution.
- End-User Experience Monitoring: There's a growing focus on understanding how users interact with applications. Tools are measuring user satisfaction and performance metrics to improve service delivery. Micro Focus AppPulse, for example, tracks user experience in real-time to optimize application performance.
- Full-Stack Visibility: Vendors are expanding capabilities to offer insights across the entire tech stack, not just applications. This holistic view helps in understanding dependencies and performance bottlenecks. New Relic offers full-stack observability to provide comprehensive monitoring.
- Real-Time Data Processing: The demand for instant insights has led to a focus on real-time data processing. This enables teams to react promptly to performance issues. Datadog provides real-time analytics to ensure quick decision-making.
- Shift-Left Monitoring: Integrating APM earlier in the development process is becoming popular. This trend helps developers catch performance issues during the build phase, improving overall quality. Tools like Sentry focus on developer-centric monitoring to support this approach.
What Are APM Tools?
Application Performance Monitoring (APM) tools monitor and manage the performance of applications. IT operations teams, developers, and DevOps professionals generally use these tools to ensure applications run smoothly and efficiently.
Real-time monitoring, user interaction tracking, and AI-powered insights help with identifying issues, optimizing performance, and improving user satisfaction. Modern data observability tools complement APM solutions by providing deeper visibility into data pipelines and quality metrics. Overall, these tools provide valuable insights that help maintain application reliability and enhance user experience.
Features of APM Tools
When selecting APM tools, keep an eye out for the following key features:
- End-user experience tracking: Measures user interactions and satisfaction to optimize service delivery and enhance user experience.
- AI-powered insights: Uses artificial intelligence to predict performance issues and automate anomaly detection, improving efficiency.
- Full-stack visibility: Offers insights across the entire tech stack, allowing teams to understand dependencies and pinpoint bottlenecks.
- Real-time monitoring: Similar to API monitoring tools, APM solutions provide instant insights into application performance, helping teams quickly detect and address issues.
- Transaction tracing: Follows requests through the application's code to identify performance issues and optimize processes.
- Log management: Aggregates and analyzes logs in real-time to provide valuable insights and support troubleshooting efforts.
- Dynamic baselining: Sets performance benchmarks to identify anomalies and maintain optimal application performance.
- Automated discovery: Identifies and monitors all components of the application environment, ensuring comprehensive coverage.
- Customizable dashboards: Allows teams to tailor views and reports to fit specific monitoring needs and workflows.
- Real-time data processing: Enables prompt reactions to performance issues by providing immediate analytics and insights.
Benefits of APM Tools
Implementing APM tools provides several benefits for your team and your business. Here are a few you can look forward to:
- Improved application performance management: Real-time monitoring and transaction tracing help identify and fix performance issues quickly.
- Enhanced user satisfaction: End-user experience tracking ensures applications meet user expectations and improve overall satisfaction.
- Proactive issue detection: AI-powered insights and anomaly detection allow teams to address problems before they impact users.
- Comprehensive visibility: Full-stack visibility and automated discovery provide a complete view of the application environment, aiding in better decision-making.
- Efficient troubleshooting: Log management and dynamic baselining streamline the process of diagnosing and resolving issues.
- Customizable insights: Customizable dashboards allow teams to focus on the most relevant data, improving monitoring efficiency.
- Faster response times: Real-time data processing enables teams to react promptly to any issues, minimizing downtime.
Costs and Pricing of APM Tools
Selecting APM tools requires an understanding of the various pricing models and plans available. Costs vary based on features, team size, add-ons, and more. The table below summarizes common plans, their average prices, and typical features included in APM tools solutions:
Plan Comparison Table for APM Tools
| Plan Type | Average Price | Common Features |
| Free Plan | $0 | Basic monitoring, limited alerts, and community support. |
| Personal Plan | $10-$30/user/month | Real-time monitoring, basic analytics, and email support. |
| Business Plan | $50-$100/user/month | Full-stack visibility, user experience tracking, and phone support. |
| Enterprise Plan | $150-$300/user/month | AI-driven insights, customizable dashboards, and dedicated account management. |
APM Tools (FAQs)
Here are some answers to common questions about APM tools:
How does the APM tool work?
APM tools monitor user requests and application traffic to detect anomalies. They alert you to unexpected changes, like surges in requests or unusual patterns. This helps you react quickly to potential issues and maintain smooth application performance.
What are the challenges of APM?
APM faces challenges like managing a dynamic ecosystem of interconnected technologies and handling large volumes of data. Adoption hurdles and limited flexibility can also be obstacles. Overcoming these requires careful planning and choosing the right tools for your needs.
Which APM tool is best?
The best APM tool depends on your specific requirements, such as budget and features needed. Tools like AppDynamics, Datadog, and Splunk offer real-time monitoring and cater to different price ranges. Evaluate your needs to find the right fit for your team.
Is Splunk an APM tool?
Splunk provides integrations with APM tools like AppDynamics and New Relic. These integrations allow you to apply predictive analytics to APM data and correlate it with other machine data. This enhances your ability to monitor and optimize application performance.
How do APM tools support cloud environments?
APM tools support cloud environments by offering monitoring across cloud platforms like AWS, Azure, and Google Cloud. They provide insights into cloud resource usage and performance, helping you optimize your cloud applications and infrastructure.
Can APM tools integrate with DevOps practices?
Yes, APM tools integrate well with DevOps practices by providing continuous monitoring and feedback. They help teams quickly identify and resolve issues, supporting agile development cycles and improved software delivery.
What's Next?
If you're in the process of researching APM tools, connect with a SoftwareSelect advisor for free recommendations.
You fill out a form and have a quick chat where they get into the specifics of your needs. Then you'll get a shortlist of software to review. They'll even support you through the entire buying process, including price negotiations.