24 Meilleurs Outils de Surveillance du Système Passés en Revue en 2026

10 Liste restreinte des meilleurs outils de surveillance des systèmes
Here's my pick of the 10 best software from the 24 tools reviewed.


Les outils de surveillance des systèmes vous aident à suivre la santé et les performances de votre infrastructure, afin que vous puissiez détecter et corriger les problèmes avant qu'ils n'impactent les utilisateurs.
De nombreuses équipes se tournent vers ces outils lorsqu'elles sont confrontées à des pannes inattendues, à des systèmes lents ou à un manque de visibilité sur l'activité réseau. Sans la solution adéquate, il est difficile de savoir ce qui ne va pas ou même où chercher.
J'ai collaboré avec des équipes de SaaS et de fournisseurs de services informatiques pour évaluer et mettre en œuvre des plateformes de surveillance permettant de réduire les temps d'arrêt et d'accélérer les temps de résolution. Ce guide partage ce que j'ai appris pour vous aider à trouver l'outil qui correspond à votre système et à vos méthodes de travail.
Why Trust Our Software Reviews
Résumé des meilleurs outils de surveillance des systèmes
Ce tableau comparatif résume les détails tarifaires de mes principaux choix d’outils de surveillance des systèmes, afin de vous aider à trouver celui qui convient le mieux à votre budget et à vos besoins professionnels.
| Tool | Best For | Trial Info | Price | ||
|---|---|---|---|---|---|
| 1 | Best for remote monitoring and management | 30-day free trial + free demo available | From $149/technician/month (billed annually) | Website | |
| 2 | Best for end-to-end complex IT monitoring | Free plan + 30-day free trial available | From $225/month (billed annually) | Website | |
| 3 | Best for real-time error tracking | Free plan + free demo available | From $26/month (billed annually) | Website | |
| 4 | Best for simple, centralized system monitoring | Free trial available | From 2,149/year | Website | |
| 5 | Best for full-stack infrastructure monitoring | Free trial + demo available | From $9/month (billed annually) | Website | |
| 6 | Best for distributed network monitoring | 30-day free trial | Pricing upon request | Website | |
| 7 | Best for AI-driven full-stack monitoring | 15-day free trial + free demo available | From $7/host/month | Website | |
| 8 | Best for comprehensive IT infrastructure monitoring | Free 30-day trial | From $20/user/month (billed annually) | Website | |
| 9 | Best for infrastructure health insights | Free plan + free demo available | Pricing upon request | Website | |
| 10 | Best for application performance metrics | 14-day free trial + free plan available | From $15/host/month | Website |

-

Site24x7
Visit WebsiteThis is an aggregated rating for this tool including ratings from Crozdesk users and ratings from other sites.4.6 -
Docker
Visit WebsiteThis is an aggregated rating for this tool including ratings from Crozdesk users and ratings from other sites.4.6 -
Pulumi
Visit WebsiteThis is an aggregated rating for this tool including ratings from Crozdesk users and ratings from other sites.4.8


Avis sur les meilleurs outils de surveillance des systèmes
Vous trouverez ci-dessous mes résumés détaillés des meilleurs outils de surveillance des systèmes que j’ai retenus dans ma sélection. Mes avis offrent un aperçu approfondi des fonctionnalités clés, des avantages et inconvénients, des intégrations et des cas d’utilisation idéaux de chaque outil pour vous aider à trouver celui qui vous convient.

Atera offers a single platform that brings together system-monitoring, alerting, patching and remote management—making it a solid fit if you manage IT infrastructure for a small business or MSP and want a clearer view of what your devices are doing. It appeals especially to IT teams who juggle servers, endpoints and networks and need timely visibility when CPU load or disk space start creeping up.
Why I Picked Atera
I picked Atera for its robust Remote Monitoring and Management (RMM) capabilities, which are crucial for system monitoring. Atera allows you to continuously track key metrics like device availability, CPU, RAM, and disk usage. This ensures your team stays ahead of potential issues with real-time alerts and automated responses, addressing common challenges in system performance and resource management.
Atera Key Features
In addition to its RMM capabilities, Atera offers:
- Patch Management: Automatically updates and patches systems to maintain security and performance.
- Network Discovery: Identifies and monitors all devices connected to your network, providing a comprehensive overview.
- IT Automation: Custom scripts and automation workflows reduce manual tasks and enhance productivity.
- Helpdesk Integration: Seamlessly integrates with ticketing systems to streamline issue resolution.
Atera Integrations
Atera integrates with popular platforms such as Microsoft Teams, Slack, Zapier, Bitdefender, Acronis, Splashtop, Domotz, and Cynet. These integrations enhance its functionality and provide a cohesive IT management experience.
Pros and Cons
Pros:
- Consolidates IT management into a single platform, simplifying operations.
- Built-in asset and software inventory gives visibility into hardware and software deployments.
- Threshold alerts and remote maintenance tools reduce response time for device incidents.
Cons:
- Less granular control for highly complex custom workflows or integrations.
- Project management and complex SLA tracking are relatively limited.
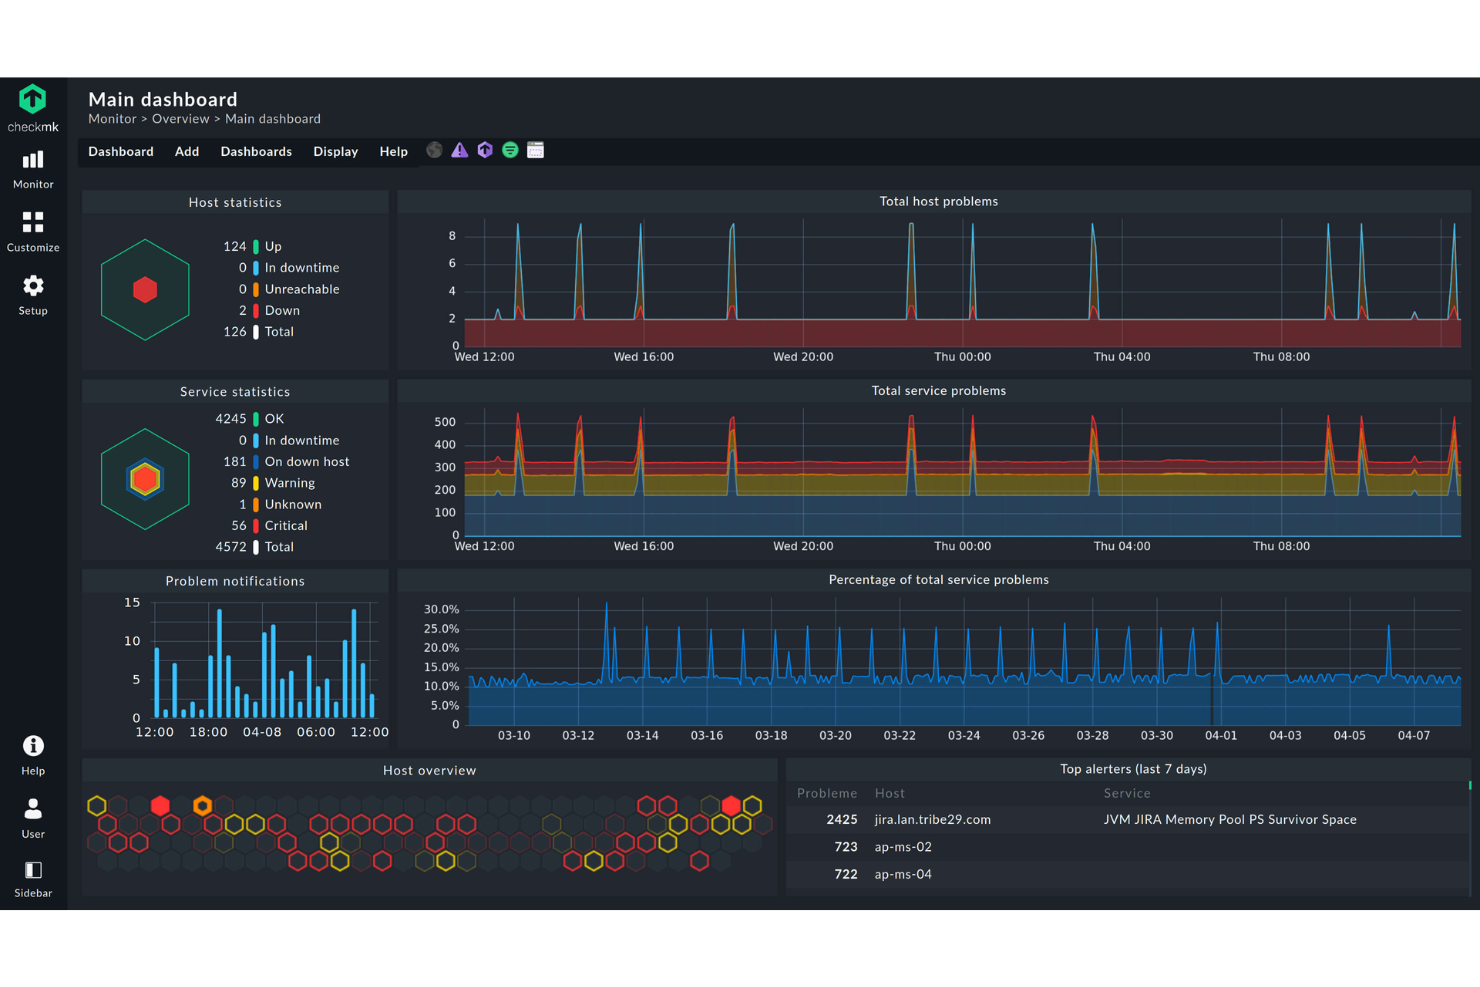
Checkmk offers a comprehensive solution for IT professionals seeking a reliable system monitoring tool that supports both cloud and on-premises environments. Designed to accommodate diverse IT infrastructures, Checkmk appeals to businesses in need of monitoring applications, networks, and servers with ease. By automating monitoring processes and providing in-depth insights, it addresses challenges like unexpected downtime and resource inefficiencies.
Why I Picked Checkmk
I picked Checkmk for its ability to provide end-to-end monitoring across complex IT environments. The tool's automation features, such as host lifecycle management and auto-registration, simplify the setup and maintenance of dynamic systems. Additionally, its extensive plugin support, with over 2,000 plugins, ensures seamless monitoring across various platforms. These capabilities make Checkmk an excellent choice for organizations looking to maintain high performance and availability in their IT infrastructure.
Checkmk Key Features
In addition to end-to-end complex IT monitoring, Checkmk offers:
- Log Monitoring: Combines metrics and log data to quickly identify issues, reducing operator overload.
- Business Process Monitoring: Maps application dependencies to monitor key business processes, providing real-time and historical insights.
- Custom Dashboards: Allows users to create interactive graphs and tailored views for better visualization of IT health.
- Smart Alerting: Offers targeted notifications and integrates with ITSM systems to manage incidents effectively.
Checkmk Integrations
Native integrations include APC, Brocade, Cisco Systems, Dell, Fujitsu, Hewlett Packard Enterprise, IBM, Microsoft SQL Server, Oracle Database, and VMware ESX.
Pros and Cons
Pros:
- Flexible monitoring options that support custom setups
- Real-time dashboard updates for better infrastructure visibility
- Supports tailored monitoring configurations for complex environments
Cons:
- Interface may feel confusing at first
- Limited guidance and documentation for beginners

Sentry is an open-source platform that offers error-tracking capabilities across various applications, helping developers identify, triage, and resolve issues efficiently. Its prowess in delivering real-time insights into application errors and their root causes makes it particularly adept at the "best for real-time error tracking" title.
Why I Picked Sentry: In the process of selecting the most proficient tools for error tracking, Sentry consistently rose to prominence in my evaluations. What sets it apart is its capability to provide immediate visibility into errors, making debugging quicker and more efficient.
I determined that for developers who value real-time insights and rapid resolution of issues, Sentry stands out as the best choice for real-time error tracking.
Standout Features & Integrations:
Sentry shines with its stack trace details, helping pinpoint the exact line of code causing issues. Its release tracking feature provides a clear view of when new errors are introduced, enhancing the post-deployment monitoring process.
Furthermore, Sentry offers integrations with popular platforms and tools, including GitHub, Slack, and Jira, ensuring streamlined error management.
Pros and Cons
Pros:
- Integrates with many popular development and communication tools
- Contextual data assists in replicating and resolving issues
- Detailed stack traces provide precise error locations
Cons:
- Some users have mentioned a desire for more flexible alerting options
- Larger teams might find the need to upgrade for more events
- Might be overwhelming for beginners due to its extensive features
New Product Updates from Sentry
Sentry Adds Metrics Support for .NET and Unity SDKs
Sentry adds Metrics support to the .NET SDK and Unity SDK, so teams can send metrics data alongside their existing monitoring for better visibility into app performance. For more information, visit Sentry's official site.
 .
.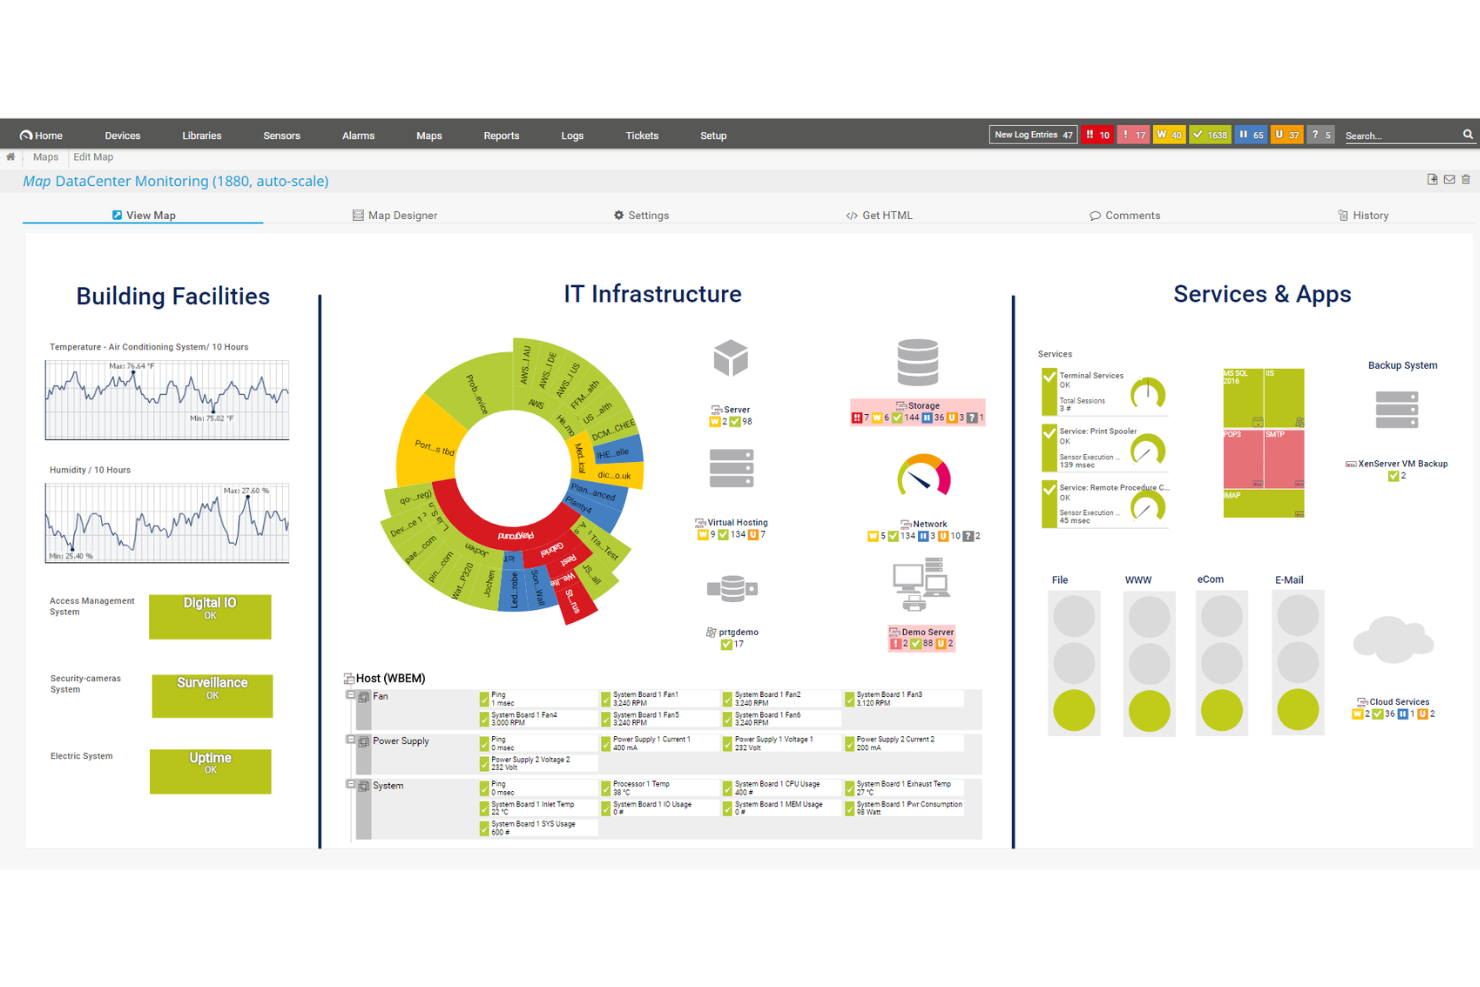
PRTG is a comprehensive system monitoring tool designed to help you oversee your entire IT infrastructure. It provides real-time insights into your network's health, performance, and security, enabling you to detect and address issues promptly.
Why I Picked PRTG: One of the key features of PRTG is its customizable alerts and data visualization. You can set specific thresholds for various metrics, and PRTG will notify you immediately when these are breached. This proactive approach allows your team to respond swiftly to potential problems, minimizing downtime and maintaining system reliability.
I also like its simple, centralized system monitoring approach: It gives you a holistic view of system health and performance. PRTG tool enables you to monitor all aspects of your IT infrastructure, from individual devices to entire networks. This comprehensive oversight helps in identifying issues that might not be apparent when examining components in isolation, facilitating more effective troubleshooting and maintenance.
Standout Features & Integrations:
Other features include real-time monitoring, customizable dashboards, historical data analysis, distributed monitoring, flexible alerting options, mobile access, remote probes, auto-discovery of devices, SNMP monitoring, WMI and Windows performance counters, SSH monitoring, and HTTP request monitoring.
Integrations include AWS, Cisco, Dell Technologies, HPE, VMware, ServiceNow, Check Point, Sonicwall, NetApp, Fujitsu, Lansweeper, and Martello.
Pros and Cons
Pros:
- Scalable to accommodate growing network demands
- Customizable dashboards and real-time alerts
- Supports multiple monitoring technologies
Cons:
- Licensing based on sensors can become expensive for larger networks
- Initial setup can be time-consuming
New Product Updates from PRTG
PRTG Introduces Proxmox VE Node Performance Sensor
PRTG introduces the Proxmox VE Node Performance Sensor to monitor performance metrics and status of Proxmox VE host nodes. This update provides better visibility into virtualization infrastructure health and performance. For more information, visit PRTG’s official site.
 .
.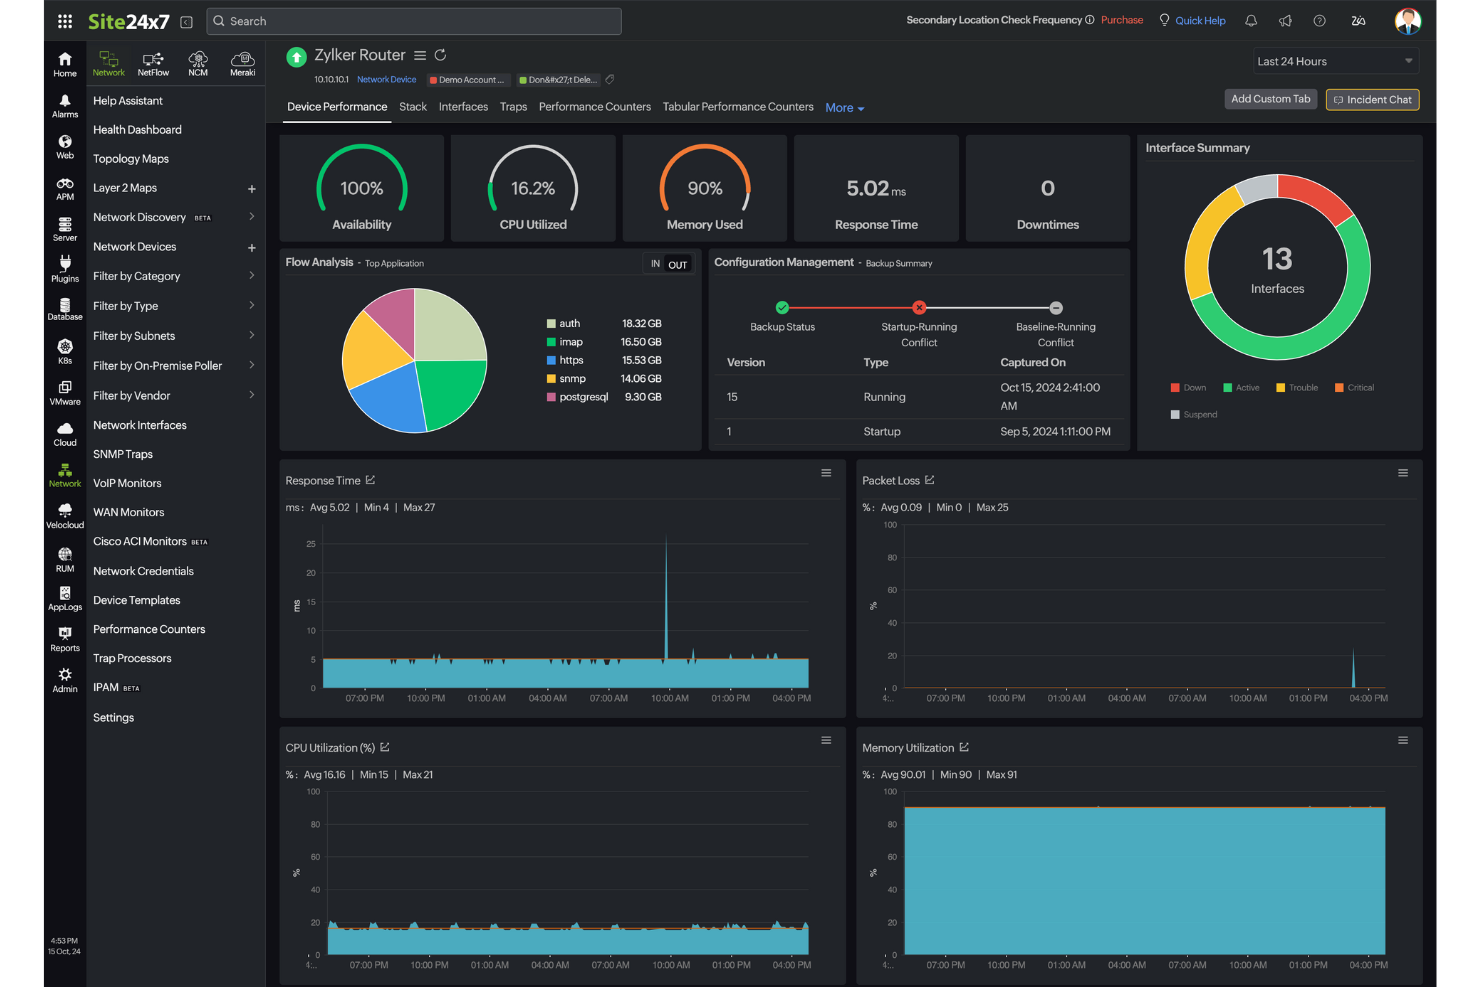
For IT professionals seeking a reliable system monitoring solution, Site24x7 provides full-stack infrastructure monitoring that addresses the complexities of modern infrastructure management. Tailored for businesses ranging from small to large enterprises, it offers monitoring capabilities that help maintain the performance of digital assets. Whether you're managing cloud services, network devices, or applications, Site24x7 provides the tools to identify and resolve issues quickly, keeping systems stable and accessible.
Why I Picked Site24x7
I picked Site24x7 for its comprehensive infrastructure monitoring capabilities, which are crucial for businesses looking to maintain a healthy IT environment. Its unique ability to cover server, cloud, and virtualization monitoring ensures that you have a comprehensive view of your IT assets. The platform also excels with its application performance monitoring, allowing you to track and optimize application health and performance metrics. These features are particularly beneficial for teams aiming to proactively manage and resolve potential issues before they affect end users.
Site24x7 Key Features
In addition to full-stack infrastructure monitoring, Site24x7 offers:
- Real User Monitoring (RUM): This feature provides real-time insights into user interactions, helping you understand and improve user experience.
- Log Management: Allows centralized handling and analysis of log data for better operational insights and troubleshooting.
- AIOps: Utilizes artificial intelligence to offer operational insights and automate routine tasks, enhancing efficiency.
- Cloud Cost Management: Helps manage and optimize cloud spending, ensuring cost-effective use of resources.
Site24x7 Integrations
Integrations include ServiceNow, PagerDuty, Slack, Microsoft Teams, Jira, Zoho Analytics, Google Cloud Platform, ManageEngine ServiceDesk Plus, 6clicks, and more.
Pros and Cons
Pros:
- Flexible monitoring integrates easily with multiple infrastructure components
- Quick setup process covers websites and cloud resource monitoring
- AI-powered full-stack monitoring supports multicloud infrastructure management
Cons:
- Pricing structure becomes expensive due to multiple monitor types
- Alert bugs cause issues when adding new monitoring configurations
New Product Updates from Site24x7

Site24x7 Enhances Monitoring with AI-Powered Features
Site24x7 introduces new AI-powered capabilities to improve monitoring and troubleshooting. These updates help teams identify issues faster and gain insights more efficiently across their systems. For more information, visit Site24x7’s official site.
 .
.
ManageEngine OpManager is a robust network monitoring solution designed to provide real-time insights into your entire IT infrastructure. It tracks the health, availability, and performance of network devices, servers, and applications, ensuring reliable operations across distributed networks.
Why I Picked ManageEngine OpManager: I chose ManageEngine OpManager for its strong focus on distributed network monitoring and its extensive integration capabilities. Its support for remote probes and centralized dashboards makes it especially effective for enterprises managing complex, multi-location environments. I found its combination of real-time alerts, detailed visualization tools, and hardware monitoring particularly useful for proactive issue resolution and capacity planning.
Standout Features & Integrations:
ManageEngine OpManager offers features like distributed network monitoring with remote probes, advanced network visualization tools (Layer2 maps, topology maps, and 3D rack views), and storage monitoring for effective capacity management. It includes network path analysis and AIOps-enabled features for intelligent anomaly detection and automated workflows.
ManageEngine OpManager integrates with a wide range of IT management and security tools, including ADManager Plus, ServiceDesk Plus, Endpoint Central, Patch Manager Plus, Mobile Device Manager Plus, Log360, EventLog Analyzer, Firewall Analyzer, Analytics Plus, and CloudSpend.
Pros and Cons
Pros:
- Real-time, auto-updating network maps
- Supports multiple vendor environments
- Automated, scheduled network discovery
Cons:
- Initial setup can be complex
- Pricing may be high for small teams
New Product Updates from ManageEngine OpManager
ManageEngine OpManager Vendor Templates and NCM XML Import
ManageEngine OpManager introduces enhanced vendor template integration and device template import for the NCM module using XML files. This update helps teams improve device classification and speed up configuration workflows. For more information, visit ManageEngine OpManager’s official site.
 .
.
Dynatrace provides a comprehensive monitoring solution that covers the full stack of a digital environment. With its AI-driven approach, Dynatrace pinpoints performance issues, anomalies, and other relevant metrics, making it pivotal for businesses that rely heavily on the performance of their digital assets.
Why I Picked Dynatrace: Of the myriad of monitoring solutions, I selected Dynatrace due to its robust AI capabilities that differentiate it from its competitors. After judging and comparing several tools, I have the opinion that Dynatrace excels in providing precise insights.
Given the increasing complexity of digital environments, I determined that an AI-driven tool like Dynatrace is best for businesses that require full-stack monitoring.
Standout Features & Integrations:
One of Dynatrace's core features is its Davis AI, which autonomously detects, prioritizes, and diagnoses issues in real-time. Furthermore, the platform offers cloud infrastructure monitoring and digital experience insights.
Dynatrace smoothly integrates with popular platforms such as AWS, Azure, and Google Cloud, ensuring that businesses can capture data across multiple environments.
Pros and Cons
Pros:
- Extensive integrations with major cloud platforms
- Offers a holistic view of digital environments, from cloud to user experience
- Davis AI provides real-time autonomous problem detection and diagnosis
Cons:
- Some users might find the initial setup and configuration challenging
- Might be over-comprehensive for smaller businesses or simpler setups
- Absence of transparent pricing might deter potential users

Nagios has positioned itself as an industry leader when it comes to monitoring IT infrastructure. Known for its breadth and depth, Nagios ensures that systems, apps, services, and business processes within an organization function as expected.
Why I Picked Nagios: When it came to selecting a tool for comprehensive IT infrastructure monitoring, Nagiosfront-runner emerged as a front runner in my comparison. I found its flexibility in monitoring both large and small network environments particularly compelling.
In my judgment, for organizations that need a holistic overview of their entire IT landscape, Nagios sits at the pinnacle, hence earning its tag as "best for comprehensive IT infrastructure monitoring."
Standout Features & Integrations:
Nagios stands out for its capacity to monitor hosts across multiple platforms, pinpointing failures and anomalies. Its in-depth reporting provides administrators with detailed insights, allowing them to act proactively.
To augment its functionality, Nagios offers integrations with a range of plugins and add-ons, expanding its monitoring capabilities.
Pros and Cons
Pros:
- Detailed reporting and alerting mechanisms
- Extensive plugin architecture allows custom monitoring solutions
- Broad monitoring capabilities across diverse IT environments
Cons:
- Commercial versions can be costly for smaller organizations
- Configuration may be complex for novices
- The user interface can feel outdated compared to some competitors

New Relic is a performance management software that specializes in providing real-time analytics and insights into your system's infrastructure. It allows teams to understand the health, performance, and availability of their software stack, emphasizing infrastructure health insights that are crucial in today's digital age.
Why I Picked New Relic: I chose New Relic after carefully selecting and comparing it with other tools in the industry. What made me determine its position on this list is its sharp focus on infrastructure insights. In my judgment, New Relic's unique ability to dive deep into infrastructure health sets it apart, ensuring that businesses have a clear picture of the vitality of their software stack.
Standout Features & Integrations:
New Relic's Infrastructure monitoring offers a live state event feed, allowing users to visualize changes as they occur. Coupled with its intuitive dashboards, users can spot and resolve issues rapidly. Integration-wise, New Relic smoothly connects with popular cloud platforms, including AWS, Azure, and Google Cloud, as well as orchestration tools like Kubernetes, ensuring comprehensive insights across various environments.
Pros and Cons
Pros:
- Extensive set of integrations with major cloud platforms and orchestration tools
- Comprehensive dashboard offers a unified view of the entire software stack.
- Real-time infrastructure monitoring provides immediate insights.
Cons:
- Some users might prefer specialized tools for specific infrastructure components
- The platform's broad range of tools might be overwhelming for new users.
- The lack of transparent pricing could deter some users.

Datadog is a cloud-based monitoring and analytics platform that provides deep insights into the performance of applications. It consolidates metrics, traces, and logs into a unified platform, making it especially potent for application performance monitoring, aligning with its strength in gauging metrics.
Why I Picked Datadog: When determining the best tools for monitoring, Datadog emerged prominently in my analysis. I judged its ability to offer granular, real-time insights into applications as a primary differentiator. Based on the depth and breadth of its capabilities, I found it best suited for application performance metrics.
Standout Features & Integrations:
Datadog is renowned for its APM (Application Performance Monitoring) which offers detailed performance insights and root cause analysis. Its distributed tracing and real-time analytics equip teams to understand bottlenecks in the application workflow. Complementing its core functionality, Datadog integrates with a plethora of services, including AWS, Azure, and Google Cloud, and offers a rich set of API integrations.
Pros and Cons
Pros:
- Customizable dashboards tailored to unique monitoring needs
- Broad range of integrations with cloud providers and other services
- Robust APM with insightful data visualization
Cons:
- Some users report occasional delays in metric updates
- Steeper learning curve for full utilization of its features
- Might be pricey for smaller teams or projects
Autres outils de surveillance des systèmes
Voici quelques autres options d’outils de surveillance des systèmes qui n’ont pas été retenues dans ma liste principale, mais qui méritent néanmoins votre attention :
- Lakeside
For digital experience analytics
- LibreNMS
For open-source network monitoring
- Icinga
Open-source solution
- AppDynamics
Good for in-depth application performance monitoring
- Observium
Good for detailed network health insights
- Munin
Good for tracking system resources over time
- Cacti
Good for visualizing network performance metrics
- OpenNMS
Good for scalable enterprise-grade network management
- Sysdig
Good for container and microservices monitoring
- Ntop
Good for network traffic analysis and visualization


Critères de sélection des outils de surveillance des systèmes
Pour sélectionner les meilleurs outils de surveillance des systèmes figurant dans cette liste, j'ai pris en compte les besoins courants et les points faibles des acheteurs, tels que le suivi des performances en temps réel et les capacités d'intégration. J'ai également utilisé le cadre suivant pour que mon évaluation reste structurée et impartiale :
Fonctionnalité principale (25% du score total)
Pour être sélectionnées dans cette liste, les solutions devaient répondre à ces cas d'usages courants :
- Surveiller les performances du système
- Alerter en cas de problème système
- Suivre l'utilisation des ressources
- Fournir des données en temps réel
- Générer des rapports de performance
Fonctionnalités complémentaires marquantes (25% du score total)
Pour affiner la sélection, j'ai aussi recherché des fonctionnalités uniques, telles que :
- Analyses prédictives
- Tableaux de bord personnalisables
- Analyses alimentées par l'IA
- Support multi-cloud
- Réaction automatisée aux incidents
Facilité d’utilisation (10% du score total)
Pour évaluer l’ergonomie de chaque système, j’ai tenu compte des éléments suivants :
- Interface utilisateur intuitive
- Navigation facile
- Options de personnalisation
- Courbe d'apprentissage
- Fonctionnalités d’accessibilité
Onboarding (10% du score total)
Pour évaluer l’expérience d’intégration de chaque plateforme, j’ai pris en compte les éléments suivants :
- Disponibilité de vidéos de formation
- Visites interactives du produit
- Accès à des modèles
- Chatbots d’assistance
- Webinaires en direct
Support client (10 % du score total)
Pour évaluer les services de support client de chaque fournisseur de logiciel, j'ai pris en compte les éléments suivants :
- Disponibilité 24/7
- Délai de réponse
- Canaux de support
- Accès à la base de connaissances
- Assistance personnalisée
Rapport qualité/prix (10 % du score total)
Pour évaluer le rapport qualité/prix de chaque plateforme, j’ai considéré les éléments suivants :
- Tarification concurrentielle
- Rapport fonctionnalités/prix
- Options de licence
- Disponibilité d’essai gratuit
- Réductions ou offres
Avis clients (10 % du score total)
Pour évaluer la satisfaction globale des clients, voici ce que j'ai pris en compte lors de la lecture des avis :
- Notes de satisfaction des utilisateurs
- Retours sur la performance
- Commentaires sur la facilité d’utilisation
- Expérience du support
- Perception de la valeur
Comment choisir un outil de supervision système
Il est facile de se perdre dans des listes de fonctionnalités interminables et des structures tarifaires complexes. Pour vous aider à rester concentré pendant votre processus de sélection logiciel, voici une liste de critères à garder en tête :
| Critère | À considérer |
|---|---|
| Scalabilité | L’outil peut-il évoluer avec votre entreprise ? Privilégiez les solutions capables de gérer une augmentation des données et utilisateurs sans baisse de performance. Pensez à vos besoins futurs. |
| Intégrations | Fonctionne-t-il avec votre pile technologique actuelle ? Vérifiez la compatibilité avec vos logiciels existants pour assurer un flux de données fluide et éviter les systèmes isolés. |
| Personnalisation | Pouvez-vous l’adapter à votre méthode de travail ? Assurez-vous que l’outil autorise les modifications nécessaires à vos processus, afin d’éviter de devoir adapter votre activité à un outil rigide. |
| Facilité d’utilisation | L’interface est-elle intuitive pour votre équipe ? Un outil complexe peut nuire à l’efficacité. Privilégiez un design simple pour minimiser le temps de formation. |
| Mise en œuvre et onboarding | Combien de temps pour être opérationnel ? Évaluez le temps et les ressources nécessaires au déploiement, y compris pour la formation et le support pendant la transition. |
| Coût | Les prix sont-ils transparents et dans votre budget ? Prenez en compte les coûts initiaux et récurrents. Attention aux frais cachés pouvant alourdir la facture. |
| Sécurité | Protégez-vous vos données ? L’outil doit être conforme aux normes de sécurité et offrir chiffrement et contrôles d’accès afin de sécuriser les informations sensibles. |
Qu’est-ce qu’un outil de supervision système ?
Les outils de supervision système sont des solutions logicielles qui surveillent et gèrent les performances ainsi que la santé des systèmes informatiques. Ces outils sont généralement utilisés par les administrateurs IT, les ingénieurs réseau et les analystes système pour assurer le bon fonctionnement et l’efficacité des systèmes. La supervision en temps réel, l’alerte et les fonctions de reporting permettent d’identifier les problèmes, d’optimiser les ressources et de garantir la disponibilité. Ces outils fournissent des informations essentielles pour maintenir la fiabilité et la sécurité des systèmes, notamment lors de l’utilisation de logiciels de surveillance matériel dédiés.
Fonctionnalités
Lorsque vous choisissez un outil de supervision système, gardez un œil sur les fonctionnalités clés suivantes :
- Surveillance en temps réel : Suit en continu les performances du système afin d’identifier et de résoudre rapidement les problèmes dès qu’ils surviennent.
- Alerte : Envoie des notifications aux utilisateurs lorsque certains seuils sont dépassés, permettant ainsi de réagir rapidement aux problèmes potentiels.
- Rapport : Génère des rapports de performance détaillés qui aident à analyser les tendances et à prendre des décisions éclairées.
- Capacités d’intégration : Se connecte aux logiciels et systèmes existants pour assurer un flux de données sans rupture et une surveillance complète.
- Tableaux de bord personnalisables : Permettent aux utilisateurs de personnaliser l’interface pour afficher les données les plus pertinentes selon leurs besoins spécifiques.
- Analyses prédictives : Utilise les données historiques pour prévoir d’éventuels problèmes à venir, aidant à prévenir les interruptions avant qu’elles ne se produisent.
- Garanties de sécurité : Propose des fonctionnalités telles que le chiffrement et des contrôles d’accès pour protéger les données sensibles du système.
- Scalabilité : S’adapte à la croissance des données et des demandes des utilisateurs sans compromettre les performances.
- Interface conviviale : Garantit une utilisation facile, réduisant la courbe d’apprentissage et limitant le besoin de formations approfondies.
- Réponses automatisées aux incidents : Fournit des outils pour résoudre automatiquement les problèmes courants, réduisant ainsi la nécessité d’interventions manuelles.
Avantages
L’implémentation d’outils de surveillance des systèmes, y compris les alternatives modernes à Nagios, offre de nombreux avantages à votre équipe et à votre entreprise. Voici quelques bénéfices auxquels vous pouvez vous attendre :
- Meilleure disponibilité : Le suivi en temps réel et les alertes vous aident à résoudre rapidement les problèmes, réduisant les interruptions et assurant le bon fonctionnement des systèmes.
- Sécurité renforcée : Les garanties de sécurité telles que le chiffrement et les contrôles d’accès protègent les données sensibles, limitant les risques de violation.
- Prise de décision éclairée : Des rapports détaillés et des analyses prédictives offrent des informations qui guident l’allocation des ressources et la planification future.
- Efficacité accrue : L’automatisation de la réponse aux incidents réduit la charge de travail manuelle, permettant à votre équipe de se concentrer sur des tâches plus stratégiques.
- Meilleure gestion des ressources : Le suivi de l’utilisation des ressources contribue à optimiser les performances du système et à éviter les dépenses inutiles.
- Soutien à la scalabilité : La capacité à gérer l’augmentation des besoins garantit que vos systèmes peuvent évoluer avec votre entreprise sans perdre en performance.
- Satisfaction des utilisateurs : Une interface conviviale facilite l’adoption et l’utilisation efficace de l’outil par votre équipe, réduisant ainsi la frustration.
Coûts et tarification
Le choix d’outils de surveillance des systèmes suppose de comprendre les différents modèles et plans tarifaires disponibles. Les coûts varient en fonction des fonctionnalités, de la taille de l’équipe, des modules complémentaires et d’autres facteurs. Le tableau ci-dessous résume les formules courantes, leurs prix moyens et les fonctionnalités typiques proposées par les solutions de surveillance des systèmes :
Tableau comparatif des formules pour les outils de surveillance des systèmes
| Type d’offre | Prix moyen | Fonctionnalités courantes |
|---|---|---|
| Offre gratuite | $0 | Surveillance de base, alertes limitées et support communautaire. |
| Offre personnelle | $5-$15/user/month | Surveillance en temps réel, rapports de base et notifications par email. |
| Offre professionnelle | $20-$50/user/month | Rapports avancés, intégrations et tableaux de bord personnalisables. |
| Offre entreprise | $60-$100/user/month | Suite analytique complète, analyses prédictives et support client dédié. |
FAQ sur les outils de surveillance système
Voici quelques réponses aux questions courantes sur les outils de surveillance système :
Les outils de surveillance système peuvent-ils s'intégrer aux systèmes de gestion de tickets ?
Oui, de nombreux outils se connectent à des plateformes de gestion de tickets comme Jira ou ServiceNow. Cela permet aux alertes de générer automatiquement des tickets, afin que votre équipe ne rate aucune information. Cela aide à garder vos workflows organisés et à maintenir le suivi de la résolution des incidents. L’intégration se fait généralement à l’aide de webhooks ou de plugins natifs.
Quels types d'alertes peut-on configurer dans les outils de surveillance système ?
Vous pouvez configurer des alertes sur des seuils, des anomalies ou des événements spécifiques tels que des interruptions de service. Certains outils prennent en charge des alertes personnalisées sur les messages de logs ou les échecs de vérification. Vous décidez comment les alertes sont déclenchées : par valeur, plage temporelle ou tendance. La notification peut se faire par e-mail, SMS, Slack ou d’autres canaux.
Les outils de surveillance système peuvent-ils suivre à la fois les serveurs et les applications ?
Oui, beaucoup d’outils suivent les métriques matérielles et surveillent également la performance au niveau applicatif. Cela inclut la disponibilité, le temps de réponse et le comportement des utilisateurs pour les applications. Vous obtenez ainsi une visibilité sur l’impact de la santé des serveurs sur la performance applicative. Certains outils proposent des modules séparés pour l’infrastructure et la surveillance applicative.
Comment les outils de surveillance système prennent-ils en charge les environnements multi-cloud ?
La plupart des outils permettent de se connecter à AWS, Azure et Google Cloud via des API ou des agents. Ils collectent des données sur ces différentes plateformes et les présentent dans un tableau de bord unique. Cela offre à votre équipe une vue centralisée sur la performance, même si les systèmes tournent sur différents clouds. Cela réduit le besoin de jongler avec plusieurs outils de fournisseurs.
Et ensuite :
Si vous êtes en train de rechercher des outils de surveillance système, contactez un conseiller SoftwareSelect pour des recommandations gratuites.
Vous remplissez un formulaire puis discutez rapidement pour préciser vos besoins. Ensuite, vous recevez une sélection de logiciels à examiner. Ils vous accompagnent même tout au long du processus d'achat, y compris lors de la négociation des prix.