Los 10 Mejores Herramientas de Monitorización de Sitios Web de 2026

Mejor Lista Corta de Herramientas de Monitorización de Sitios Web


En el acelerado mundo de la tecnología, mantener tu sitio web en funcionamiento es crucial. El tiempo de inactividad puede costarte no solo dinero, sino también tu reputación. Como experto en tecnología, conoces la frustración de las caídas inesperadas o los tiempos de carga lentos. Es aquí donde entran en juego las herramientas de monitorización de sitios web.
Estas herramientas te ayudan a vigilar el rendimiento de tu sitio, asegurando que todo funcione sin problemas. En mi experiencia, contar con la herramienta adecuada puede ahorrarle a tu equipo tiempo y dolores de cabeza.
En este artículo, compartiré mis mejores opciones de herramientas para monitorización de sitios web. Obtendrás una reseña imparcial y bien investigada para ayudarte a encontrar la que mejor se adapte a tus necesidades. Vamos a sumergirnos para asegurar que tu sitio se mantenga en óptimas condiciones.
Table of Contents
- Mejores herramientas seleccionadas
- Por qué confiar en nosotros
- Comparar especificaciones
- Reseñas
- Otras herramientas de monitorización de sitios web
- Reseñas relacionadas
- Criterios de selección
- Cómo elegir
- ¿Qué es una herramienta de monitorización de sitios web?
- Características
- Beneficios
- Costos y precios
- Preguntas frecuentes
Por qué confiar en nuestras reseñas de software
Llevamos probando y revisando software desde 2023. Como líderes tecnológicos, sabemos lo crítico y difícil que es tomar la decisión correcta al seleccionar software.
Invertimos en una investigación profunda para ayudar a nuestra audiencia a tomar mejores decisiones de compra de software. Hemos probado más de 2,000 herramientas para diferentes casos de uso tecnológicos y escrito más de 1,000 reseñas de software exhaustivas. Descubre cómo mantenemos la transparencia y nuestra metodología de revisión de software.
Resumen de las Mejores Herramientas de Monitorización de Sitios Web
Esta tabla comparativa resume detalles de precios de mis principales selecciones de herramientas de monitorización de sitios web para ayudarte a encontrar la mejor para tu presupuesto y necesidades empresariales.
| Tool | Best For | Trial Info | Price | ||
|---|---|---|---|---|---|
| 1 | Mejor para análisis impulsados por IA | Prueba gratuita disponible | Desde $25/usuario/mes (facturado anualmente) | Website | |
| 2 | Ideal para seguimiento de errores web en tiempo real | Plan gratuito + prueba gratis + demo gratis disponible | Desde $26/mes (facturado anualmente) | Website | |
| 3 | Mejor para paneles de monitoreo en tiempo real | Prueba gratuita de 14 días | Desde $15/usuario/mes (facturado anualmente) | Website | |
| 4 | Mejor para el monitoreo combinado de aplicaciones y sitios web | Prueba gratuita de 30 días + demostración gratuita + plan gratuito disponible | Desde $945 por 25 monitores (facturado anualmente) | Website | |
| 5 | Ideal para alcance global con más de 110 ubicaciones | Prueba gratuita de 30 días + demo gratuita disponible | Desde $9/usuario/mes (facturado anualmente) | Website | |
| 6 | Ideal para monitoreo SSL | Plan gratuito + demostración gratuita disponible | Desde $8/10 monitores/mes (facturado anualmente) | Website | |
| 7 | Mejor para la supervisión de infraestructuras híbridas | Prueba gratuita de 15 días | Precios a consultar | Website | |
| 8 | Ideal para datos en tiempo real sobre la interacción del usuario | Plan gratuito disponible | Desde $49/usuario/mes | Website | |
| 9 | La mejor opción para obtener información real sobre la experiencia del usuario | Prueba gratuita de 14 días + demo gratis disponible | Desde $8/usuario/mes (facturación anual) | Website | |
| 10 | Mejor para monitoreo de aplicaciones web | Prueba gratuita de 30 días + demostración gratis disponible | Desde $15/usuario/mes (facturación anual) | Website |
-

TestDevLab
Visit Website -
Site24x7
Visit WebsiteThis is an aggregated rating for this tool including ratings from Crozdesk users and ratings from other sites.4.7 -
GitHub Actions
Visit WebsiteThis is an aggregated rating for this tool including ratings from Crozdesk users and ratings from other sites.4.8


Reseñas de las Mejores Herramientas de Monitorización de Sitios Web
A continuación tienes mis resúmenes detallados de la mejor herramienta de monitorización de sitios web que ha entrado en mi lista corta. Mis reseñas ofrecen una visión detallada de las características clave, pros y contras, integraciones y casos de uso ideales de cada herramienta para ayudarte a encontrar la mejor para ti.

Dynatrace es una plataforma de inteligencia de software que ofrece supervisión del rendimiento de aplicaciones, monitoreo de la infraestructura en la nube e información sobre la experiencia digital. Al aprovechar el poder de la IA, proporciona análisis en tiempo real para garantizar la salud óptima del software y la infraestructura, lo cual es fundamental para las organizaciones que buscan conocimientos impulsados por IA.
Por qué elegí Dynatrace: En mi proceso de selección de herramientas de inteligencia de software, Dynatrace destacó notablemente. Su ventaja distintiva reside en su análisis impulsado por IA, que encontré más avanzado que el de muchas otras plataformas.
Por sus capacidades, es evidente que Dynatrace es la mejor opción para empresas que necesitan análisis basados en IA para mejorar el rendimiento de su software e infraestructura.
Características destacadas e integraciones:
El motor de IA de Dynatrace descubre y analiza automáticamente las dependencias de las aplicaciones, optimizando el rendimiento con una intervención manual mínima. El monitoreo de experiencia digital de la plataforma captura las experiencias de los usuarios a través de diversos canales, brindando una visión holística del rendimiento.
En cuanto a integraciones, Dynatrace es compatible con proveedores de nube populares como AWS, Azure y Google Cloud, y se integra fácilmente con herramientas CI/CD como Jenkins.
Pros and Cons
Pros:
- Análisis avanzado con IA para descubrimiento y resolución automática de problemas
- Supervisión integral de aplicaciones, nube y canales digitales
- Integraciones versátiles tanto con proveedores de nube como con herramientas CI/CD
Cons:
- Puede requerir una curva de aprendizaje pronunciada para nuevos usuarios
- El precio puede ser elevado para organizaciones pequeñas
- Las configuraciones complejas pueden requerir experiencia especializada
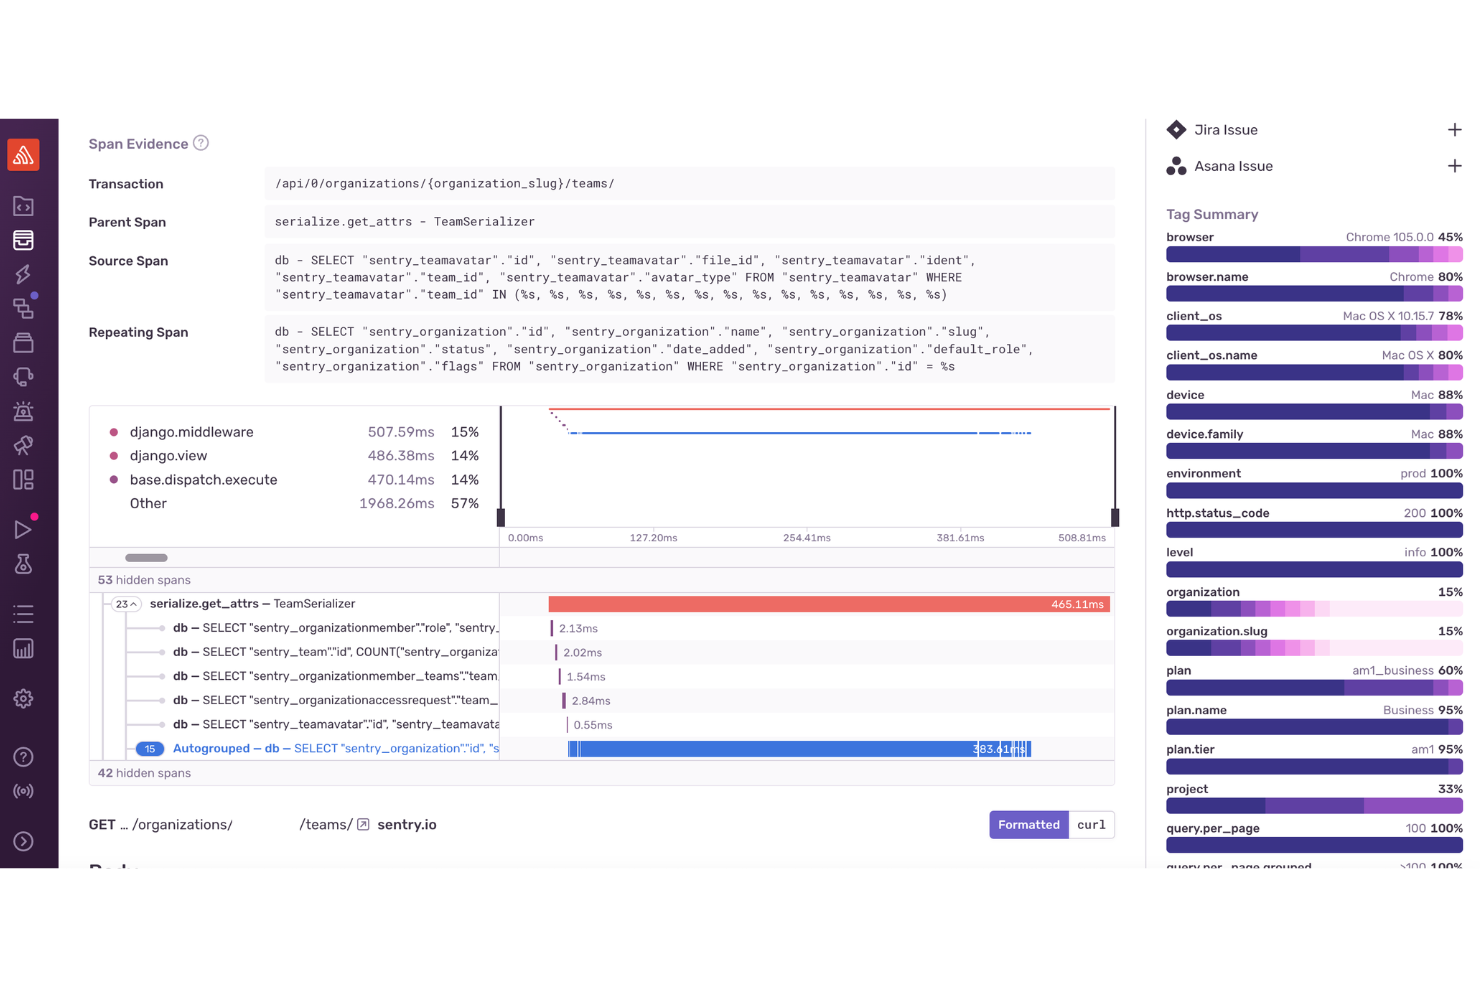
Sentry ofrece una solución integral para empresas que buscan mejorar sus capacidades de monitoreo web. Diseñado para ayudar a desarrolladores y equipos de software, Sentry proporciona herramientas que permiten ver los errores con claridad y resolverlos más rápido, lo que lo convierte en una opción atractiva para diversas industrias, incluyendo el desarrollo web y el comercio electrónico. Con funciones como seguimiento de errores, monitoreo de tiempo de actividad y reproducción de sesiones, Sentry te ayuda a mantener un rendimiento óptimo de las aplicaciones y una excelente experiencia de usuario, abordando desafíos comunes como caídas inesperadas y cuellos de botella en el rendimiento.
Por qué elegí Sentry
Elegí Sentry por su enfoque único en brindar información detallada sobre el rendimiento de aplicaciones y seguimiento de errores. Una característica destacada es su monitoreo de errores en tiempo real, que captura los errores a medida que ocurren, permitiéndote diagnosticarlos y resolverlos rápidamente. Otra característica clave es el monitoreo de tiempo de actividad, que asegura que tu sitio web esté siempre accesible notificándote ante cualquier caída. Además, la funcionalidad de reproducción de sesiones de Sentry ofrece una representación visual de las interacciones de los usuarios, ayudándote a comprender y resolver los problemas de experiencia de usuario de manera más eficiente.
Características clave de Sentry
Además del seguimiento de errores web en tiempo real, Sentry ofrece:
- Seguimiento: Brinda información sobre llamadas de API y consultas a bases de datos, ayudándote a identificar cuellos de botella en el rendimiento de tu aplicación.
- Análisis automático de la causa raíz: Utiliza IA para identificar las causas subyacentes de los errores, optimizando el proceso de depuración.
- Depuración impulsada por IA: Ofrece revisiones de código automatizadas y sugerencias, reduciendo el tiempo necesario para resolver problemas complejos.
- Integración con herramientas de desarrollo: Se conecta de manera fluida con plataformas como GitHub y Slack, garantizando un flujo de trabajo ágil para tu equipo de desarrollo.
Integraciones de Sentry
Las integraciones incluyen GitHub, Slack, Jira, Bitbucket, GitLab, Trello, Azure DevOps, PagerDuty, AWS Lambda y Microsoft Teams.
Pros and Cons
Pros:
- Ofrece monitoreo de errores en tiempo real en aplicaciones web, móviles y backend
- El seguimiento distribuido proporciona información sobre el rendimiento a nivel de transacciones
- La agrupación avanzada de errores ayuda a priorizar problemas para una rápida resolución
Cons:
- No todas las integraciones están disponibles de forma nativa, algunas dependen de APIs de terceros
- Alertas e información de aplicaciones limitadas en planes de nivel inferior
New Product Updates from Sentry

Sentry Adds Heatmaps to Application Metrics
Sentry introduced heatmaps for Application Metrics to visualize metric value distributions over time, helping teams spot patterns like latency bursts and use heatmaps in Custom Dashboards. For more information, visit Sentry's official site.
 .
.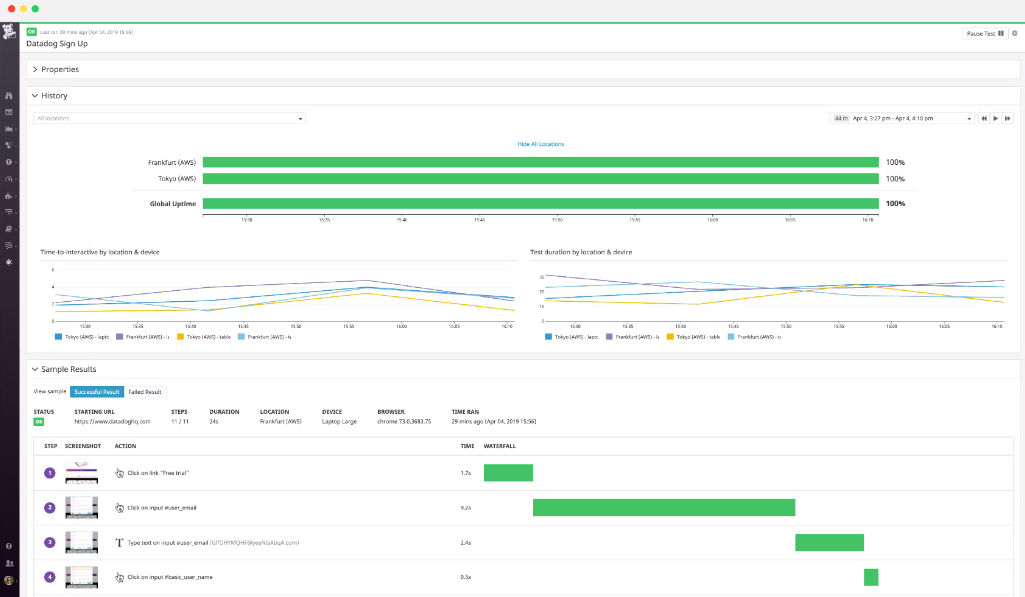
Datadog es una plataforma de monitoreo y análisis basada en la nube que ayuda a las empresas a visualizar el rendimiento de sus aplicaciones, herramientas y servicios en tiempo real. Su fortaleza radica en la creación de paneles completos y en tiempo real que agregan datos de múltiples fuentes, lo que se alinea con la necesidad de obtener información inmediata y respuestas proactivas.
Por qué elegí Datadog: En el proceso de selección de herramientas para esta lista, Datadog surgió como un candidato principal debido a sus potentes capacidades de paneles. Tras comparar varias plataformas, descubrí que la capacidad de Datadog para proporcionar información inmediata mediante visualizaciones dinámicas lo hacía destacar.
Determiné que, para organizaciones que requieren paneles de monitoreo en tiempo real, Datadog sobresale.
Características destacadas e integraciones:
Datadog cuenta con un sistema avanzado de detección de anomalías que identifica posibles problemas antes de que se conviertan en inconvenientes importantes. Además, ofrece trazabilidad distribuida que ayuda a identificar cuellos de botella de rendimiento en arquitecturas de microservicios.
En cuanto a integraciones, Datadog se conecta con una amplia variedad de plataformas, incluyendo AWS, Docker, Slack y muchas más, consolidando datos para un análisis enriquecido.
Pros and Cons
Pros:
- Capacidades extensas de paneles en tiempo real
- Ofrece detección avanzada de anomalías
- Amplia gama de integraciones con plataformas populares
Cons:
- Curva de aprendizaje más pronunciada para principiantes
- El precio puede aumentar considerablemente con funciones adicionales
- Límites de retención de datos en el plan básico
Mejor para el monitoreo combinado de aplicaciones y sitios web
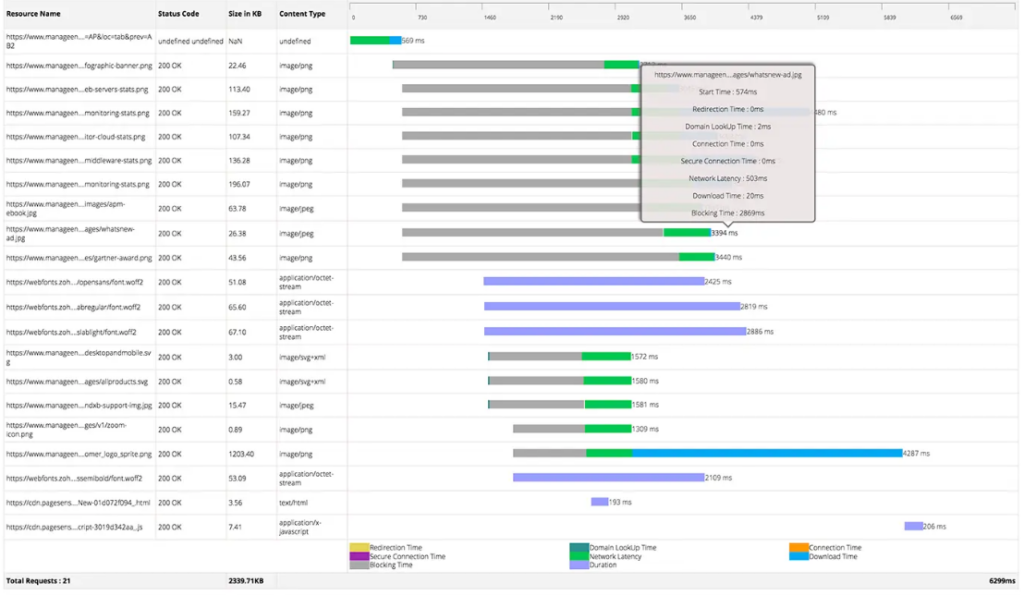
ManageEngine Applications Manager ofrece un enfoque integrado para el monitoreo tanto de aplicaciones como de sitios web. Al garantizar un rendimiento constante de estos dos componentes críticos, ayuda a las organizaciones a mantener una experiencia óptima para el usuario y una eficiencia operativa.
Por qué elegí ManageEngine Applications Manager: Seleccioné ManageEngine Applications Manager por su enfoque integral en el monitoreo del rendimiento. Tras evaluar y comparar varias herramientas, opino que la capacidad de ManageEngine para monitorear simultáneamente tanto aplicaciones como sitios web le da una clara ventaja.
Esta capacidad de monitoreo dual lo posiciona como una solución ideal para organizaciones que necesitan asegurar que tanto sus activos web como de aplicaciones funcionen en armonía.
Características destacadas e integraciones:
ManageEngine Applications Manager se destaca en el monitoreo de diversas aplicaciones, que van desde aplicaciones web y bases de datos hasta almacenes de big data. Su función de análisis de causa raíz ayuda a identificar rápidamente los problemas, reduciendo el tiempo de inactividad. Además, ofrece integraciones clave con plataformas como AWS, Microsoft Azure y Oracle Cloud, ampliando aún más su espectro de monitoreo.
Pros and Cons
Pros:
- Monitoreo dual de aplicaciones y sitios web
- Soporte integral para una variedad de tipos de aplicaciones
- Útil función de análisis de causa raíz
Cons:
- Puede ser demasiado exhaustivo para pequeñas empresas
- La licencia puede volverse compleja a medida que escalas
- Requiere configuración e instalación inicial
New Product Updates from ManageEngine Applications Manager
Oracle Cloud Application Monitoring Now Available in ManageEngine Applications Manager
ManageEngine Applications Manager introduces Oracle Cloud Application Monitoring, Oracle Cloud Function Monitoring, and Oracle Cloud NAT Gateway Monitoring. These new capabilities help teams monitor Oracle Cloud applications, serverless workloads, and network resources from a single platform. For more information, visit ManageEngine Applications Manager's official site.
 .
.
Site24x7 ofrece una monitorización integral de aplicaciones web desde la perspectiva del usuario, garantizando el rendimiento del sitio web desde múltiples ubicaciones geográficas. Su característica más destacada es su presencia en más de 110 ubicaciones globales, lo que permite a las empresas supervisar el rendimiento y la disponibilidad de su sitio web prácticamente desde cualquier parte del mundo.
Por qué elegí Site24x7: Al elegir herramientas, la amplia presencia global de Site24x7 se evidenció como un punto de venta único. Tras evaluar y comparar varias soluciones de monitorización, llegué a la conclusión de que el alcance expansivo de Site24x7 ofrece una ventaja inigualable, especialmente para empresas que buscan llegar a una audiencia internacional. Para las compañías que valoran la cobertura global, Site24x7 es claramente la opción óptima.
Funciones destacadas e integraciones:
Site24x7 no solo monitoriza sitios web, sino también aplicaciones, servidores e infraestructura de red, asegurando una visión global del rendimiento. Real User Monitoring (RUM) y Application Performance Monitoring (APM) son algunas de sus funciones clave, brindando información sobre la experiencia real de los usuarios y el rendimiento del backend de la aplicación.
En cuanto a integraciones, Site24x7 es compatible con plataformas populares como AWS, Microsoft Azure y Google Cloud, permitiendo una visión completa del rendimiento de los recursos en la nube.
Pros and Cons
Pros:
- Amplia presencia de monitorización global con más de 110 ubicaciones
- Conjunto integral de herramientas incluyendo RUM y APM
- Amplia integración con plataformas en la nube
Cons:
- La interfaz puede ser compleja para principiantes
- Limitaciones en el número de monitores en el plan básico
- Las funciones adicionales pueden tener costes extra
New Product Updates from Site24x7

Site24x7 Adds Discovery Issues for AWS Monitoring
Site24x7 added Discovery Issues for AWS monitoring, helping teams identify why resources are not being discovered across services and regions. The feature surfaces permission gaps, policy restrictions, and blocked API actions to support faster troubleshooting. For more information, visit Site24x7’s official site.
 .
.
Para equipos que buscan una herramienta confiable de monitoreo de sitios web, UptimeRobot ofrece una solución práctica que permite monitoreo de SSL junto con verificaciones de disponibilidad. Es ideal para equipos como desarrolladores, DevOps y especialistas en marketing que necesitan visibilidad constante sobre la disponibilidad y el estado de seguridad del sitio. Al ayudar a detectar problemas como expiración de certificados, caídas y tiempos de respuesta lentos, UptimeRobot contribuye a mantener una presencia en línea estable y de confianza.
Por qué elegí UptimeRobot
Elegí UptimeRobot por su monitoreo de SSL, que ayuda a los equipos a anticiparse a los problemas de certificados antes de que afecten el acceso al sitio. Te alerta cuando los certificados están cerca de vencer, lo que reduce el riesgo de advertencias de seguridad inesperadas o caídas. UptimeRobot también admite verificaciones desde múltiples ubicaciones y alertas en tiempo real a través de canales como correo electrónico y Slack, facilitando la identificación de problemas de disponibilidad o rendimiento en distintas regiones y permitiendo una respuesta rápida.
Funciones clave de UptimeRobot
Además del monitoreo SSL, UptimeRobot ofrece:
- Monitoreo de tareas programadas (Cron Job Monitoring): Esta función te permite rastrear tareas programadas y asegurarte de que se ejecutan en el momento correcto.
- Páginas de estado personalizables: Puedes crear y compartir páginas de estado que reflejen tu marca y mantengan informados a los interesados durante interrupciones.
- Monitoreo desde múltiples ubicaciones: Esta función ayuda a detectar problemas específicos de ubicación comprobando el rendimiento desde diferentes puntos del mundo.
- Configuración avanzada de notificaciones: Puedes personalizar las alertas según la gravedad de la interrupción y configurar ventanas de mantenimiento para evitar alertas innecesarias.
Integraciones de UptimeRobot
UptimeRobot ofrece diversas integraciones para mejorar tu experiencia de monitoreo, incluyendo correo electrónico, Slack, PagerDuty, Microsoft Teams, Telegram, Discord, Webhooks, Zapier y soporte para API para integraciones personalizadas.
Pros and Cons
Pros:
- Alertas de monitoreo SSL antes de que los certificados expiren
- Alertas en tiempo real por correo electrónico, Slack y otros canales
- Plan gratuito generoso para necesidades de monitoreo básicas
Cons:
- Diagnósticos de rendimiento limitados en comparación con herramientas avanzadas
- Los planes de nivel bajo tienen intervalos de monitoreo restringidos
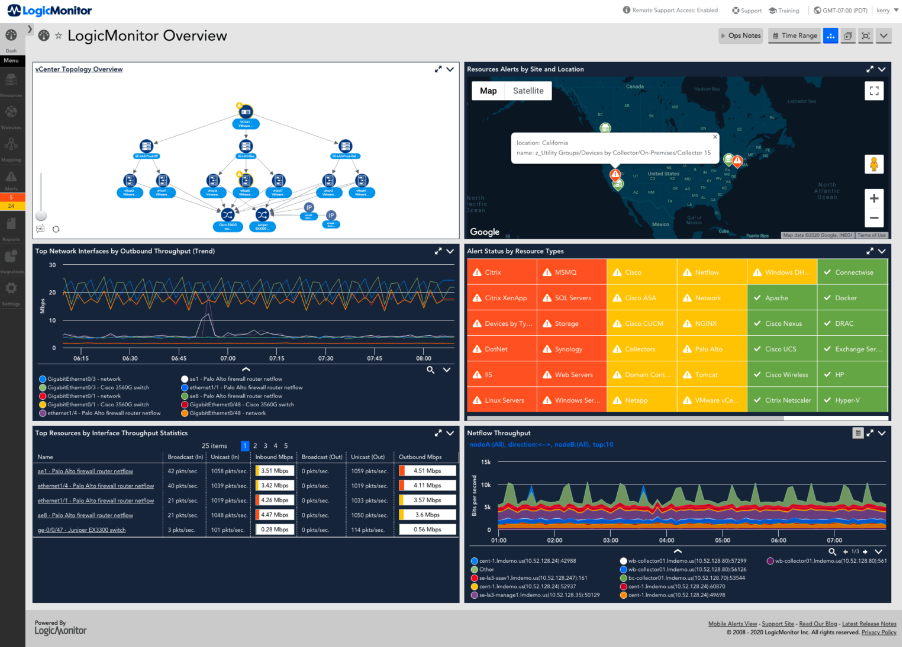
LogicMonitor presenta una plataforma basada en la nube diseñada para automatizar la supervisión de la infraestructura. Atendiendo tanto a entornos locales como en la nube, reconoce la creciente necesidad de que las empresas tengan una visión integral de todo su panorama de TI.
Por qué elegí LogicMonitor: Al determinar qué herramienta incluir para la supervisión de la infraestructura, LogicMonitor fue una elección destacada debido a su amplia capacidad para manejar tanto entornos de TI tradicionales como modernos. Al comparar numerosas soluciones, consideré que la habilidad de LogicMonitor para ofrecer visibilidad tanto en infraestructuras locales como en la nube era especialmente destacable.
Esta capacidad intrínseca lo hace ideal para empresas que están en transición o equilibran configuraciones entre la nube y entornos locales.
Características principales e integraciones:
LogicMonitor se destaca con funciones como el descubrimiento automatizado de dispositivos y la generación dinámica de umbrales, que facilitan la detección proactiva de problemas. Además, cuenta con una biblioteca de más de 2.000 integraciones, lo que garantiza su compatibilidad con una amplia variedad de dispositivos y aplicaciones.
Entre sus integraciones más valoradas se encuentran las de AWS, Azure y VMware, cubriendo tanto entornos en la nube como locales.
Pros and Cons
Pros:
- Permite la supervisión de diversos tipos de infraestructuras
- El descubrimiento automatizado de dispositivos facilita la configuración
- Amplia biblioteca de integraciones
Cons:
- No hay precios fijos disponibles públicamente
- Algunas funciones avanzadas requieren tiempo de aprendizaje
- La configuración inicial puede ser compleja en entornos grandes
Ideal para datos en tiempo real sobre la interacción del usuario
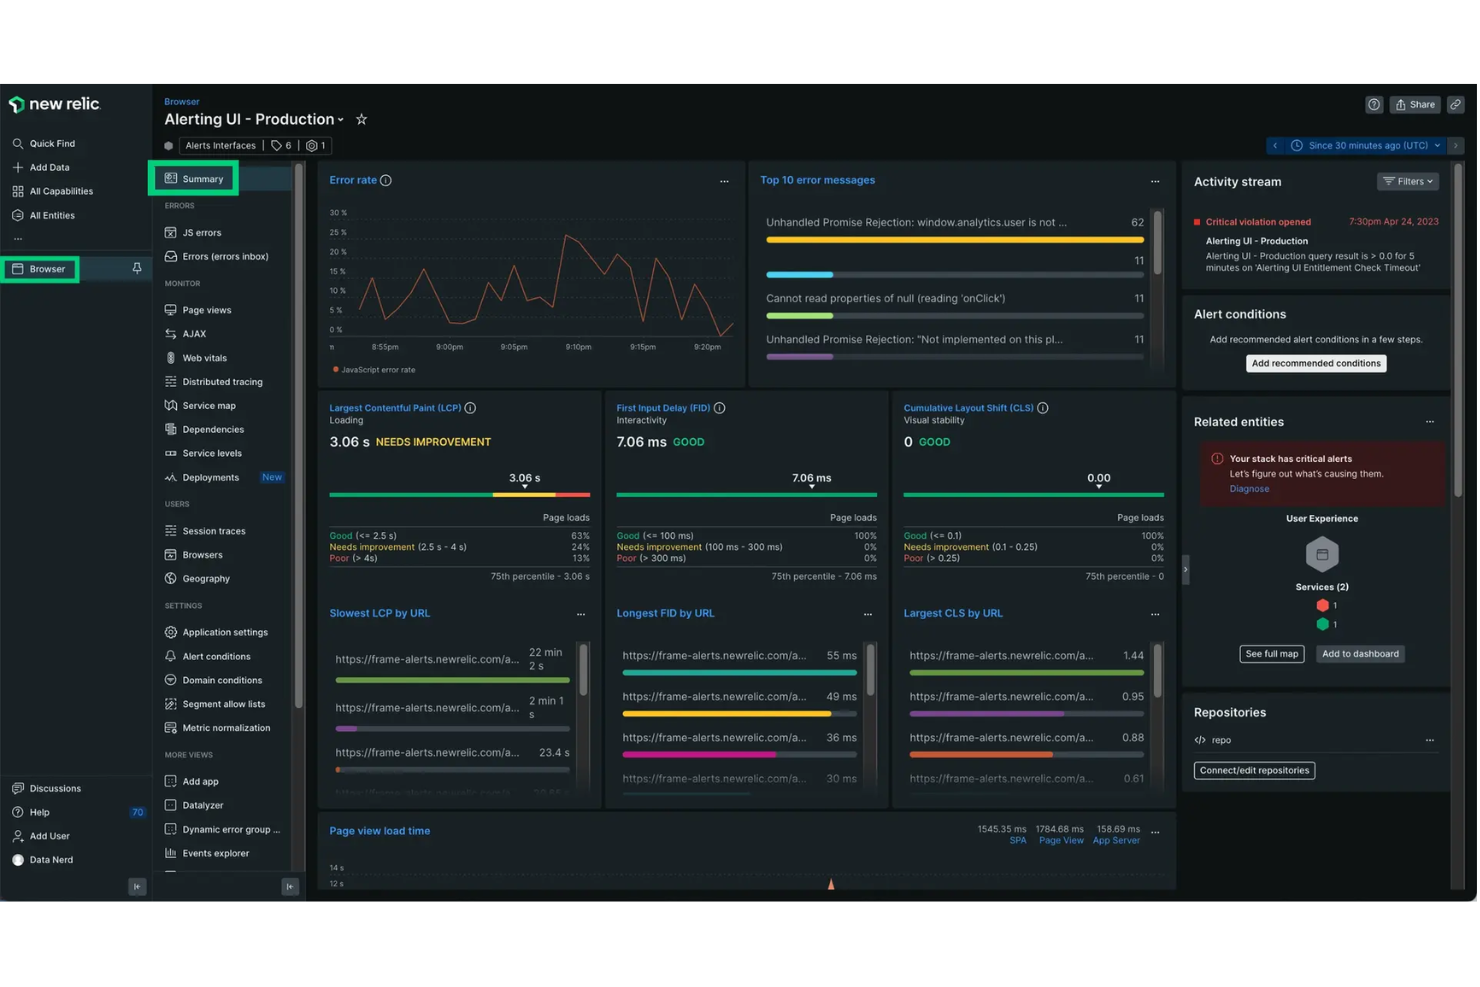
New Relic es una plataforma integral de observabilidad diseñada para ayudarte a monitorizar, depurar y mejorar toda tu pila de software. Al proporcionar información en tiempo real sobre tus aplicaciones e infraestructura, te permite identificar y resolver problemas rápidamente, garantizando un rendimiento óptimo y la satisfacción del usuario.
Por qué elegí New Relic: Me gusta su conjunto de herramientas de monitorización de la experiencia digital, que incluye monitorización real de usuarios en el navegador y herramientas sintéticas. La monitorización real de usuarios en el navegador ofrece información sobre las experiencias reales de tus usuarios al rastrear métricas como los tiempos de carga de las páginas y seguimientos de sesiones. Las herramientas sintéticas te permiten simular interacciones de usuario para identificar proactivamente posibles problemas antes de que afecten a usuarios reales. Juntas, estas herramientas te permiten mantener un alto rendimiento y fiabilidad del sitio web.
Funciones destacadas e integraciones:
Otras funciones incluyen la monitorización de infraestructura, que ofrece visibilidad sobre tus servidores, contenedores y servicios en la nube, ayudándote a mantener la salud y el rendimiento del sistema. La gestión de registros centraliza tus datos de logs, facilitando la búsqueda y el análisis de registros para resolución de problemas y auditoría.
Las integraciones incluyen AWS, Google Cloud Platform, Microsoft Azure, Slack, Atlassian Jira, AWS EventBridge, notificaciones por correo electrónico, notificaciones push móviles, Opsgenie, PagerDuty, ServiceNow y Prometheus.
Pros and Cons
Pros:
- Se integra bien con varias plataformas
- Cuenta con sólidas funciones de alertas
- Ofrece monitoreo e información en tiempo real
Cons:
- Los paneles pueden requerir personalización para casos de uso específicos
- La interfaz de usuario puede ser abrumadora para nuevos usuarios
Raygun
La mejor opción para obtener información real sobre la experiencia del usuario
Raygun ofrece herramientas de inteligencia de software y monitoreo de rendimiento para garantizar que las aplicaciones funcionen al máximo rendimiento. Al centrarse en los datos obtenidos de interacciones reales de los usuarios, Raygun proporciona a los desarrolladores una visión clara de cómo los usuarios experimentan su software.
Por qué elegí Raygun: Al seleccionar herramientas de monitoreo para obtener perspectivas reales de los usuarios, Raygun captó mi atención. Determiné que su enfoque en las interacciones genuinas de los usuarios la distingue del resto. Basándome en su enfoque incomparable para capturar experiencias y comentarios de los usuarios en tiempo real, he llegado a la conclusión de que Raygun es la mejor opción para obtener información auténtica sobre la experiencia del usuario.
Características y integraciones destacadas:
Raygun ofrece Informes de Fallos, que permiten a los desarrolladores diagnosticar y solucionar errores antes de que lleguen a los usuarios. Su función de Monitoreo Real del Usuario brinda información sobre cómo los usuarios realmente experimentan tu software, permitiendo optimizaciones basadas en patrones de uso reales.
En cuanto a las integraciones, Raygun funciona bien con plataformas populares como GitHub, Slack y Jira, lo que agiliza el proceso de desarrollo y monitoreo del software.
Pros and Cons
Pros:
- Informes de Fallos detallados para la gestión proactiva de errores
- El Monitoreo Real de Usuarios proporciona información genuina
- Fuertes integraciones con las principales herramientas de desarrollo
Cons:
- Puede resultar abrumador para equipos pequeños sin personal de TI dedicado
- La interfaz puede ser compleja para los usuarios primerizos
- Algunas funciones podrían ser redundantes para aplicaciones más sencillas

Uptrends es una herramienta especializada enfocada en asegurar la accesibilidad y el rendimiento de aplicaciones web. Esta plataforma mantiene una vigilancia constante sobre la disponibilidad de las aplicaciones web, considerando la velocidad, el tiempo de actividad y la funcionalidad, lo que la convierte en una opción ideal para organizaciones que priorizan la salud de sus activos web.
Por qué elegí Uptrends: Cuando decidí qué herramientas incluir en esta lista, Uptrends llamó mi atención por sus completas capacidades de monitoreo de aplicaciones web. Comparando varias plataformas, Uptrends tiene una ventaja clara, especialmente en sus informes detallados y alertas sobre el estado de las aplicaciones web. Juzgué que Uptrends es la mejor opción para quienes requieren una herramienta diseñada específicamente para monitorear aplicaciones web.
Características destacadas e integraciones:
Uptrends ofrece monitoreo de usuarios reales, brindando información sobre cómo experimentan el sitio los visitantes reales. La herramienta también cuenta con una función de monitoreo sintético multinavegador, que simula la interacción de los visitantes en diferentes navegadores como Chrome.
En cuanto a integraciones, Uptrends puede conectarse con herramientas de comunicación populares como Slack, PagerDuty y Microsoft Teams para notificaciones de alertas inmediatas.
Pros and Cons
Pros:
- Informes detallados de monitoreo de aplicaciones web
- El monitoreo de usuarios reales ofrece información genuina
- Compatibilidad con varios navegadores para monitoreo sintético
Cons:
- La interfaz puede parecer abrumadora para principiantes
- Las funciones avanzadas pueden suponer costes adicionales
- Algunas integraciones pueden requerir configuración manual
Otras Herramientas de Monitorización de Sitios Web
Aquí tienes algunas opciones adicionales de herramientas de monitorización de sitios web que no entraron en mi lista corta, pero que igual valen la pena revisar:
- ThousandEyes
Mejor para monitoreo de rendimiento web integral
- Sematext
La mejor opción para integrar métricas de servidor y sitio web
- Uptime
Ideal para funciones detalladas de generación de informes
- Apica
Ideal para pruebas de rendimiento escalables
- PRTG
Ideal para la monitorización continua de la disponibilidad de sitios web 24/7
- Dotcom Monitor
Ideal para simulaciones de velocidad en condiciones reales


Otras Reseñas de Herramientas de Monitorización
- Herramientas de Monitorización de Infraestructura Cloud
- Herramientas de Monitorización DevOps
- Software de Monitorización de Redes
Criterios de Selección de Herramientas de Monitorización de Sitios Web
Al seleccionar la mejor herramienta de monitorización de sitios web para incluir en esta lista, consideré las necesidades y puntos de dolor más comunes de los compradores, como asegurar la disponibilidad y detectar problemas de rendimiento. También utilicé el siguiente marco para mantener mi evaluación estructurada y justa:
Funcionalidad principal (25% del puntaje total)
Para ser considerado en esta lista, cada solución tenía que cumplir con estos casos de uso habituales:
- Monitorizar el tiempo en línea del sitio web
- Rastrear la velocidad de carga de la página
- Alertar sobre caídas
- Proporcionar análisis de rendimiento
- Soportar múltiples sitios web
Características adicionales destacadas (25% del puntaje total)
Para ayudar a limitar aún más la competencia, también busqué funciones únicas, como:
- Monitorización en tiempo real de usuarios
- Configuración personalizable de alertas
- Información de rendimiento geográfica
- Integración con herramientas de terceros
- Capacidades avanzadas de informes
Usabilidad (10% del puntaje total)
Para conocer la facilidad de uso de cada sistema, consideré lo siguiente:
- Diseño de interfaz intuitivo
- Facilidad de navegación
- Paneles personalizables
- Proceso de configuración fácil de usar
- Visualización clara de datos
Incorporación (10% de la puntuación total)
Para evaluar la experiencia de incorporación en cada plataforma, consideré lo siguiente:
- Disponibilidad de videos de capacitación
- Tours interactivos del producto
- Documentación completa
- Acceso a seminarios web y tutoriales
- Soporte mediante chatbots o ayuda en vivo
Atención al Cliente (10% de la puntuación total)
Para evaluar los servicios de atención al cliente de cada proveedor de software, consideré lo siguiente:
- Disponibilidad de soporte 24/7
- Múltiples canales de soporte
- Capacidad de respuesta del equipo de soporte
- Acceso a una base de conocimientos
- Calidad de las guías de resolución de problemas
Relación Calidad-Precio (10% de la puntuación total)
Para evaluar la relación calidad-precio de cada plataforma, consideré lo siguiente:
- Planes de precios competitivos
- Características incluidas en los paquetes básicos
- Flexibilidad en las opciones de suscripción
- Descuentos por compromisos a largo plazo
- Disponibilidad de prueba gratuita o demo
Opiniones de los Clientes (10% de la puntuación total)
Para obtener una idea de la satisfacción general de los clientes, tuve en cuenta lo siguiente al leer reseñas de usuarios:
- Comentarios de usuarios sobre la fiabilidad
- Opiniones sobre la facilidad de uso
- Satisfacción con el soporte al cliente
- Perspectivas sobre la eficacia de las funciones
- Percepción general del valor
Cómo Elegir una Herramienta de Monitorización de Sitios Web
Es fácil quedar abrumado por largas listas de características y estructuras de precios complejas. Para ayudarte a mantener el enfoque mientras avanzas en tu proceso único de selección de software, aquí tienes una lista de factores a tener en cuenta:
| Factor | Qué considerar |
|---|---|
| Escalabilidad | ¿Puede la herramienta manejar el crecimiento de tu sitio web? Asegúrate de que soporta un aumento de tráfico y necesidades adicionales de monitorización sin costes o complejidad extra. |
| Integraciones | ¿Funciona con tus sistemas existentes? Comprueba la compatibilidad con tu stack tecnológico actual para evitar problemas de integración y trabajo adicional. |
| Personalización | ¿Puedes ajustar las alertas y paneles? Busca herramientas que permitan modificar la configuración para adaptarla al flujo de trabajo y las necesidades de informes de tu equipo. |
| Facilidad de uso | ¿La interfaz es intuitiva? La herramienta debe ser fácil de usar y permitir a tu equipo acceder e interpretar datos rápidamente sin una formación extensa. |
| Implementación e incorporación | ¿Qué tan rápido puedes comenzar? Evalúa el tiempo de configuración, el soporte disponible y recursos como tutoriales o plantillas para facilitar la transición. |
| Costo | ¿Se ajusta a tu presupuesto? Compara los modelos de precios, ten en cuenta costes ocultos y considera el coste a largo plazo frente a los beneficios, incluyendo cualquier oferta de prueba gratuita. |
| Resguardos de seguridad | ¿Cómo protege tus datos? Asegúrate de que cumple con tus estándares de seguridad y que ofrece funciones como cifrado, actualizaciones periódicas y copias de respaldo. |
¿Qué Es una Herramienta de Monitorización de Sitios Web?
Una herramienta de monitorización de sitios web es un software que rastrea y analiza el rendimiento y el uptime de los sitios web. Profesionales de TI, desarrolladores web y administradores de sitios suelen utilizar estas herramientas para garantizar que sus sitios funcionen sin problemas y de forma eficiente. La monitorización del uptime, el análisis de la velocidad de carga y las notificaciones de alertas ayudan a identificar problemas y mantener un rendimiento óptimo. En general, estas herramientas brindan tranquilidad al garantizar que los sitios web funcionen correctamente y de manera fiable.
Características
Al seleccionar una herramienta de monitorización de sitios web, presta atención a las siguientes características clave que funcionan junto con el software de monitorización de hardware:
- Supervisión del tiempo de actividad: Controla la disponibilidad de tu sitio web y te alerta si deja de funcionar, asegurando un tiempo de inactividad mínimo.
- Seguimiento del tiempo de respuesta: Mide la rapidez con la que tu sitio web responde a las solicitudes de los usuarios, ayudándote a mantener una experiencia rápida.
- Notificaciones de alerta: Envía alertas por correo electrónico, SMS u otros canales cuando se detectan problemas, para que puedas actuar rápidamente.
- Informes de rendimiento: Proporciona informes detallados sobre el rendimiento del sitio web, permitiendo tomar decisiones basadas en datos para realizar mejoras.
- Supervisión desde múltiples ubicaciones: Verifica la disponibilidad de tu sitio web desde diferentes ubicaciones geográficas, asegurando la accesibilidad global.
- Tableros personalizables: Permite adaptar las visualizaciones de datos según las necesidades de tu equipo, facilitando la comprensión de la información.
- Análisis avanzados: Ofrece perspectivas más profundas sobre las tendencias de rendimiento, ayudando a identificar y resolver posibles problemas.
- Acceso por API: Integra los datos de supervisión con otros sistemas, permitiendo un entorno tecnológico cohesivo.
- Almacenamiento de datos históricos: Conserva registros de datos de rendimiento pasados, facilitando el análisis y la planificación a largo plazo.
- Supervisión sintética: Simula interacciones de usuarios para detectar posibles problemas antes de que afecten a los usuarios reales.
Beneficios
Implementar una herramienta de monitorización de sitios web aporta varios beneficios para tu equipo y tu negocio. Aquí tienes algunos de los que puedes disfrutar:
- Mejora del tiempo de actividad: Al recibir alertas instantáneas, puedes abordar los problemas rápidamente y mantener tu sitio web en funcionamiento.
- Resolución más rápida de problemas: Con el seguimiento del tiempo de respuesta, puedes identificar ralentizaciones y solucionarlas antes de que afecten a los usuarios.
- Mejor experiencia de usuario: Las herramientas de monitorización aseguran que tu sitio sea rápido y accesible, manteniendo a los visitantes satisfechos.
- Información basada en datos: Los informes de rendimiento y los análisis avanzados proporcionan información valiosa para optimizar tu sitio web.
- Alcance global: La supervisión desde múltiples ubicaciones asegura la disponibilidad de tu sitio en todo el mundo, ampliando tu audiencia.
- Toma de decisiones informada: El almacenamiento de datos históricos te permite analizar tendencias y planificar mejoras basándote en el rendimiento anterior.
- Resolución proactiva de problemas: La supervisión sintética ayuda a identificar posibles problemas antes de que afecten a los usuarios reales, reduciendo futuras interrupciones.
Costos y Precios
Elegir una herramienta de monitorización de sitios web requiere comprender los diferentes modelos y planes de precios disponibles. Los costos varían según las funciones, el tamaño del equipo, complementos y más. La siguiente tabla resume los planes más comunes, sus precios promedios y las características típicas incluidas en las soluciones de monitorización de sitios web:
Tabla Comparativa de Planes para Herramientas de Monitorización de Sitios Web
| Tipo de Plan | Precio Promedio | Características Comunes |
|---|---|---|
| Plan Gratuito | $0 | Supervisión básica del tiempo de actividad, notificaciones de alerta limitadas y almacenamiento de datos restringido. |
| Plan Personal | $5-$25/user/month | Seguimiento del tiempo de actividad y de respuesta, alertas personalizables e informes de rendimiento. |
| Plan Empresarial | $50-$100/user/month | Supervisión desde múltiples ubicaciones, análisis avanzados y acceso por API. |
| Plan Empresa | $200-$500/user/month | Tableros personalizables, supervisión sintética, soporte integral y amplio almacenamiento de datos históricos. |
Preguntas frecuentes sobre la herramienta de monitorización de sitios web
Aquí tienes respuestas a preguntas comunes sobre la herramienta de monitorización de sitios web:
¿Cómo afecta el tiempo de inactividad de un sitio web a mi negocio?
El tiempo de inactividad de un sitio web puede resultar en pérdida de ingresos, daño a la reputación de tu marca y disminución de la satisfacción del cliente. Incluso interrupciones breves pueden frustrar a los usuarios y hacer que busquen alternativas. La monitorización regular te ayuda a abordar los problemas rápidamente y minimizar estos impactos.
¿Cuáles son los códigos de error comunes que debo monitorear?
Algunos códigos de error comunes incluyen 404 (no encontrado), 401 (no autorizado) y 500 (error interno del servidor). Monitorearlos te ayuda a identificar problemas como enlaces rotos, intentos de acceso no autorizado y problemas en el servidor que requieren atención inmediata.
¿Cómo funcionan las notificaciones de alerta?
Las notificaciones de alerta te informan sobre incidencias como caídas del sitio o disminución de rendimiento. Puedes recibir alertas por correo electrónico, SMS u otros métodos. Configurar estas alertas garantiza que sepas de los problemas tan pronto ocurran, permitiendo una solución rápida.
¿Qué es la monitorización del servidor y por qué es importante?
La monitorización del servidor rastrea el rendimiento de los recursos de tu servidor, como CPU, RAM y uso de disco. Te ayuda a detectar y solucionar posibles problemas antes de que afecten el rendimiento del sitio web, asegurando que tu sitio siga siendo accesible y rápido.
¿Cómo puede beneficiar la monitorización SSL a mi sitio web?
La monitorización SSL verifica la validez y la fecha de caducidad de tus certificados SSL. Garantiza conexiones seguras para los usuarios y previene problemas como certificados vencidos, que pueden generar advertencias de confianza y posibles brechas de seguridad de datos.
¿Qué es la función de coincidencia de contenido en la monitorización de sitios web?
La función de coincidencia de contenido verifica tu sitio web en busca de cadenas o contenidos específicos. Es útil para asegurar que la información esencial se muestre correctamente y no haya sido alterada, ayudando a mantener la integridad y confiabilidad de tu sitio.
¿Qué sigue?
Si estás investigando sobre herramientas de monitorización de sitios web, conéctate con un asesor de SoftwareSelect para obtener recomendaciones gratuitas.
Solo tienes que completar un formulario y tener una breve llamada donde conocerán los detalles de tus necesidades. Luego recibirás una lista selecta de software para revisar. Incluso te acompañarán durante todo el proceso de compra, incluyendo negociaciones de precios.