Las 10 mejores herramientas de monitoreo de rendimiento para SaaS

10 Lista de las mejores herramientas de monitoreo de rendimiento


Las herramientas de monitoreo de rendimiento te ayudan a rastrear cómo están funcionando tus sistemas y aplicaciones para que puedas detectar problemas temprano y mantener todo funcionando sin contratiempos.
Muchos equipos buscan estas herramientas cuando se enfrentan a tiempos de carga lentos, rendimiento impredecible o dificultades para encontrar la causa raíz de los problemas. Sin la herramienta adecuada, corres el riesgo de pasar horas persiguiendo alertas poco claras o de no detectar caídas de rendimiento.
He ayudado a equipos a implementar sistemas de monitoreo de rendimiento que realmente proporcionan datos útiles y reducen las suposiciones. Esta guía se basa en esa experiencia para ayudarte a elegir una herramienta que se adapte a tu flujo de trabajo y te ayude a estar al tanto de lo que realmente importa.
Table of Contents
- Mejor software seleccionado
- Por qué confiar en nosotros
- Comparar especificaciones
- Reseñas
- Otras herramientas de monitoreo de rendimiento
- Reseñas relacionadas
- Criterios de selección
- Cómo elegir
- ¿Qué son las herramientas de monitoreo de rendimiento?
- Características
- Beneficios
- Costes y precios
- Preguntas frecuentes
Por qué confiar en nuestras reseñas de software
Llevamos probando y revisando software desde 2023. Como líderes tecnológicos, sabemos lo crítico y difícil que es tomar la decisión correcta al seleccionar software.
Invertimos en una investigación profunda para ayudar a nuestra audiencia a tomar mejores decisiones de compra de software. Hemos probado más de 2,000 herramientas para diferentes casos de uso tecnológicos y escrito más de 1,000 reseñas de software exhaustivas. Descubre cómo mantenemos la transparencia y nuestra metodología de revisión de software.
Resumen de las mejores herramientas de monitoreo de rendimiento
Esta tabla comparativa resume los detalles de precios de mis principales selecciones de herramientas de monitoreo de rendimiento para ayudarte a encontrar la mejor opción para tu presupuesto y necesidades de negocio.
| Tool | Best For | Trial Info | Price | ||
|---|---|---|---|---|---|
| 1 | Ideal para el mapeo automático de redes | Prueba gratuita de 14 días + demo gratuita disponible | Precio bajo solicitud | Website | |
| 2 | Ideal para información detallada sobre la reproducción de sesiones | Plan gratuito + prueba gratuita + demo gratuita disponible | Desde $26/mes (facturado anualmente) | Website | |
| 3 | Mejor para monitoreo de nube híbrida | Prueba gratuita de 30 días + demo gratuita disponible | Desde $9/usuario/mes (facturado anualmente) | Website | |
| 4 | Mejor para información a nivel de código | Prueba gratuita de 30 días + demo gratis + plan gratuito disponible | Desde $199/año | Website | |
| 5 | Ideal para monitorizar el rendimiento de la red | Demostración gratuita disponible | Desde $245/25 dispositivos | Website | |
| 6 | Ideal para el seguimiento de errores en tiempo real | Prueba gratuita de 14 días + demo gratis disponible | Desde $12/usuario/mes (facturado anualmente) | Website | |
| 7 | La mejor opción para obtener información sobre el tiempo de actividad y la velocidad del sitio web | Prueba gratuita de 30 días + demo disponible | Desde $10/usuario/mes (facturado anualmente) | Website | |
| 8 | Ideal para el monitoreo integral de la infraestructura de TI | Plan gratuito y demo gratis disponible | Desde $20/usuario/mes (facturado anualmente) | Website | |
| 9 | Mejor para la monitorización automatizada de infraestructuras híbridas | Prueba gratuita de 15 días | Desde $89/usuario/mes (facturado anualmente) | Website | |
| 10 | Mejor para el rastreo de transacciones de negocio de extremo a extremo | Prueba gratuita disponible | Desde $90/usuario/mes (facturado anualmente) | Website |
-

TestDevLab
Visit Website -
Site24x7
Visit WebsiteThis is an aggregated rating for this tool including ratings from Crozdesk users and ratings from other sites.4.7 -
GitHub Actions
Visit WebsiteThis is an aggregated rating for this tool including ratings from Crozdesk users and ratings from other sites.4.8


Reseñas de las mejores herramientas de monitoreo de rendimiento
A continuación encontrarás mis resúmenes detallados de las mejores herramientas de monitoreo de rendimiento que seleccioné para mi lista. Mis reseñas ofrecen un análisis detallado de las características clave, ventajas y desventajas, integraciones y casos de uso ideales de cada herramienta para ayudarte a elegir la mejor para ti.
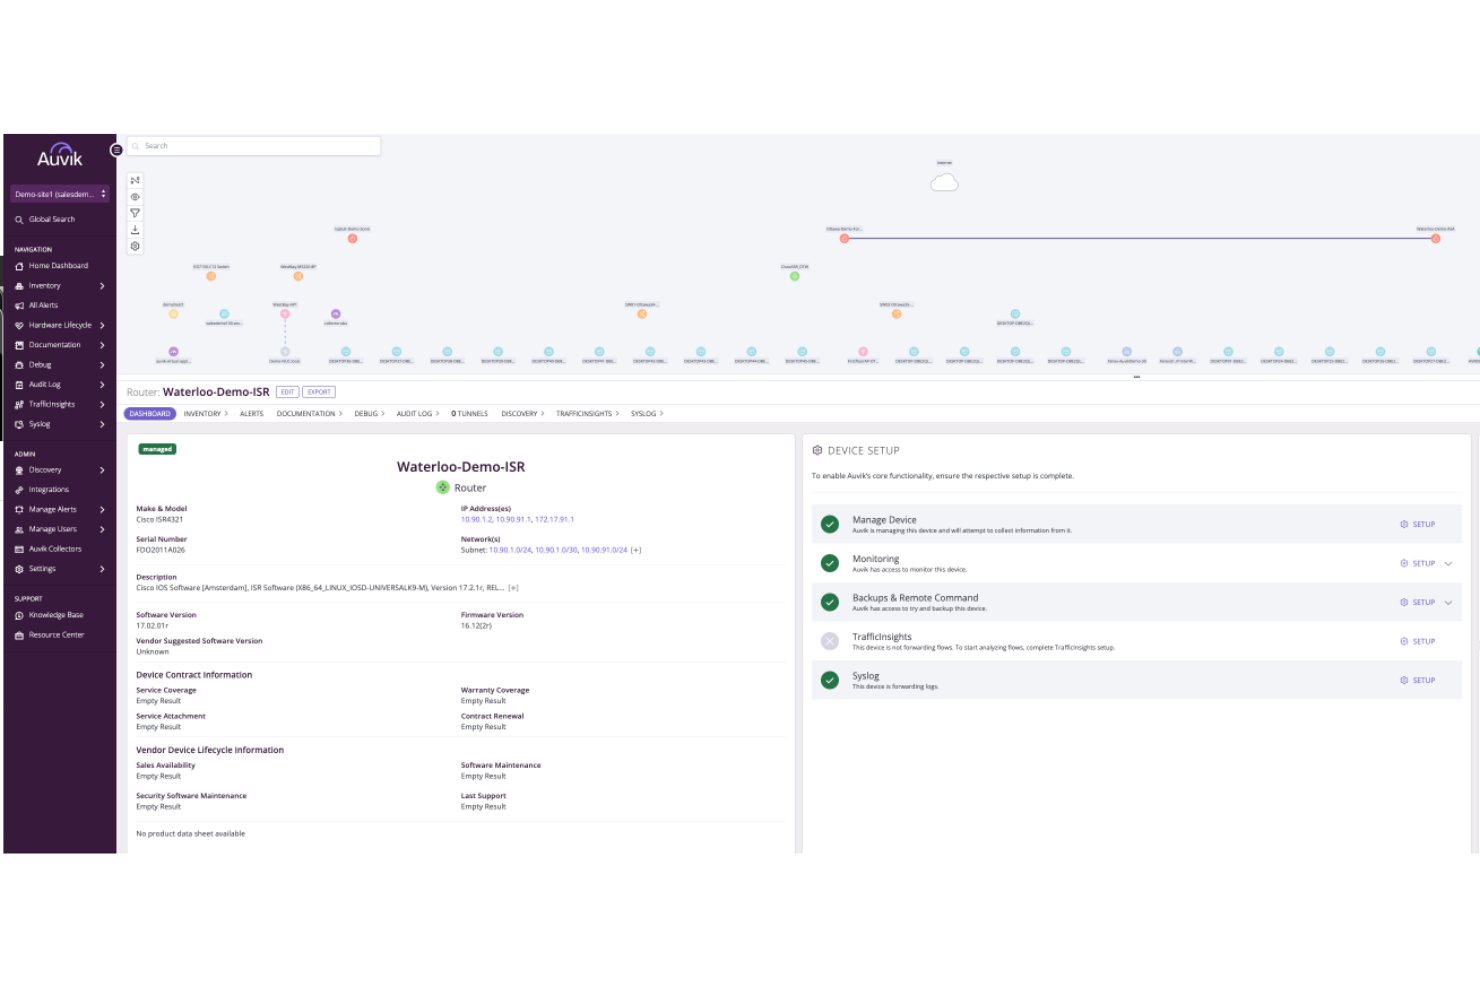
Auvik es una herramienta de gestión de redes que proporciona funciones de monitoreo de rendimiento para ayudarte a rastrear el desempeño de la red y optimizar tu infraestructura. Está diseñada para ofrecerte una visión clara de la salud de tu red, permitiéndote identificar y resolver problemas rápidamente.
Por qué elegí Auvik: Una de las razones por las que elegí Auvik como herramienta de monitoreo de rendimiento es su capacidad para mapear automáticamente dispositivos y conexiones. Esta característica te permite ver todo el diseño de tu red, facilitando la detección de posibles puntos problemáticos. Además, Auvik supervisa el estado del hardware y rastrea métricas de rendimiento en diferentes tipos de dispositivos de más de 700 proveedores, asegurando que dispongas de datos completos para mantener tu red funcionando correctamente. Otra característica destacada son las alertas personalizables de Auvik. Estas alertas te permiten establecer umbrales específicos y recibir notificaciones cuando algo va mal, por lo que siempre estarás informado y podrás actuar de inmediato. La plataforma también admite gestión remota y copias de seguridad de configuraciones, lo que significa que puedes administrar tu red desde cualquier lugar y asegurarte de que tus datos estén seguros y sean recuperables.
Características e integraciones destacadas:
Las funciones incluyen un mapeo de red intuitivo, que proporciona una representación visual de la estructura de tu red, ayudándote a comprender rápidamente su configuración. Auvik también ofrece configuraciones globales de alertas, permitiéndote gestionar alertas en toda tu red con facilidad. Además, la plataforma admite comparaciones de configuraciones, lo que permite rastrear cambios e identificar posibles problemas antes de que se agraven. Las integraciones incluyen ConnectWise, Cisco, Datto, ServiceNow, Slack, Microsoft Intune, Salesforce, Fortinet, Sophos, Splunk, Palo Alto Networks y Zendesk.
Pros and Cons
Pros:
- La monitorización en tiempo real mejora el seguimiento del rendimiento
- Las copias de seguridad automáticas de configuración garantizan la seguridad de los datos
- El mapeo de red mejora la eficiencia en la resolución de problemas
Cons:
- Opciones de personalización limitadas para los usuarios
- Requiere muchos recursos en implementaciones grandes
New Product Updates from Auvik
Auvik Adds Aurora Troubleshooting Assistance
Auvik introduces Aurora Troubleshooting Assistance with AI-powered troubleshooting guidance, possible root causes, conversation downloads, and feedback tools. The open beta helps IT teams diagnose network issues faster with contextual recommendations tailored to specific devices and alerts. For more information, visit Auvik's official site.
 .
.Sentry
Ideal para información detallada sobre la reproducción de sesiones

Sentry es una herramienta de monitoreo de rendimiento utilizada por desarrolladores y empresas para comprender cómo se comportan sus aplicaciones en el uso real, con información adicional a través de la reproducción de sesiones. Ofrece seguimiento de errores, trazas y herramientas de reproducción que ayudan a los equipos a ver dónde los usuarios encuentran problemas y lentitud. Al proporcionar una visibilidad más clara de los problemas de rendimiento, Sentry ayuda a los equipos a reducir el tiempo de inactividad y mejorar la experiencia general del usuario.
Por qué elegí Sentry
Elegí Sentry por sus funciones de reproducción de sesiones, que permiten a los equipos ver exactamente lo que experimentan los usuarios cuando ocurren problemas de rendimiento. Esto facilita conectar errores y lentitud con acciones reales de los usuarios, en vez de confiar únicamente en registros o métricas. Combinado con el seguimiento de errores y las trazas, Sentry ayuda a los equipos a identificar y solucionar problemas más rápido y con mayor contexto.
Características clave de Sentry
Además de la reproducción de sesiones, Sentry ofrece:
- Cobertura de código: Ofrece información sobre qué partes de tu código están probadas, ayudando a priorizar pruebas y optimizar los esfuerzos de desarrollo.
- Reporte de fallos en aplicaciones móviles: Es compatible con plataformas móviles, identificando y resolviendo problemas de cierres inesperados, lo que garantiza una experiencia fluida en dispositivos móviles.
- Observabilidad de IA: Supervisa aplicaciones de IA, ayudando en la detección y resolución de problemas de rendimiento específicos de funcionalidades basadas en IA.
Integraciones de Sentry
Las integraciones incluyen GitHub, Slack, Jira, Bitbucket, Trello, GitLab, PagerDuty, Microsoft Teams y Asana.
Pros and Cons
Pros:
- Las alertas ayudan a los equipos a responder rápidamente a problemas críticos
- Seguimiento de errores sólido con trazas de pila claras
- La reproducción de sesiones ayuda a los equipos a entender los problemas desde la perspectiva del usuario
Cons:
- La reproducción de sesiones puede requerir una configuración cuidadosa para gestionar el volumen de datos y la privacidad
- No es una plataforma completa de monitoreo de infraestructura u observabilidad
New Product Updates from Sentry

Sentry Adds Heatmaps to Application Metrics
Sentry introduced heatmaps for Application Metrics to visualize metric value distributions over time, helping teams spot patterns like latency bursts and use heatmaps in Custom Dashboards. For more information, visit Sentry's official site.
 .
.
Site24x7 ofrece a las empresas una herramienta integral para monitorear entornos de nube híbrida, garantizando un rendimiento y tiempo de actividad óptimos. Dada la creciente adopción de arquitecturas de nube híbrida por parte de las empresas, las herramientas especializadas de Site24x7 llenan un nicho vital al monitorear de manera cohesionada tanto los componentes locales como los de la nube.
Por qué elegí Site24x7: Después de comparar diversas herramientas de monitoreo, Site24x7 destacó por su enfoque especializado en entornos de nube híbrida. Determiné que su capacidad para monitorear de forma holística tanto la infraestructura local como la de la nube la diferencia de sus competidores. Este énfasis único es la razón por la que considero a Site24x7 como la mejor opción para las organizaciones que buscan supervisar sus configuraciones de nube híbrida.
Características y integraciones destacadas:
Site24x7 cuenta con características como métricas de rendimiento en tiempo real, remediación automática de incidentes y capacidades avanzadas de AIOps. En lo que respecta a integraciones, la plataforma se conecta fluidamente con los principales proveedores de servicios en la nube, como AWS, Microsoft Azure y Google Cloud, facilitando una supervisión más amplia a través de varios servicios.
Pros and Cons
Pros:
- Diseñado para entornos de nube híbrida
- La remediación automática de incidentes reduce la intervención manual
- Fuertes capacidades de AIOps para obtener conocimientos mejorados
Cons:
- Algunas funciones avanzadas de monitoreo están limitadas a los niveles premium
- La configuración inicial puede requerir una curva de aprendizaje
- La interfaz de informes podría ser más intuitiva para ciertos usuarios
New Product Updates from Site24x7

Site24x7 Adds Discovery Issues for AWS Monitoring
Site24x7 added Discovery Issues for AWS monitoring, helping teams identify why resources are not being discovered across services and regions. The feature surfaces permission gaps, policy restrictions, and blocked API actions to support faster troubleshooting. For more information, visit Site24x7’s official site.
 .
.Mejor para información a nivel de código
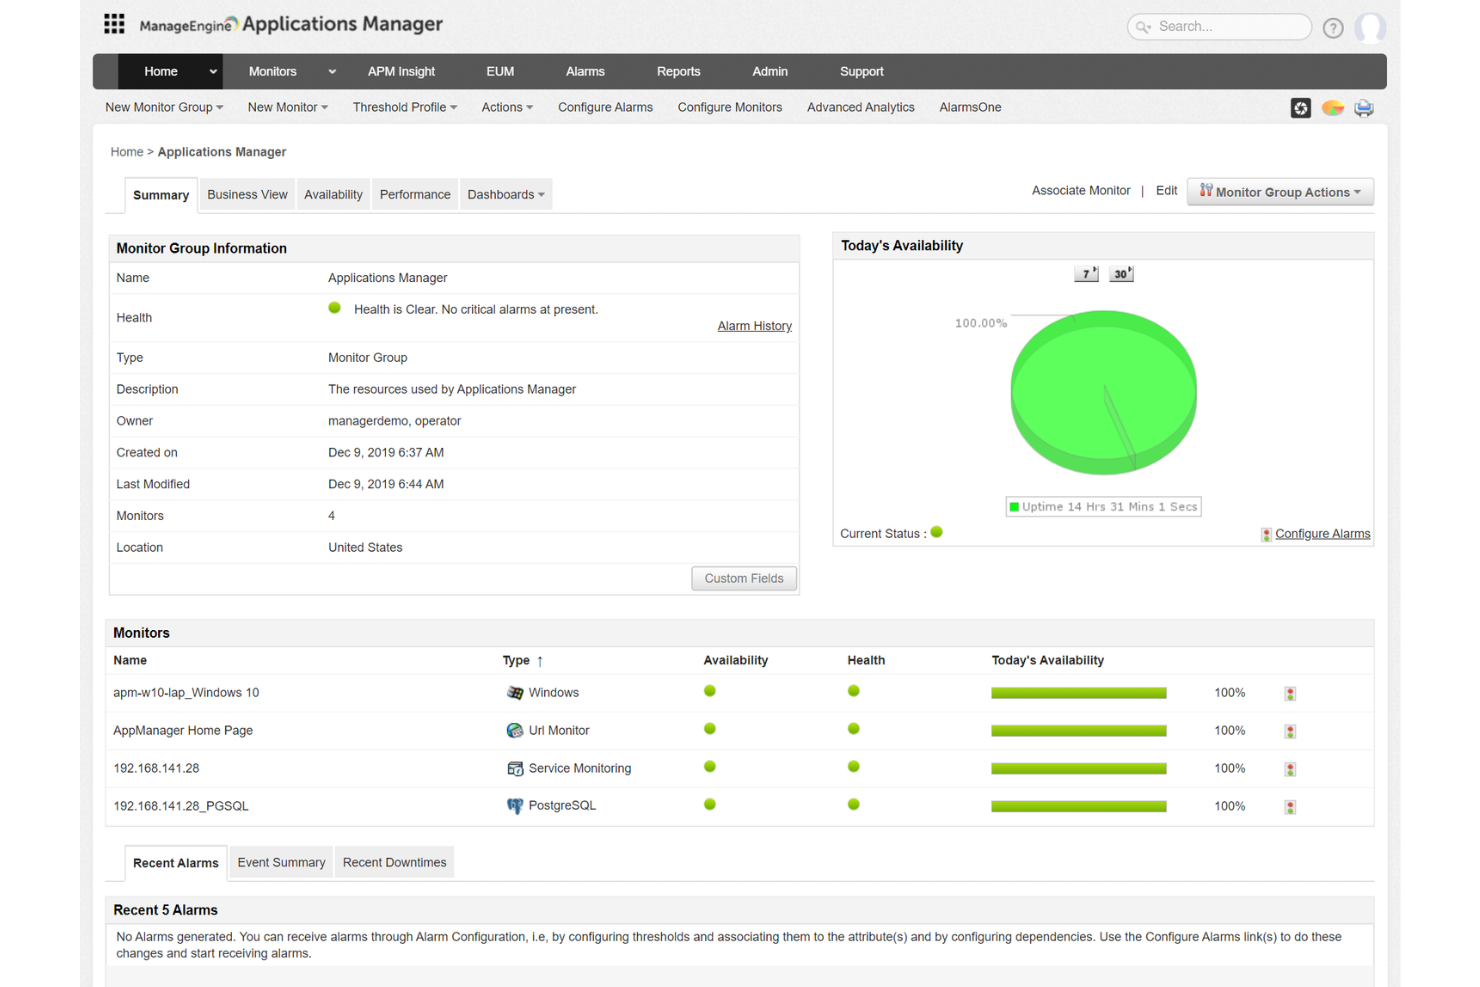
ManageEngine Applications Manager es una solución de supervisión del rendimiento y observabilidad que ofrece visibilidad de pila completa en aplicaciones en la nube y locales. Es compatible con más de 150 tecnologías, ayudando a los equipos de TI a detectar y resolver cuellos de botella de rendimiento antes de que afecten a los usuarios.
Por qué elegí ManageEngine Applications Manager: Me gusta su capacidad para proporcionar diagnósticos profundos a través de información a nivel de código y trazabilidad de transacciones distribuidas. Puedes supervisar el rendimiento de aplicaciones en varios lenguajes de programación, incluidos Java, .NET, Python y Ruby. Con los mapas de servicios de aplicaciones, obtienes una vista clara de las dependencias, lo que ayuda a tu equipo a identificar transacciones lentas y optimizar la ejecución del código. Además, el monitoreo real de usuarios ofrece métricas detalladas de rendimiento de la interfaz basadas en el tráfico real de usuarios, incluyendo tiempos de respuesta por geografía, navegador y red.
Características destacadas e integraciones:
Otras características incluyen monitoreo sintético de transacciones, el cual simula interacciones de usuario usando scripts de pruebas basados en Selenium para verificar proactivamente el rendimiento del sitio web desde múltiples ubicaciones. Además, el descubrimiento automatizado y el mapeo de dependencias te ayudan a visualizar las relaciones entre aplicaciones, bases de datos y servicios, actualizándose dinámicamente a medida que cambia tu entorno. Las integraciones incluyen ManageEngine ServiceDesk Plus, ServiceNow, Site24x7, AlarmsOne, Slack, Prometheus, AWS, Google Cloud, Microsoft Azure, Oracle y MySQL.
Pros and Cons
Pros:
- Supervisa una amplia gama de aplicaciones y componentes de infraestructura
- El sistema de alertas en tiempo real ayuda a los equipos a responder rápidamente a los problemas
- Simplifica la gestión de aplicaciones y sus relaciones
Cons:
- Configurar la herramienta para satisfacer necesidades específicas puede ser un desafío
- La herramienta puede ser intensiva en recursos
New Product Updates from ManageEngine Applications Manager
Oracle Cloud Application Monitoring Now Available in ManageEngine Applications Manager
ManageEngine Applications Manager introduces Oracle Cloud Application Monitoring, Oracle Cloud Function Monitoring, and Oracle Cloud NAT Gateway Monitoring. These new capabilities help teams monitor Oracle Cloud applications, serverless workloads, and network resources from a single platform. For more information, visit ManageEngine Applications Manager's official site.
 .
.Ideal para monitorizar el rendimiento de la red

ManageEngine OpManager es una herramienta de monitoreo del rendimiento de redes que te ayuda a supervisar la salud y el desempeño de tu red. Monitorea dispositivos como routers, switches, servidores y máquinas virtuales para asegurarse de que estén funcionando correctamente.
Por qué elegí ManageEngine OpManager: Elegí OpManager por su capacidad para monitorear el rendimiento de la red en tiempo real. Rastrea métricas importantes como latencia, pérdida de paquetes y tiempo de respuesta, brindándote una visión clara del estado de tu red. Este monitoreo en tiempo real significa que puedes detectar y abordar problemas rápidamente, ayudando a prevenir tiempos de inactividad y asegurando que tus operaciones funcionen sin problemas. También me gusta que OpManager ofrece más de 100 informes integrados que puedes adaptar a tus necesidades, proporcionando información sobre disponibilidad de la red, tendencias de uso y análisis de rendimiento.
Características destacadas e integraciones:
Otras características incluyen el análisis del tráfico de red, que te permite monitorear el uso de ancho de banda e identificar a los principales usuarios y la gestión de configuraciones de red, lo que te permite programar copias de seguridad de la configuración y rastrear los cambios. También ofrece administración de direcciones IP y de puertos de switch, ayudándote a gestionar direcciones IP y a mapear puertos de switch a dispositivos. Algunas integraciones incluyen ADManager Plus, ADAudit Plus, ADSelfService Plus, M365 Manager Plus, PAM360, Password Manager Pro, ServiceDesk Plus y Log360.
Pros and Cons
Pros:
- Escalabilidad para redes en crecimiento
- Alertas en tiempo real
- Capacidades de monitoreo completas
Cons:
- Podría ofrecer más opciones de integración
- Configuración inicial compleja
New Product Updates from ManageEngine OpManager
ManageEngine OpManager Vendor Templates and NCM XML Import
ManageEngine OpManager introduces enhanced vendor template integration and device template import for the NCM module using XML files. This update helps teams improve device classification and speed up configuration workflows. For more information, visit ManageEngine OpManager’s official site.
 .
.
Atatus se especializa en brindar a sus usuarios una visión clara e inmediata de los errores a medida que ocurren, por lo que no hay retrasos en la resolución de problemas. Esta herramienta destaca por su capacidad para detectar errores en tiempo real, proporcionando claridad y una acción rápida cuando los sistemas fallan o se interrumpen.
Por qué elegí Atatus: De todas las herramientas que evalué, Atatus me llamó la atención por su enfoque único en la detección de errores en tiempo real. Elegí Atatus porque, en mi opinión, ofrece una ventaja clara en cuanto al seguimiento inmediato de errores, diferenciándose de muchas otras herramientas de monitoreo. La esencia de su fortaleza radica en su capacidad para reducir el tiempo de inactividad y maximizar la eficiencia operativa, por lo que lo considero la mejor opción para el seguimiento en tiempo real de errores.
Características destacadas e integraciones:
Atatus ofrece métricas de rendimiento de aplicaciones junto con el seguimiento de errores, lo que significa que los usuarios obtienen una visión integral de la salud de la aplicación. Su sistema de alertas es tanto rápido como personalizable, garantizando que las personas adecuadas conozcan los problemas de inmediato. En cuanto a integraciones, Atatus es compatible con varias plataformas, incluidas Slack, JIRA y Webhooks, permitiendo una comunicación eficiente y resolución de incidencias entre equipos.
Pros and Cons
Pros:
- Detección y alertas de errores inmediatas
- Métricas integrales de rendimiento de la aplicación
- Amplia variedad de integraciones para la comunicación del equipo
Cons:
- Puede requerir cierta configuración para entornos específicos
- La interfaz puede parecer compleja para principiantes
- Funcionalidades limitadas en el plan básico de precios
Pingdom
La mejor opción para obtener información sobre el tiempo de actividad y la velocidad del sitio web
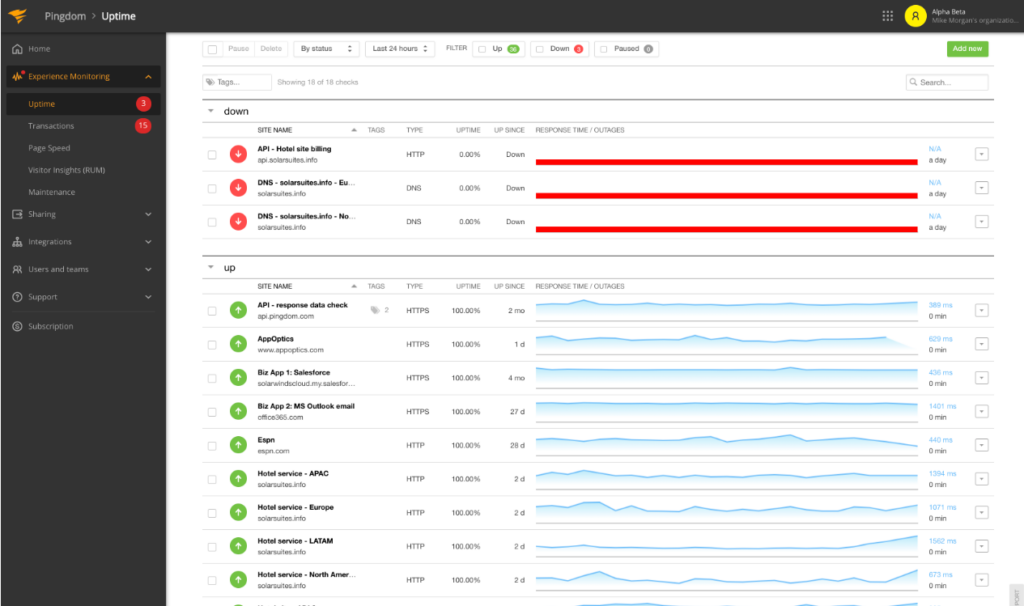
Pingdom proporciona a las empresas información invaluable sobre el tiempo de actividad, el rendimiento y la velocidad de los sitios web. Reconociendo que la accesibilidad y la velocidad de carga de un sitio pueden influir significativamente en la experiencia del usuario y en las conversiones, Pingdom ofrece herramientas especializadas para rastrear estas métricas cruciales.
Por qué elegí Pingdom: Durante mi evaluación de herramientas de monitoreo web, Pingdom surgió constantemente como un líder. Elegí Pingdom principalmente porque se especializa en ofrecer métricas precisas de tiempo de actividad y velocidad, que son fundamentales para cualquier negocio en línea. La profundidad y precisión de sus análisis validan mi juicio de que es la mejor opción para obtener datos claros sobre la velocidad y el tiempo de actividad del sitio web.
Características destacadas e integraciones:
Pingdom destaca por su monitoreo de rendimiento en tiempo real, proporcionando alertas instantáneas en el momento en que se detectan problemas. Su función de análisis de la causa raíz ofrece valiosos datos para abordar rápidamente posibles inconvenientes. En cuanto a integraciones, Pingdom es compatible con varias plataformas, incluidas Slack, Opsgenie y PagerDuty, lo que garantiza que los equipos sean notificados de inmediato ante cualquier discrepancia.
Pros and Cons
Pros:
- Monitoreo en tiempo real y alertas instantáneas
- Análisis integral de la causa raíz para una rápida resolución de problemas
- Admite múltiples integraciones para mejorar la comunicación del equipo
Cons:
- La interfaz puede ser algo compleja para principiantes
- Limitaciones en el número de comprobaciones en los planes básicos
- Algunas funciones avanzadas solo están disponibles en los planes de mayor precio
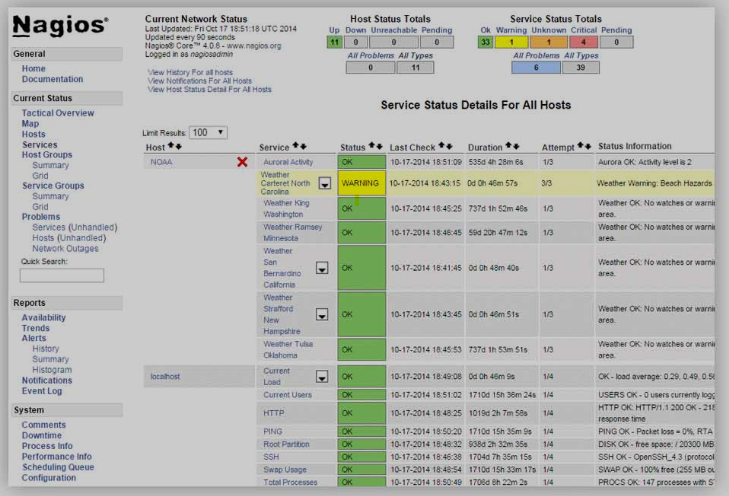
Con Nagios, los usuarios obtienen una vista panorámica de toda su infraestructura de TI, asegurando que cada componente, desde servidores hasta aplicaciones, funcione de manera óptima. Reconociendo el papel vital de una infraestructura de TI confiable en las empresas modernas, Nagios ha adaptado su herramienta para proporcionar una solución de monitoreo integral.
Por qué elegí Nagios: En mi recorrido evaluando herramientas de monitoreo, Nagios apareció constantemente como uno de los principales candidatos. Elegí Nagios por su enfoque completo para el monitoreo de la infraestructura de TI, asegurando que ningún componente pase desapercibido.
Esta naturaleza integral es la razón por la que considero que Nagios es el mejor para empresas que buscan una supervisión exhaustiva de su infraestructura de TI.
Características destacadas e integraciones:
Nagios sobresale en la entrega de informes visuales y detallados, brindando a los equipos de TI una visión clara del estado de su infraestructura. Su sistema de alertas es particularmente robusto, notificando de inmediato a los equipos sobre cualquier posible interrupción. En cuanto a integraciones, Nagios es compatible con una variedad de plugins y cuenta con una sólida comunidad, asegurando la compatibilidad con una amplia gama de sistemas y herramientas.
Pros and Cons
Pros:
- Capacidades de informes detallados y visuales
- Sistema de alertas proactivo para una resolución oportuna de incidentes
- Amplio soporte de plugins y respaldo de una comunidad activa
Cons:
- La configuración inicial puede ser compleja para los principiantes
- La interfaz puede resultar anticuada para algunos usuarios
- Requiere mantenimiento constante para un rendimiento óptimo
Mejor para la monitorización automatizada de infraestructuras híbridas
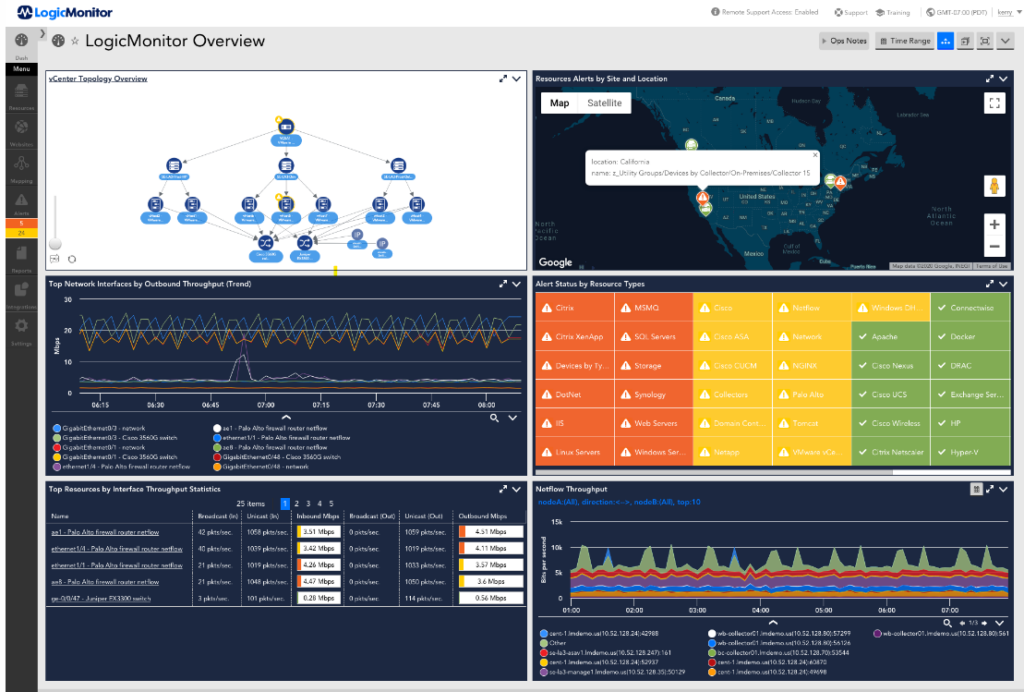
LogicMonitor ofrece una plataforma basada en la nube que se especializa en la monitorización y observabilidad de infraestructuras híbridas, abarcando tanto sistemas locales como implementaciones en la nube. Su enfoque automatizado para rastrear el rendimiento de varios componentes de la infraestructura lo hace especialmente valioso para empresas con entornos complejos y diversos.
Por qué elegí LogicMonitor: Al elegir soluciones de monitorización para esta lista, evalué sus capacidades, y LogicMonitor destacó de manera constante. Lo que lo diferencia de otros son sus capacidades de automatización, especialmente para configuraciones híbridas que combinan entornos tradicionales y en la nube.
En mi opinión, su competencia en este aspecto lo posiciona como el mejor para la monitorización automatizada de infraestructuras híbridas.
Funciones destacadas e integraciones:
Las funciones clave de LogicMonitor incluyen el descubrimiento automatizado de dispositivos, umbrales dinámicos y mecanismos avanzados de alertas. En cuanto a integraciones, LogicMonitor es compatible con una amplia variedad de servicios como AWS, Azure, Cisco, VMware y muchos más, asegurando una cobertura amplia en múltiples plataformas.
Pros and Cons
Pros:
- Monitorización integral de infraestructuras híbridas
- Las funciones de automatización robustas reducen la intervención manual
- Admite una amplia variedad de integraciones
Cons:
- La interfaz puede ser compleja para principiantes
- Las funciones avanzadas pueden resultar abrumadoras para implementaciones pequeñas
- Algunos usuarios informan retrasos ocasionales en las notificaciones de alertas.
AppDynamics
Mejor para el rastreo de transacciones de negocio de extremo a extremo

AppDynamics es una solución de gestión del rendimiento que proporciona a las organizaciones información detallada sobre la salud y eficiencia de sus aplicaciones. Su capacidad para rastrear transacciones de negocio de principio a fin lo convierte en un recurso valioso para quienes buscan métricas integrales de rendimiento de aplicaciones.
Por qué elegí AppDynamics: Tras una investigación exhaustiva y comparar varias herramientas de monitoreo de aplicaciones, concluí que AppDynamics ofrece una clara ventaja en el rastreo de transacciones de negocio de extremo a extremo. La claridad y profundidad de los conocimientos proporcionados por su mecanismo de trazabilidad superaron a los de otros en el dominio.
Dada la importancia de comprender el ciclo completo de vida de las transacciones en el entorno empresarial digital actual, sostengo que AppDynamics es la mejor opción para esta necesidad específica.
Características e integraciones destacadas:
AppDynamics ofrece funciones como detección de anomalías en tiempo real, establecimiento dinámico de líneas base y paneles de rendimiento detallados. En cuanto a integraciones, AppDynamics se sincroniza bien con muchas plataformas líderes, especialmente AWS, Azure y una gran variedad de tecnologías de bases de datos, lo que garantiza una experiencia de monitoreo de aplicaciones cohesiva.
Pros and Cons
Pros:
- Capacidades integrales de rastreo de transacciones de negocio
- La detección de anomalías en tiempo real ayuda a resolver problemas rápidamente
- El establecimiento dinámico de líneas base adapta umbrales según el comportamiento
Cons:
- El precio puede ser prohibitivo para empresas más pequeñas
- El volumen de datos y métricas puede ser abrumador al principio
- Algunas integraciones requieren pasos de configuración adicionales
Otras herramientas de monitoreo de rendimiento
A continuación encontrarás una lista de herramientas de monitoreo de rendimiento adicionales que seleccioné, pero que no llegaron al top 10. Sin duda, vale la pena considerarlas.
- New Relic
Ideal para la colaboración entre DevOps y SRE
- SolarWinds AppOptics
Mejor para métricas granulares de rendimiento de aplicaciones
- Paessler PRTG
Ideal para opciones flexibles de monitoreo de red
- Sematext
Ideal para centralizar registros y métricas
- Dynatrace
Ideal para diagnósticos impulsados por IA
- Datadog
Mejor para la supervisión integrada a escala cloud
- Dotcom Monitor
Ideal para monitoreo complejo y por guiones para APIs


Criterios de selección para herramientas de monitoreo de rendimiento
Al seleccionar las mejores herramientas de monitoreo de rendimiento que se incluyen en esta lista, consideré las necesidades y puntos débiles más comunes de los compradores, como la escalabilidad y la facilidad de integración. También utilicé el siguiente marco para mantener mi evaluación estructurada y justa:
Funcionalidad principal (25% de la puntuación total)
Para ser consideradas en esta lista, cada solución debía cubrir los siguientes casos de uso comunes:
- Supervisar el rendimiento de aplicaciones
- Monitorizar el tiempo de actividad de los servidores
- Proporcionar análisis en tiempo real
- Ofrecer notificaciones de alertas
- Compatibilidad con entornos multiplataforma
Otras características destacadas (25% de la puntuación total)
Para afinar aún más la selección, también busqué características únicas, tales como:
- Paneles de control personalizables
- Información generada por IA
- Rastreo distribuido
- Detección de anomalías
- Monitoreo de la experiencia del usuario
Facilidad de uso (10% de la puntuación total)
Para evaluar la facilidad de uso de cada sistema, consideré lo siguiente:
- Diseño de la interfaz intuitiva
- Facilidad de navegación
- Opciones de personalización
- Curva de aprendizaje
- Características de accesibilidad
Onboarding (10% de la puntuación total)
Para evaluar la experiencia de incorporación de cada plataforma, consideré lo siguiente:
- Disponibilidad de videos de formación
- Recorridos interactivos por el producto
- Acceso a plantillas
- Asistencia por chatbot
- Webinarios y demostraciones en vivo
Soporte al Cliente (10% de la puntuación total)
Para evaluar los servicios de soporte al cliente de cada proveedor de software, consideré lo siguiente:
- Disponibilidad 24/7
- Opciones de soporte multicanal
- Rapidez de respuesta a las consultas
- Disponibilidad de una base de conocimientos
- Servicios de soporte personalizados
Relación Calidad-Precio (10% de la puntuación total)
Para evaluar la relación calidad-precio de cada plataforma, consideré lo siguiente:
- Precios competitivos
- Transparencia en los precios
- Disponibilidad de pruebas gratuitas
- Variedad de funcionalidades en cada nivel de precios
- Descuentos por suscripciones anuales
Opiniones de Clientes (10% de la puntuación total)
Para conocer el grado de satisfacción general de los clientes, tuve en cuenta lo siguiente al leer las opiniones:
- Puntuaciones de satisfacción de los usuarios
- Problemas reportados con frecuencia
- Elogios a funcionalidades específicas
- Comentarios sobre los servicios de soporte
- Tasas generales de recomendación
Cómo Elegir una Herramienta de Monitoreo de Rendimiento
Es fácil perderse entre largas listas de funciones y estructuras de precios complejas. Para ayudarte a mantener el enfoque durante tu proceso de selección de software, aquí tienes una lista de factores que debes tener en cuenta:
| Factor | Qué tener en cuenta |
|---|---|
| Escalabilidad | ¿Puede la herramienta crecer según las necesidades de tu negocio? Considera si soporta cargas de datos crecientes y mayor número de usuarios sin problemas de rendimiento. |
| Integraciones | ¿Se integra con tu conjunto tecnológico actual? Verifica la compatibilidad con sistemas clave como AWS, Azure o Kubernetes para evitar silos de datos. |
| Personalización | ¿Puedes adaptar la herramienta a tus flujos de trabajo? Busca opciones que permitan ajustar los paneles y los informes a las necesidades específicas de tu equipo. |
| Facilidad de uso | ¿La interfaz es intuitiva para tu equipo? Una curva de aprendizaje pronunciada puede ralentizar la adopción, así que busca diseños fáciles de usar y navegación clara. |
| Implementación y onboarding | ¿Cuánto tiempo tomará estar en funcionamiento? Evalúa la disponibilidad de recursos como tutoriales y soporte para facilitar la transición. Los servicios de red de proveedores de optimización WAN pueden requerir procedimientos de puesta en marcha más complejos que otras herramientas. |
| Costo | ¿La estructura de precios es transparente y se ajusta a tu presupuesto? Considera no solo los costos iniciales, sino también los gastos a largo plazo, incluidos posibles complementos o mejoras. |
| Medidas de seguridad | ¿Cumple la herramienta con tus estándares de seguridad? Asegúrate de que ofrezca características sólidas de protección de datos como cifrado y actualizaciones periódicas de seguridad. |
| Disponibilidad de soporte | ¿Tienes acceso a ayuda cuando la necesitas? Revisa los horarios y canales de soporte, como chat o teléfono, para asegurarte de que se adapten a los requisitos de tu equipo. |
¿Qué Son las Herramientas de Monitoreo de Rendimiento?
Las herramientas de monitoreo de rendimiento son soluciones de software utilizadas para rastrear y analizar el rendimiento de aplicaciones, servidores y redes. Los profesionales de TI, desarrolladores y equipos de operaciones suelen usar estas herramientas para asegurar que los sistemas funcionen eficientemente e identificar posibles problemas antes de que se agraven.
El monitoreo en tiempo real, las notificaciones de alerta y los paneles personalizables ayudan a mantener la salud del sistema y optimizar su rendimiento. Un software integral de monitoreo de hardware amplía esta capacidad proporcionando datos detallados sobre los componentes de la infraestructura física. Estas herramientas ofrecen información clave que permite a los equipos mejorar la fiabilidad y la satisfacción del usuario.
Funciones
Al seleccionar herramientas de monitoreo de rendimiento, presta atención a las siguientes características clave:
- Notificaciones de alerta: Envía alertas inmediatas para notificar a los usuarios sobre anomalías del sistema, permitiendo respuestas rápidas ante posibles problemas.
- Paneles personalizables: Permite a los usuarios adaptar la visualización de métricas y datos según sus necesidades y preferencias específicas.
- Detección de anomalías: Identifica patrones inusuales y desviaciones en las métricas de rendimiento, ayudando a diagnosticar rápidamente los problemas.
- Información sobre el rendimiento de aplicaciones: Ofrece un análisis detallado del estado y la eficiencia de las aplicaciones, ayudando a los equipos a optimizar el rendimiento del software.
- Capacidades de integración: Garantiza la compatibilidad con los sistemas y plataformas existentes, reduciendo los silos de datos y mejorando el flujo de trabajo.
- Monitoreo de la experiencia del usuario: Supervisa las interacciones y experiencias de los usuarios finales, proporcionando información útil para mejorar la satisfacción y el compromiso.
- Monitoreo en tiempo real: Proporciona datos continuos sobre el rendimiento del sistema, ayudando a los equipos a identificar y abordar rápidamente los problemas a medida que surgen. Soluciones populares como alternativas a Nagios ofrecen distintos enfoques de monitoreo de sistemas.
- Descubrimiento automatizado: Simplifica el proceso de configuración mediante la identificación y el mapeo automáticos de los componentes del sistema.
- Salvaguardas de seguridad: Proporciona funciones de protección de datos como el cifrado para mantener la integridad del sistema y el cumplimiento de estándares.
Beneficios
Implementar herramientas de monitoreo de rendimiento ofrece varios beneficios para tu equipo y tu empresa. Aquí tienes algunos a los que puedes aspirar:
- Mejora de la fiabilidad del sistema: El monitoreo en tiempo real y las notificaciones de alerta ayudan a mantener la disponibilidad del sistema al identificar y resolver problemas rápidamente.
- Mayor satisfacción del usuario: El monitoreo de la experiencia del usuario brinda información sobre las interacciones con los usuarios finales, permitiendo mejoras que aumentan la satisfacción.
- Rendimiento optimizado: La información sobre el rendimiento de las aplicaciones y la detección de anomalías ayudan a identificar cuellos de botella, logrando una mayor eficiencia del software.
- Gestión eficiente de recursos: Los paneles personalizables y las capacidades de integración aseguran que los datos sean fácilmente accesibles y procesables entre plataformas.
- Seguridad incrementada: Las salvaguardas de seguridad protegen la integridad de los datos, garantizando el cumplimiento de los estándares de la industria y reduciendo riesgos.
- Resolución proactiva de problemas: El descubrimiento automatizado y las alertas en tiempo real permiten a los equipos abordar posibles inconvenientes antes de que afecten las operaciones.
- Flujos de trabajo optimizados: Las capacidades de integración aseguran un flujo de datos sin problemas entre sistemas, reduciendo el trabajo manual y mejorando la productividad.
Costos y Precios
Seleccionar herramientas de monitoreo de rendimiento requiere comprender los diferentes modelos de precios y planes disponibles. Los costos varían según las funciones, el tamaño del equipo, los complementos y más. La siguiente tabla resume los planes comunes, sus precios promedio y las características típicas incluidas en las soluciones de monitoreo de rendimiento:
Tabla comparativa de planes para herramientas de monitoreo de rendimiento
| Tipo de Plan | Precio Promedio | Características Comunes |
|---|---|---|
| Plan Gratuito | $0 | Monitoreo básico, retención limitada de datos y soporte comunitario. |
| Plan Personal | $5-$25/user/month | Monitoreo en tiempo real, notificaciones de alerta, paneles personalizables y soporte por correo electrónico. |
| Plan Empresarial | $30-$75/user/month | Análisis avanzado, capacidades de integración, monitoreo de la experiencia del usuario y soporte telefónico. |
| Plan Corporativo | $100-$200/user/month | Visibilidad completa, gestión de cuentas dedicada, funciones de seguridad avanzadas y soporte premium 24/7. |
Preguntas frecuentes sobre herramientas de monitoreo de rendimiento
Aquí tienes respuestas a preguntas comunes sobre herramientas de monitoreo de rendimiento:
¿Qué aspectos deberías considerar al elegir una herramienta de monitoreo de rendimiento?
Al elegir una herramienta de monitoreo de rendimiento, considera la seguridad, la protección de datos y la privacidad. Asegúrate de que la herramienta cumpla con normativas sectoriales como GDPR o HIPAA. Evalúa qué tan bien se integra con tus sistemas existentes y su capacidad para escalar según las necesidades de tu negocio. Para equipos que buscan opciones más amplias que las soluciones tradicionales, nuestra guía deu0026nbsp;u003ca href=u0022https://thectoclub.com/tools/best-new-relic-alternatives/u0022u003ealternativas a New Relicu003c/au003eu0026nbsp;ofrece comparaciones detalladas de las herramientas mejor valoradas.
¿Cómo gestionan la privacidad de datos las herramientas de monitoreo de rendimiento?
Las herramientas de monitoreo de rendimiento suelen incluir funciones para garantizar la privacidad de los datos, mediante el cifrado y controles de acceso. Debes verificar que la herramienta elegida cumpla con las regulaciones de protección de datos relevantes y ofrezca registros de auditoría para rastrear el acceso y uso de los datos.
¿Cómo se integran las herramientas de monitoreo de rendimiento con los sistemas existentes?
La mayoría de las herramientas de monitoreo de rendimiento ofrecen APIs y conectores para integrarse con otros sistemas. Comprueba si la herramienta es compatible con tu pila tecnológica actual, incluidos servicios en la nube y aplicaciones locales, para garantizar un flujo de datos fluido y evitar silos.
¿Cómo alertan las herramientas de monitoreo de rendimiento a los usuarios sobre incidencias?
Normalmente, estas herramientas utilizan sistemas de alertas en tiempo real para notificar a los usuarios sobre problemas de rendimiento. Las alertas pueden enviarse por correo electrónico, SMS o plataformas de mensajería integradas. Busca umbrales de alerta personalizables y rutas de escalamiento ajustadas al flujo de trabajo de tu equipo.
¿Qué tipo de soporte puedes esperar de los proveedores de herramientas de monitoreo de rendimiento?
El soporte varía según el proveedor, pero a menudo incluye ayuda 24/7 a través de chat, correo electrónico o teléfono. Algunos proveedores ofrecen gestores de cuentas dedicados o planes de soporte premium. Evalúa el nivel de soporte que necesitas y asegúrate de que esté disponible en tus canales preferidos.
¿Cómo ayudan las herramientas de monitoreo de rendimiento a optimizar los recursos?
Al proporcionar información sobre el rendimiento del sistema e identificar cuellos de botella, estas herramientas ayudan a optimizar la asignación de recursos. Permiten ajustar cargas de trabajo, escalar recursos de manera eficiente y mejorar el rendimiento general del sistema, lo que se traduce en ahorro de costos y mejor gestión de los recursos.
¿Qué sigue?
Si estás investigando herramientas de monitoreo de rendimiento, conéctate con un asesor de SoftwareSelect para obtener recomendaciones gratuitas.
Solo tienes que completar un formulario y agendar una charla breve para detallar tus necesidades. Luego recibirás una lista corta de software para revisar. Incluso te acompañarán durante todo el proceso de compra, incluida la negociación de precios.