10 Mejores Herramientas de Monitoreo de Infraestructura en la Nube de 2026

10 Mejores herramientas de monitorización de infraestructura en la nube - Selección


Mantener la infraestructura en la nube funcionando sin problemas no se trata solo de garantizar el tiempo de actividad: se trata de identificar problemas de rendimiento antes de que afecten a los usuarios, asegurar la escalabilidad sin desperdicio y mantener la visibilidad en entornos complejos. Si alguna vez has sufrido ralentizaciones inexplicables, caídas inesperadas o falta de información en tiempo real, ya sabes lo complicado que resulta anticiparse a los problemas sin las herramientas adecuadas de monitorización.
Las herramientas de monitorización de infraestructura en la nube ofrecen una manera centralizada de rastrear el rendimiento de las aplicaciones, la actividad de red y el uso de recursos en entornos cloud. A lo largo de los años, he probado una amplia variedad de estas soluciones, evaluando su capacidad para detectar incidencias, reducir tiempos de respuesta e integrarse en los flujos de trabajo existentes. En esta guía, desgloso las mejores opciones disponibles para ayudarte a encontrar una solución que se ajuste a tus necesidades de monitorización en la nube.
Table of Contents
- Mejores Herramientas Seleccionadas
- Por Qué Confiar en Nosotros
- Comparar Especificaciones
- Reseñas
- Otras Herramientas de Monitoreo de Infraestructura en la Nube
- Reseñas de Software Relacionado
- Criterios de Selección
- Cómo Elegir
- Tendencias en Herramientas de Monitoreo de Infraestructura en la Nube
- Qué Son las Herramientas de Monitoreo de Infraestructura en la Nube
- Características
- Beneficios
- Costos y Precios
- Preguntas Frecuentes
Por qué confiar en nuestras reseñas de software
Llevamos probando y revisando software desde 2023. Como líderes tecnológicos, sabemos lo crítico y difícil que es tomar la decisión correcta al seleccionar software.
Invertimos en una investigación profunda para ayudar a nuestra audiencia a tomar mejores decisiones de compra de software. Hemos probado más de 2,000 herramientas para diferentes casos de uso tecnológicos y escrito más de 1,000 reseñas de software exhaustivas. Descubre cómo mantenemos la transparencia y nuestra metodología de revisión de software.
Resumen de las mejores herramientas de monitorización de infraestructura en la nube
| Tool | Best For | Trial Info | Price | ||
|---|---|---|---|---|---|
| 1 | Mejor para pruebas sintéticas de transacciones | No | Precios bajo solicitud | Website | |
| 2 | Mejor para el monitoreo del rendimiento de aplicaciones | No | $945 anuales para hasta 25 servidores o aplicaciones | Website | |
| 3 | Ideal para el monitoreo de infraestructuras híbridas de TI | No | Precios a consultar | Website | |
| 4 | Ideal para métricas de salud detalladas | Sí | $99/month | Website | |
| 5 | Ideal para el enfoque de Infraestructura como Código (IaC) | Sí | $20/user/month | Website | |
| 6 | Mejor para el entorno de IBM Cloud | No | $10 por cada millón de métricas ingeridas/mes | Website | |
| 7 | Bueno para datos unificados de aplicaciones e infraestructura | Prueba gratuita de 30 días disponible | Desde $7/nodo/mes | Website | |
| 8 | Mejor para monitoreo en la nube de código abierto | Not available | Gratis, soporte de pago desde $1000/mes | Website | |
| 9 | Mejor para observabilidad en tiempo real | No | $60 por host al mes | Website | |
| 10 | Ideal para visibilidad en cada ruta de red | No | Precios personalizados | Website |
-

TestDevLab
Visit Website -
Site24x7
Visit WebsiteThis is an aggregated rating for this tool including ratings from Crozdesk users and ratings from other sites.4.7 -
GitHub Actions
Visit WebsiteThis is an aggregated rating for this tool including ratings from Crozdesk users and ratings from other sites.4.8


Opiniones sobre las mejores herramientas de monitorización de infraestructura en la nube
A continuación, encontrarás mis resúmenes detallados de las mejores herramientas de monitorización de infraestructura en la nube que he seleccionado. Mis reseñas ofrecen un análisis en profundidad de las características clave, ventajas y desventajas, integraciones y casos de uso ideales de cada herramienta para ayudarte a encontrar la que mejor se adapte a ti.

Para las empresas que gestionan infraestructuras complejas en la nube, Site24x7 ofrece una solución de monitoreo que incluye pruebas sintéticas de transacciones para ayudar a rastrear la disponibilidad y el rendimiento de los servicios. Está dirigido a equipos de TI y organizaciones que necesitan una visibilidad clara en sus entornos en la nube, ayudando a abordar problemas como disminuciones de rendimiento, uso de recursos y respuesta a incidentes. Con cobertura para las principales plataformas en la nube y una variedad de funciones de monitoreo, Site24x7 ayuda a los equipos a mantener operaciones estables y una experiencia de usuario consistente.
Por qué elegí Site24x7
Elegí Site24x7 por sus pruebas sintéticas de transacciones, que ayudan a monitorear la disponibilidad de los servicios simulando flujos de trabajo de usuarios y sistemas. La plataforma también es compatible con los principales entornos en la nube e incluye monitoreo del rendimiento de aplicaciones para rastrear el comportamiento de las aplicaciones e identificar problemas. Sus funciones de automatización facilitan la gestión de incidentes, ayudando a los equipos a responder más rápido y administrar los recursos de manera más eficaz.
Funciones clave de Site24x7
Además de las pruebas sintéticas de transacciones, Site24x7 ofrece:
- Monitoreo Real de Usuarios (RUM): Esta función ofrece información sobre la experiencia real del usuario al rastrear y analizar las interacciones de los usuarios con tus aplicaciones.
- Gestión de logs: Con esta función, puedes agregar y analizar registros de diversas fuentes para obtener una visión completa del estado de tu sistema.
- Monitoreo de red: Proporciona visibilidad sobre el rendimiento de la red, ayudando a solucionar problemas de conectividad y optimizar la infraestructura de red.
Integraciones de Site24x7
Las integraciones incluyen Slack, ServiceNow, Moogsoft, Jira, PagerDuty, Freshservice, Microsoft Teams, Amazon EventBridge, Zapier y ManageEngine Analytics Plus.
Pros and Cons
Pros:
- Monitoreo flexible que se integra fácilmente con diversos componentes de infraestructura
- Monitoreo completo para distintos sistemas
- El monitoreo integral con inteligencia artificial admite la gestión de infraestructuras multicloud
Cons:
- La configuración compleja ralentiza la puesta en marcha y la comprensión de la plataforma
- Errores en alertas causan problemas al agregar nuevas configuraciones de monitoreo
New Product Updates from Site24x7

Site24x7 Adds Discovery Issues for AWS Monitoring
Site24x7 added Discovery Issues for AWS monitoring, helping teams identify why resources are not being discovered across services and regions. The feature surfaces permission gaps, policy restrictions, and blocked API actions to support faster troubleshooting. For more information, visit Site24x7’s official site.
 .
.Mejor para el monitoreo del rendimiento de aplicaciones
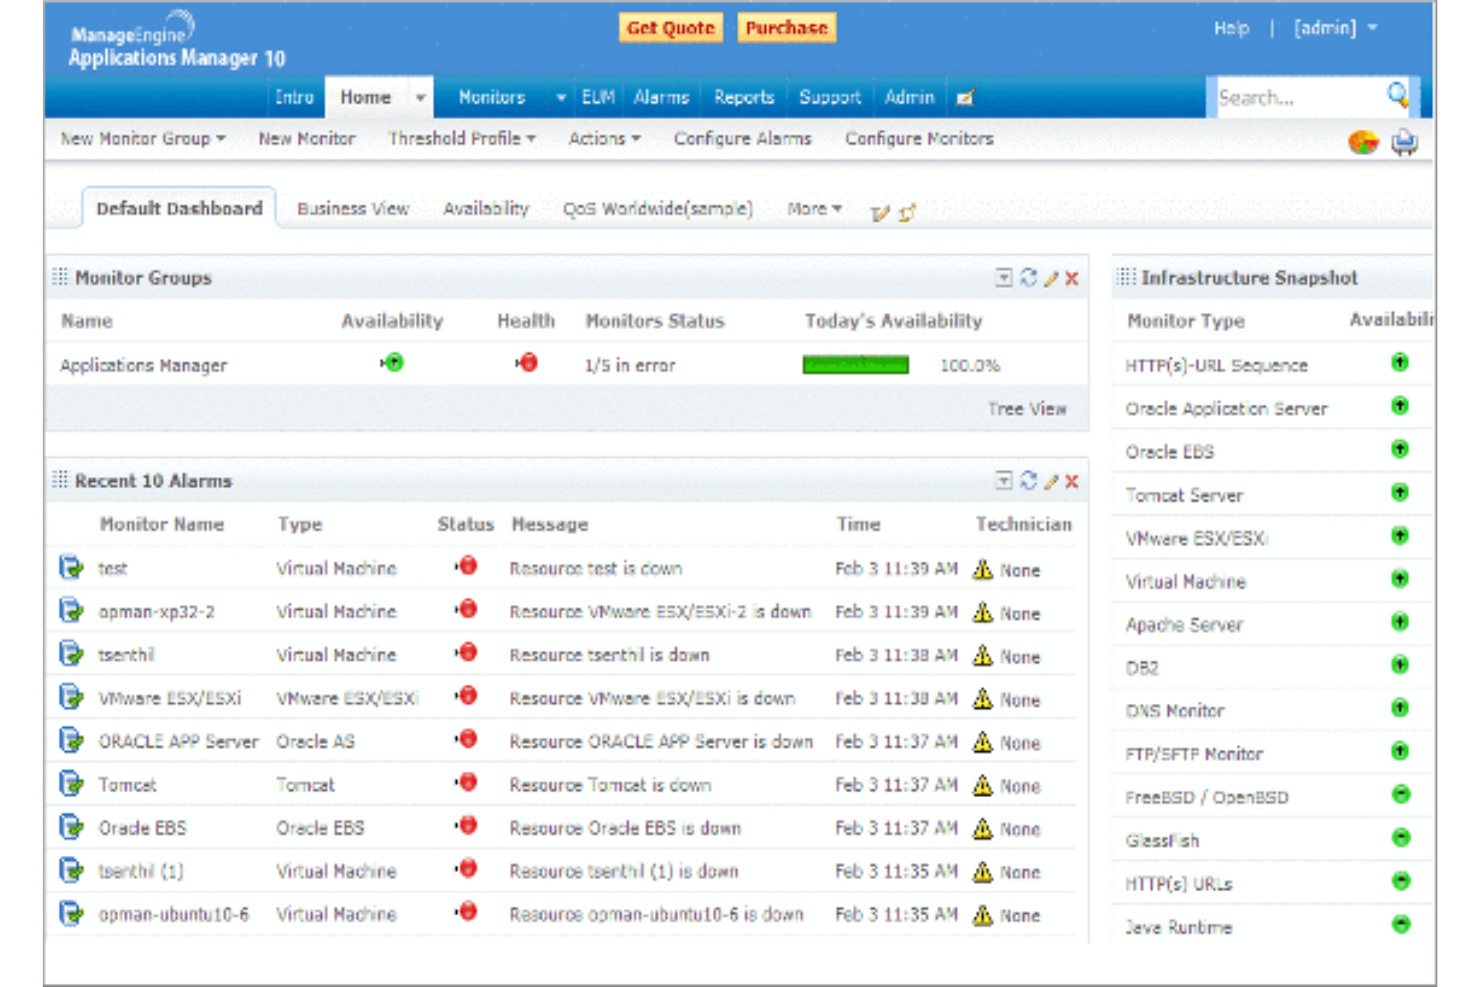
ManageEngine Applications Manager es una herramienta robusta que ofrece monitoreo de rendimiento de extremo a extremo para una amplia variedad de aplicaciones, bases de datos, servidores y sistemas. Es especialmente competente en proporcionar información detallada sobre el rendimiento de las aplicaciones, lo que la convierte en una solución óptima para el monitoreo del rendimiento de aplicaciones.
Por qué elegí ManageEngine Applications Manager:
Al seleccionar ManageEngine Applications Manager para esta lista, tuve en cuenta su capacidad integral para monitorear y gestionar aplicaciones en una variedad de entornos. Se destaca por ofrecer información detallada sobre el rendimiento de las aplicaciones, ayudando en la detección y resolución rápida de problemas.
En consecuencia, la consideré la “mejor para el monitoreo del rendimiento de aplicaciones” debido a sus capacidades superiores en este ámbito específico.
Características destacadas y integraciones:
Algunas de las características más sobresalientes de ManageEngine Applications Manager incluyen su capacidad de descubrimiento de aplicaciones, monitoreo exhaustivo de componentes y automatización inteligente. Estas funciones permiten un monitoreo robusto y la resolución automatizada de problemas, garantizando que el rendimiento de las aplicaciones se mantenga óptimo.
En cuanto a las integraciones, ManageEngine Applications Manager puede integrarse con varias aplicaciones, servidores y bases de datos, como Oracle, MySQL, Microsoft SQL Server, SAP y muchos más.
Pros and Cons
Pros:
- Monitoreo detallado del rendimiento de aplicaciones
- Amplia compatibilidad con diversas aplicaciones, servidores y bases de datos
- Automatización inteligente para la resolución de problemas
Cons:
- Puede ser complejo de configurar y poner en marcha
- El costo inicial elevado podría ser una barrera para empresas más pequeñas
- La interfaz puede no ser tan fácil de usar como la de algunas alternativas
New Product Updates from ManageEngine Applications Manager
ManageEngine Applications Manager Adds ServiceDesk Plus MSP Cloud
ManageEngine Applications Manager adds ServiceDesk Plus MSP Cloud integration to automatically create and manage tickets from application alarms, helping teams track and resolve incidents faster. For more information, visit ManageEngine Applications Manager’s official site.
 .
.Ideal para el monitoreo de infraestructuras híbridas de TI
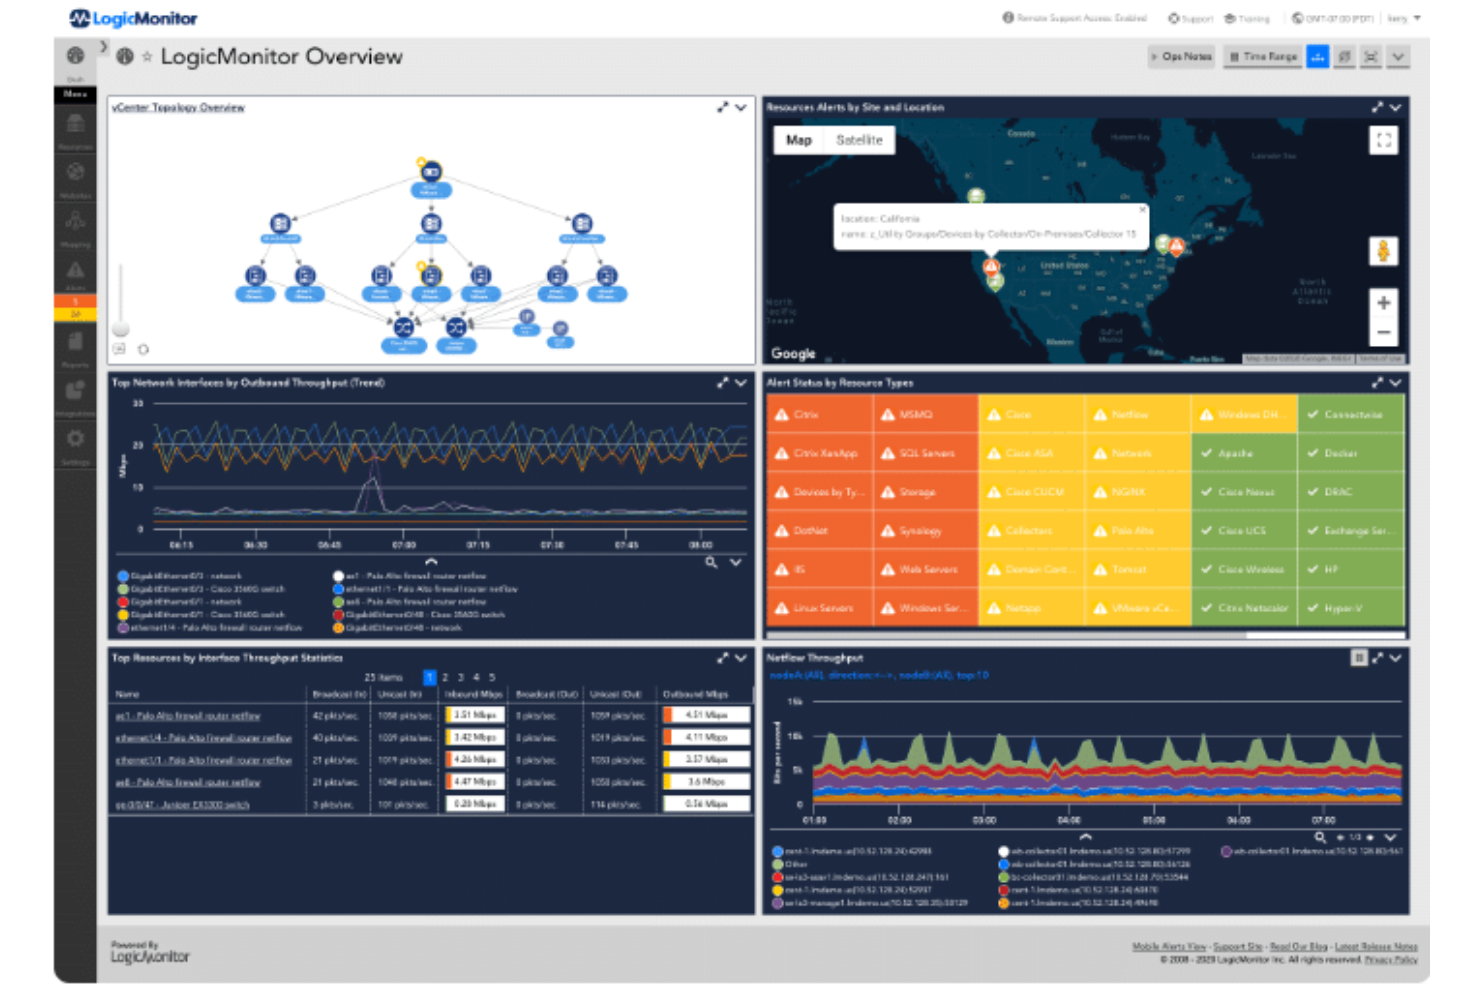
LogicMonitor es una plataforma SaaS automatizada de monitoreo del rendimiento de TI que proporciona visibilidad integral en infraestructuras de TI complejas. Dada su capacidad para gestionar tanto entornos locales como en la nube, se destaca como una de las mejores opciones para monitorear infraestructuras híbridas de TI.
Por qué elegí LogicMonitor:
Al seleccionar una herramienta que sobresale en el monitoreo de infraestructuras híbridas de TI, mi elección fue LogicMonitor. Su versatilidad al soportar una amplia gama de infraestructuras, incluidas la nube, sistemas locales y sistemas híbridos, la distingue. Determiné que LogicMonitor es la mejor para el monitoreo de infraestructuras híbridas de TI debido a su función de descubrimiento automatizado de dispositivos y su capacidad para gestionar sistemas diversos.
Funciones destacadas y integraciones:
La función de descubrimiento automatizado de dispositivos de LogicMonitor es verdaderamente notable, ya que simplifica el proceso de agregar nuevos dispositivos al sistema. También ofrece paneles de control personalizables, brindando a los usuarios flexibilidad para monitorear su infraestructura según sus necesidades específicas.
En cuanto a las integraciones, LogicMonitor es compatible con varias plataformas en la nube como AWS, Google Cloud y Azure. Además, se integra con herramientas empresariales clave como ServiceNow, Slack y Jira, contribuyendo a operaciones más ágiles.
Pros and Cons
Pros:
- Descubrimiento automático de dispositivos para una configuración sencilla
- Paneles personalizables para un monitoreo adaptado
- Soporta varias plataformas en la nube y herramientas empresariales
Cons:
- La información sobre precios no es transparente
- Algunos usuarios pueden encontrar la interfaz poco intuitiva
- La configuración de paneles personalizados puede requerir conocimientos técnicos
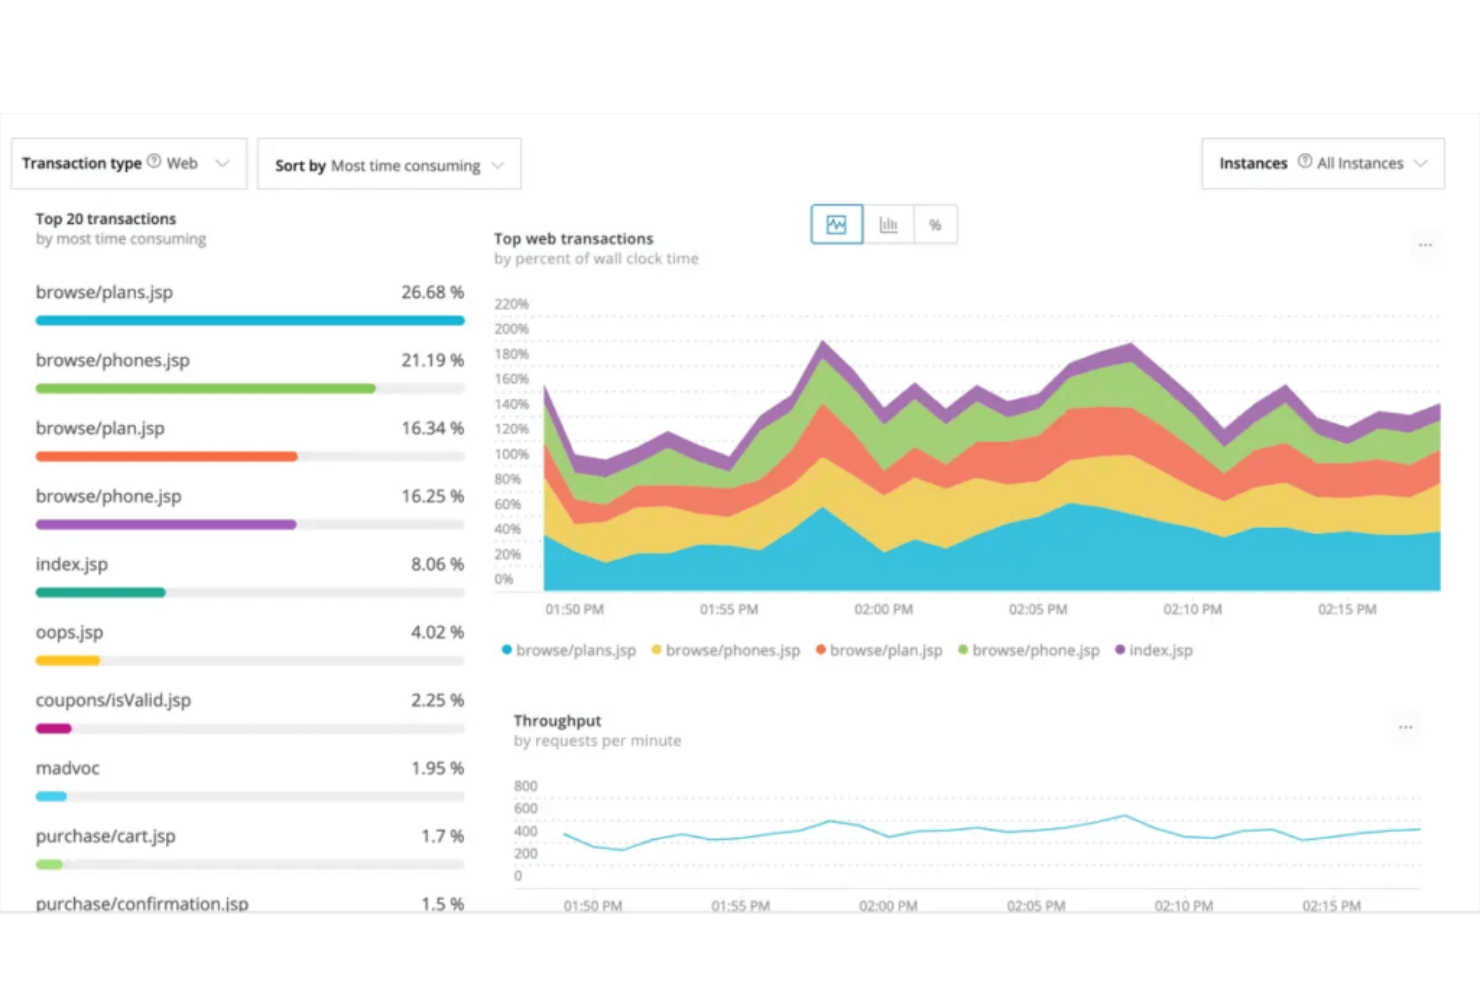
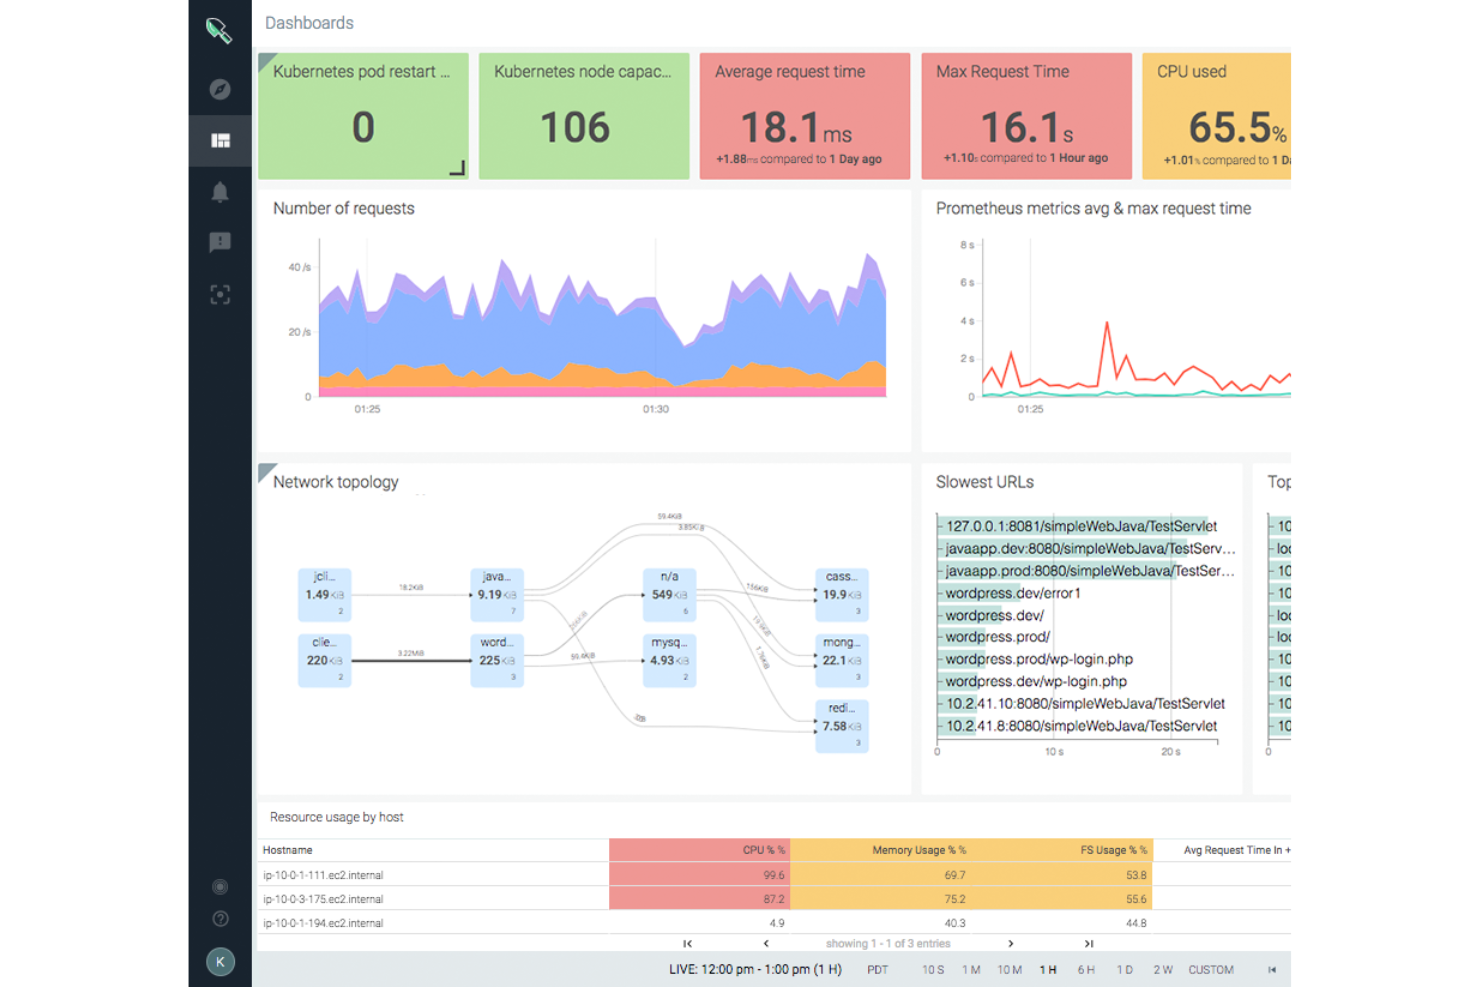
New Relic es una plataforma de análisis de software basada en la nube que ofrece información en tiempo real para ayudar a las empresas a evaluar el rendimiento de sus aplicaciones de software. Con sus métricas de estado detalladas, es especialmente hábil a la hora de proporcionar análisis en profundidad sobre el estado y la eficiencia de estos sistemas.
Por qué elegí New Relic:
New Relic me llamó la atención por sus potentes capacidades analíticas, y por eso lo elegí para esta lista. Su capacidad para ofrecer métricas de salud granulares y en tiempo real lo distingue de otras herramientas. Considero que New Relic es el mejor para métricas de salud detalladas gracias a su análisis de datos integral y sus capacidades de visualización, que ofrecen una visión más profunda del rendimiento de las aplicaciones.
Características destacadas y integraciones:
Una de las funciones más destacadas de New Relic es su capacidad de monitoreo del rendimiento de aplicaciones (APM), que brinda información integral sobre el estado de tus aplicaciones. Además, incluye monitoreo de usuario real, proporcionando datos sobre cómo interactúan los usuarios con tus aplicaciones.
New Relic se integra perfectamente con una variedad de plataformas como AWS, Azure, Google Cloud Platform y Kubernetes. Estas integraciones ayudan a ofrecer una visión más holística de tu infraestructura y aplicaciones.
Pros and Cons
Pros:
- Métricas de salud detalladas para análisis en profundidad
- Amplia variedad de integraciones con plataformas en la nube
- Capacidades integrales de monitoreo del rendimiento de aplicaciones
Cons:
- Precios elevados para pequeñas empresas
- Una interfaz compleja que puede ser difícil para principiantes
- La gran cantidad de funciones puede generar sobrecarga de información para algunos usuarios
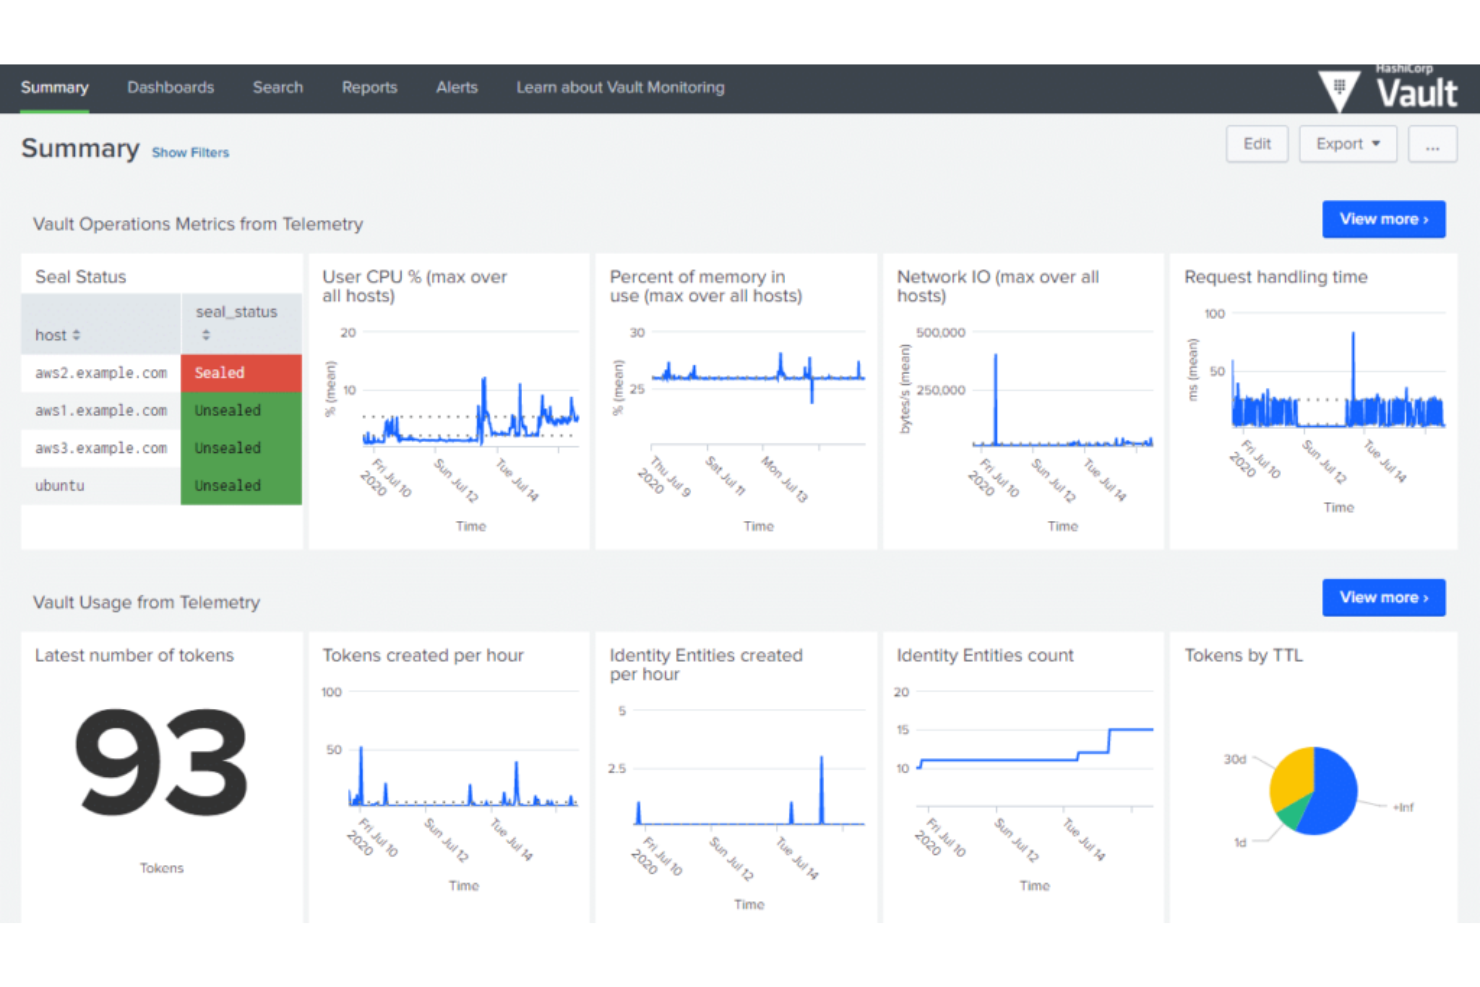
HashiCorp ofrece un conjunto de herramientas de código abierto para permitir a las empresas definir, aprovisionar y gestionar infraestructuras de centros de datos utilizando un enfoque declarativo mediante código. Es ideal para organizaciones que desean adoptar la metodología de Infraestructura como Código (IaC) para mejorar la eficiencia y mantener la coherencia en la gestión de infraestructuras.
Por qué elegí HashiCorp:
Incluí a HashiCorp en mi selección debido a sus sólidas capacidades de IaC, que lo hacen bastante distintivo en el panorama de la gestión de infraestructuras. Este enfoque de IaC fomenta la eficiencia, la repetibilidad y la seguridad en el aprovisionamiento y la gestión de la infraestructura.
Por estas razones, considero que HashiCorp es 'Mejor para' organizaciones interesadas en utilizar el enfoque de IaC.
Características destacadas e integraciones:
Las herramientas de HashiCorp, como Terraform, Vault y Consul, ofrecen una amplia gama de funciones que se adaptan al aprovisionamiento de infraestructuras, la seguridad y la red de servicios. La característica de codificación de infraestructura de Terraform lo hace especialmente valioso para implementar y gestionar infraestructuras de cualquier escala.
Las integraciones más relevantes incluyen aquellas con AWS, GCP y Azure, ampliando efectivamente sus capacidades de IaC a través de múltiples entornos en la nube.
Pros and Cons
Pros:
- Excelentes capacidades de Infraestructura como Código
- Se integra con las principales plataformas de la nube
- Ofrece una variedad de herramientas para diferentes aspectos de la gestión de infraestructuras
Cons:
- Puede ser complejo de configurar y utilizar
- Las versiones empresariales pueden ser costosas para equipos pequeños
- El soporte para usuarios gratuitos puede ser limitado
IBM Cloud Monitoring es un servicio de monitoreo que proporciona información en tiempo real sobre el rendimiento de tus aplicaciones e infraestructuras alojadas en IBM Cloud. Esta herramienta está diseñada específicamente para funcionar perfectamente dentro del entorno de IBM Cloud, lo que la convierte en la mejor opción para quienes forman parte de este ecosistema.
Por qué elegí IBM Cloud Monitoring:
Elegir IBM Cloud Monitoring para la lista fue una decisión sencilla considerando su integración superior y compatibilidad nativa con el entorno de IBM Cloud. Destaca por su interoperabilidad sin fisuras con los diversos servicios de IBM Cloud.
La consideré la 'mejor para el entorno de IBM Cloud' debido a su capacidad para ofrecer métricas detalladas, paneles de control y alertas específicamente para IBM Cloud.
Características destacadas y integraciones:
Las métricas detalladas de IBM Cloud Monitoring proporcionan una gran cantidad de datos sobre el rendimiento de tu infraestructura. Su capacidad para proporcionar datos de monitoreo en tiempo real y facilitar la detección rápida de anomalías es notable.
En cuanto a integraciones, se integra perfectamente con varios servicios de IBM Cloud, incluidos IBM Cloud Databases, IBM Kubernetes Service e IBM Cloud Functions, por nombrar algunos.
Pros and Cons
Pros:
- Integración perfecta con los servicios de IBM Cloud
- Las métricas detalladas ofrecen información integral
- Monitoreo en tiempo real y detección de anomalías
Cons:
- La estructura de precios puede ser compleja y depende del uso
- Puede no integrarse bien con servicios ajenos a IBM
- La interfaz puede requerir un período de aprendizaje para los nuevos usuarios
Bueno para datos unificados de aplicaciones e infraestructura

SolarWinds Observability SaaS es una plataforma de monitoreo de infraestructura en la nube para equipos de TI y DevOps. Proporciona visibilidad a través de aplicaciones en la nube, infraestructura, registros, bases de datos, redes y datos de experiencia del usuario. Aborda las complejidades de gestionar diversos entornos de TI, ofreciendo herramientas para agilizar los procesos de monitoreo, mejorar la resolución de problemas y brindar información accionable, lo que la hace ideal para equipos que buscan optimizar sus operaciones de TI y mejorar el rendimiento del sistema.
Por qué elegí SolarWinds Observability SaaS
Elegí SolarWinds Observability SaaS por su capacidad de proporcionar una visibilidad integral mediante datos unificados de aplicaciones e infraestructura. Esta característica es crucial para comprender todo el alcance de los entornos de TI, lo que incluye compatibilidad con frameworks de código abierto e integraciones con terceros. Además, sus capacidades de AIOps, mejoradas con aprendizaje automático, pueden ayudar a reducir la fatiga por alertas al priorizar los problemas reales, convirtiéndolo en una herramienta valiosa para equipos abrumados por alertas constantes.
Características clave de SolarWinds Observability SaaS
Aquí hay algunas funciones que podrías encontrar útiles:
- Instrumentación automatizada y mapeo de dependencias: Esta función permite a tu equipo monitorear y mapear dependencias de forma eficiente sin intervención manual.
- Detección de anomalías en tiempo real y análisis de causa raíz potenciado por IA: Ayuda a identificar y abordar rápidamente los problemas antes de que afecten el rendimiento de tu sistema.
- Implementación rápida e interfaz fácil de usar: Tu equipo puede obtener valor rápidamente gracias a una interfaz intuitiva que simplifica la configuración y la gestión continua.
- Compatibilidad con frameworks de código abierto: Esto asegura una fácil integración con herramientas existentes, brindando flexibilidad en la gestión de tu infraestructura de TI.
Integraciones de SolarWinds Observability SaaS
Las integraciones incluyen AWS, Azure, Google Cloud Platform, Kubernetes, ServiceNow, Slack, Microsoft Teams, Jira, Splunk y PagerDuty.
Pros and Cons
Pros:
- Eficaz para la resolución de problemas y obtención de información operativa
- Archivado de datos integral con soporte para AWS S3
- Las capacidades de AIOps reducen la fatiga de alertas
Cons:
- Opciones limitadas de personalización para tableros e informes
- Curva de aprendizaje pronunciada para configuraciones complejas
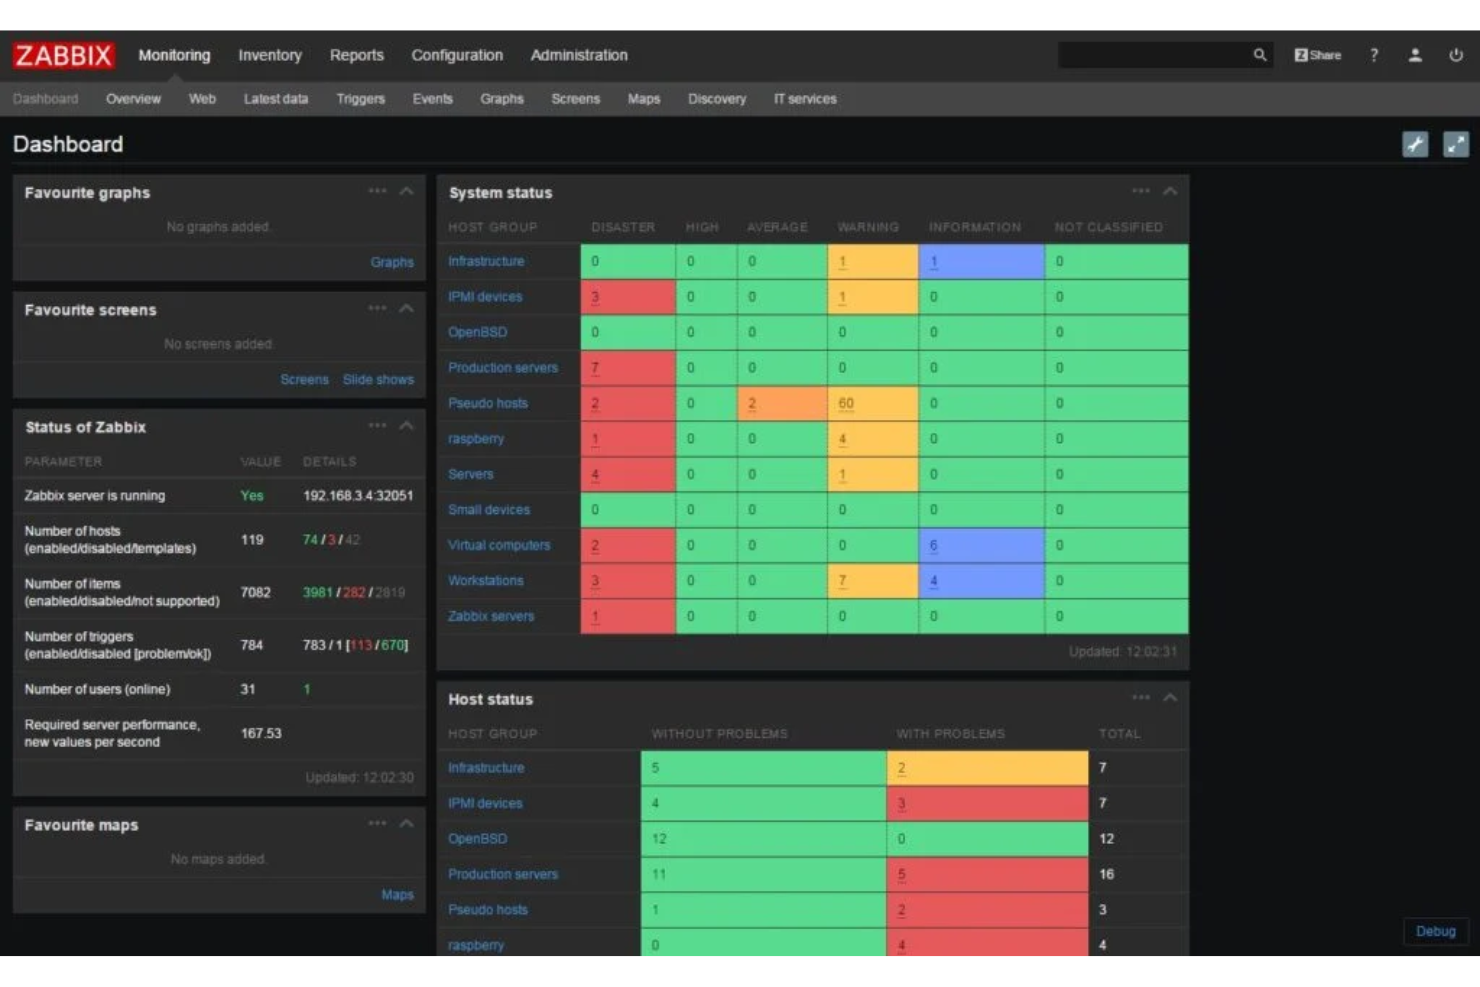
Zabbix Cloud Monitoring es una herramienta robusta que ofrece seguimiento en tiempo real de servidores, máquinas virtuales y servicios en la nube. Conocida por ser de código abierto, destaca como la mejor opción para organizaciones que buscan personalización y rentabilidad.
Por qué elegí Zabbix Cloud Monitoring:
Elegí Zabbix por su naturaleza de código abierto que permite posibilidades de personalización y por su alcance integral de monitoreo que incluye servidores, máquinas virtuales y servicios en la nube. Destaca por su carácter flexible, lo que te permite modificarlo según necesidades específicas.
Por lo tanto, se gana la etiqueta de ser el 'Mejor para' monitoreo en la nube de código abierto, sirviendo a quienes valoran la flexibilidad y un enfoque práctico.
Funciones destacadas e integraciones:
Zabbix sobresale en el descubrimiento de redes, ofreciendo detección automatizada de dispositivos y configuraciones de red. Proporciona herramientas de visualización de datos avanzadas que te ayudan a entender las estadísticas de monitoreo de un vistazo. Como herramienta de código abierto, Zabbix se integra con una amplia gama de otros sistemas, incluyendo MySQL, PostgreSQL e IBM DB2.
Pros and Cons
Pros:
- Código abierto, ofrece posibilidades de personalización
- Amplia variedad de integraciones
- Funciones de monitoreo integrales
Cons:
- Curva de aprendizaje pronunciada para usuarios no técnicos
- La configuración puede ser compleja
- El soporte de pago es relativamente caro
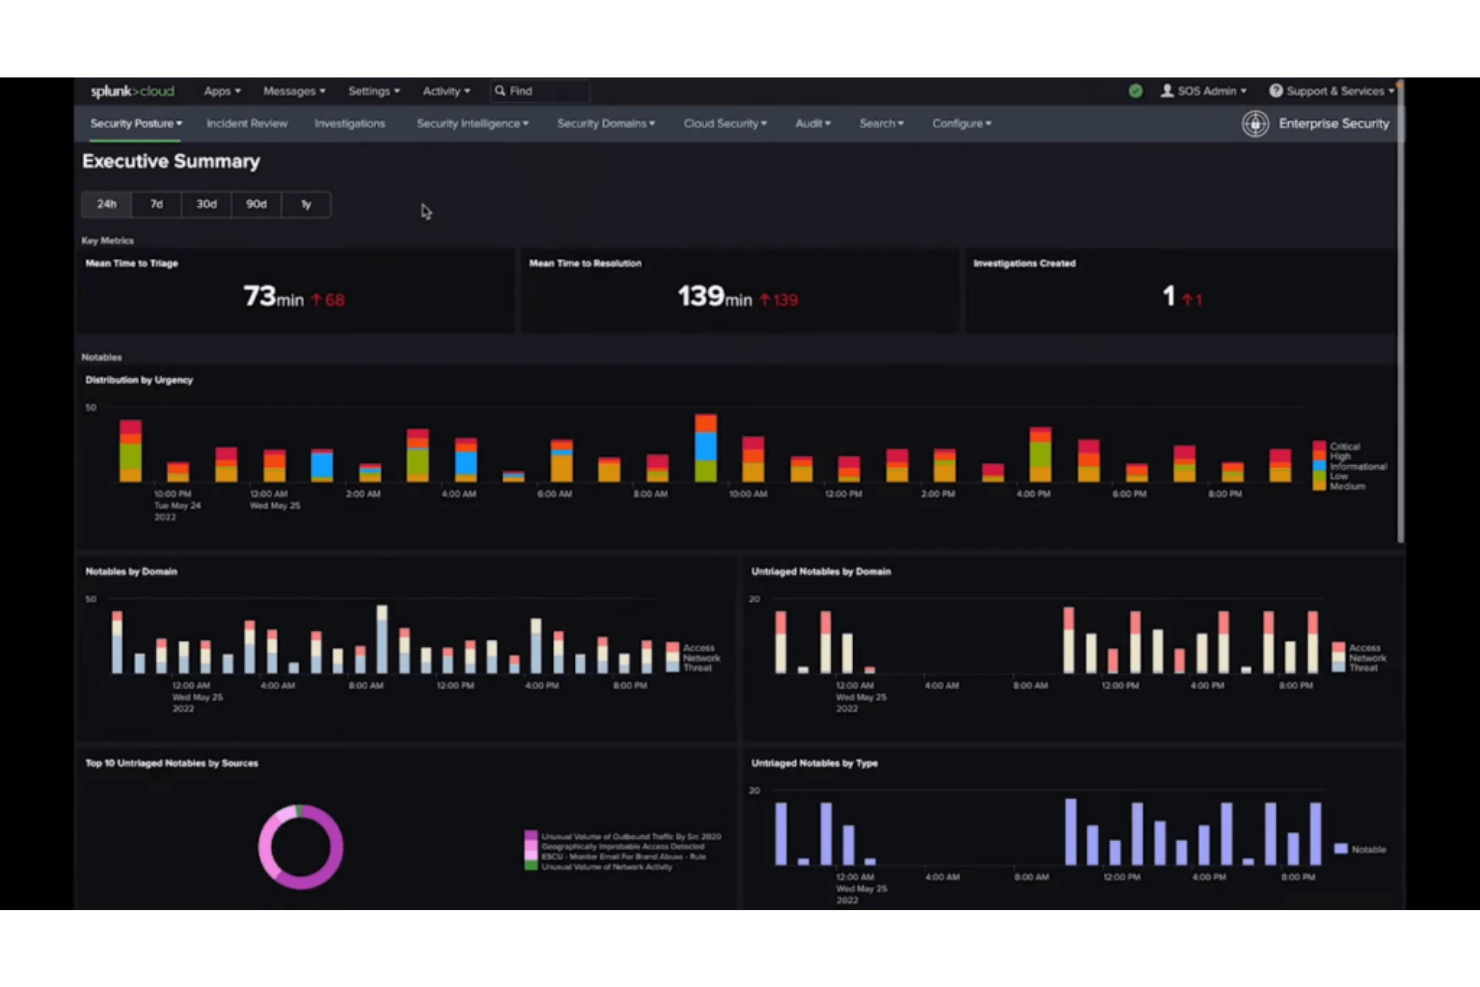
Splunk Infrastructure Monitoring es una herramienta que ofrece análisis y observabilidad en tiempo real para infraestructuras en la nube y microservicios. Como una plataforma reconocida por su velocidad y eficiencia, es la opción preferida para empresas que requieren obtener información instantánea sobre el rendimiento de su nube.
Por qué elegí Splunk Infrastructure Monitoring:
Seleccioné Splunk Infrastructure Monitoring debido a sus sólidas capacidades para proporcionar información en tiempo real, lo que la destaca en el ámbito de la observabilidad.
Es la riqueza de estos análisis lo que me llevó a considerarla la 'Mejor para' observabilidad en tiempo real, especialmente útil para empresas que exigen un conocimiento inmediato de sus operaciones en la nube.
Funciones destacadas y integraciones:
Splunk Infrastructure Monitoring cuenta con una arquitectura de transmisión en tiempo real que le permite ofrecer información inmediata. También incluye funciones como la generación instantánea de líneas base dinámicas y la detección de anomalías, lo que posibilita la identificación proactiva de problemas.
Las principales integraciones incluyen aquellas con AWS, Google Cloud y Azure, lo que le permite supervisar entornos multicloud sin inconvenientes.
Pros and Cons
Pros:
- Ofrece observabilidad en tiempo real
- Incluye funciones para la detección proactiva de problemas
- Se integra bien con las principales plataformas cloud
Cons:
- Puede ser caro para pequeñas empresas
- Interfaz compleja que puede requerir curva de aprendizaje
- Almacenamiento limitado de datos históricos

ThousandEyes es una herramienta integral que ofrece una visibilidad profunda en las rutas de red. Destaca por mapear rutas de red, descubrir cuellos de botella de rendimiento y mantener una vigilancia constante sobre el estado de todos los caminos de red, lo que la convierte en la mejor opción para obtener una visibilidad completa de cada ruta de red.
Por qué elegí ThousandEyes:
Incluí ThousandEyes en mi selección debido a su enfoque único en la visibilidad total de la red. Es distinta en su método de monitoreo, ya que brinda información de extremo a extremo sobre todos los caminos de red, y no solo sobre componentes limitados.
La considero la mejor para obtener visibilidad en cada ruta de red gracias a su excepcional capacidad para iluminar toda la red, revelando posibles problemas y permitiendo soluciones rápidas.
Características destacadas e integraciones:
ThousandEyes se distingue con funciones como la visualización de rutas, que proporciona una vista clara de toda la red, y su capacidad para monitorear el rendimiento de ISPs, CDN, DNS y más. Se integra fácilmente con varias plataformas, incluyendo el intercambio de datos con herramientas como Slack, PagerDuty y ServiceNow, así como capacidades de importación/exportación de datos para un análisis más profundo.
Pros and Cons
Pros:
- Ofrece visibilidad profunda en todos los caminos de red
- Función de visualización de rutas para un mapeo claro de la red
- Amplia variedad de integraciones útiles
Cons:
- La interfaz puede ser algo compleja para principiantes
- El modelo de precios personalizados puede no encajar en todos los presupuestos
- Carece de algunas funciones avanzadas de detección de anomalías basadas en IA
Otras herramientas de monitorización de infraestructura en la nube
A continuación tienes una lista de herramientas adicionales de monitorización de infraestructura en la nube que consideré, pero que no llegaron al top 10.
- meshIQ
Mejor para el monitoreo y la gestión de middleware
- Dynatrace
Mejor para monitorización asistida por inteligencia artificial
- Checkmk
Mejor para monitoreo integral de infraestructura de TI
- Datadog
Mejor para observabilidad full-stack
- Dotcom Monitor
Ideal para monitoreo basado en agentes y sin agentes


Reseñas de software relacionadas
Si aún no has encontrado lo que buscas aquí, echa un vistazo a estas herramientas alternativas que hemos probado y evaluado.
- Software de monitorización de red
- Software de monitorización de servidores
- Soluciones SD-WAN
- Herramientas de monitorización de infraestructura
- Analizadores de paquetes
- Herramientas de monitorización de aplicaciones
Cómo evalúo las herramientas de monitoreo de infraestructura en la nube
Cuando evalúo estas herramientas, pienso en dos niveles: los requisitos básicos y los diferenciadores que separan lo bueno de lo excelente.
Funcionalidades básicas (requisitos imprescindibles para esta lista)
Estas capacidades esenciales sirven como criterios de aceptación para la inclusión en mi lista:
- Monitoreo de recursos multi-nube: Verifico si una herramienta tiene integraciones nativas con AWS, Azure y GCP, y cuántos servicios cubre cada proveedor de manera predeterminada.
- Métricas en tiempo real y paneles: La granularidad importa aquí. Busco sondeos de intervalo menor al minuto y paneles personalizables que los equipos puedan adaptar a clústeres o regiones específicas.
- Alertas y detección de anomalías: Evalúo cómo se configuran las alertas, qué canales de notificación se soportan y si la herramienta ofrece umbrales dinámicos además de reglas estáticas.
- Correlación de logs y eventos: Conectar un pico de CPU con un despliegue fallido es la verdadera prueba. Busco vistas unificadas que vinculen logs y eventos con las líneas de tiempo de métricas.
- Visibilidad de contenedores y orquestación: Reviso métricas a nivel de clúster, nodo, pod y carga de trabajo en plataformas de orquestación.
- Auto-descubrimiento y mapeo de topología: Las nuevas instancias se generan constantemente—evalúo si la herramienta las detecta automáticamente y mapea las dependencias sin intervención manual.
Califico a cada proveedor en una escala del 0 (no ofrece la funcionalidad) al 5 (sobresale en este aspecto) para cada criterio.
Los proveedores deben alcanzar un puntaje promedio mínimo para ser considerados en mi lista. A partir de ahí, considero qué distingue a cada plataforma.
Factores diferenciadores (lo que distingue a los proveedores)
Una vez que he seleccionado mi lista, así es como comparo y contrasto los diferentes proveedores en este sector:
Características destacadas
Busco análisis de causa raíz impulsados por IA que ayuden a los equipos a filtrar el ruido durante las respuestas a incidentes al priorizar alertas procesables. Herramientas que ofrecen una observabilidad profunda de costos permiten a los equipos de DevOps y SRE relacionar el rendimiento de la infraestructura con el gasto en la nube, lo cual es crucial para organizaciones enfocadas en FinOps. El trazado distribuido y el APM de extremo a extremo son especialmente valiosos cuando se necesita conectar datos de infraestructura de bajo nivel con experiencias a nivel de aplicación, lo que facilita la solución rápida de problemas en entornos de microservicios.
Más allá de las funcionalidades
La transparencia en los precios es un gran diferenciador en este campo. Evalúo si los proveedores cobran por host, volumen de datos o métricas personalizadas—y cuán predecibles se mantienen los costos a medida que escalas. La amplitud del ecosistema de integraciones también es importante. Verifico soporte para OpenTelemetry y conexiones nativas con herramientas ITSM y CI/CD como ServiceNow y Jenkins, ya que el monitoreo rara vez vive en aislamiento. Para industrias reguladas, reviso certificaciones de cumplimiento como SOC 2 Tipo II, HIPAA y FedRAMP, junto con capacidades de RBAC y registros de auditoría.
Cómo elegir herramientas de monitorización de infraestructura en la nube
Es fácil perderse entre interminables listas de funciones y estructuras de precios complejas. Para ayudarte a mantenerte enfocado durante el proceso de selección de software, aquí tienes una lista de factores clave que debes tener en cuenta:
| Factor | Qué considerar |
|---|---|
| Escalabilidad | Asegúrate de que la herramienta pueda manejar las crecientes necesidades de infraestructura. Tu solución de monitoreo debe escalar a medida que tu entorno en la nube se expanda, añadiendo nuevas instancias y servicios sin problemas de rendimiento. |
| Integraciones | Busca una herramienta que se integre con tus proveedores de nube actuales (AWS, Azure, GCP) y servicios de terceros (como Slack, Jira). Esto ayuda a centralizar los datos de monitoreo y automatizar las alertas. |
| Personalización | Elige una solución que te permita crear paneles, informes y alertas personalizados para adaptarse a las necesidades y flujos de trabajo específicos de tu equipo. La flexibilidad en la visualización de datos es clave. |
| Facilidad de uso | Una interfaz fácil de usar reduce la curva de aprendizaje y agiliza la resolución de problemas. Asegúrate de que la herramienta sea intuitiva tanto para desarrolladores como para usuarios no técnicos. |
| Presupuesto | Revisa la estructura de precios por posibles costos ocultos como retención de datos, soporte premium o integraciones adicionales. Compara los diferentes niveles de precios para evitar pagar de más. |
| Salvaguardas de seguridad | Asegúrate de que la herramienta ofrezca cifrado, control de acceso basado en roles y conexiones API seguras para proteger los datos sensibles de la infraestructura. El cumplimiento de estándares del sector (como SOC 2) es una ventaja. |
| Automatización | Busca funciones de automatización como detección de anomalías, autorremediación y optimización de rendimiento para reducir el trabajo manual y mejorar la eficiencia. |
| Alertas en tiempo real | Asegúrate de que la herramienta proporcione alertas y notificaciones en tiempo real a través de múltiples canales (correo electrónico, Slack, etc.) para responder rápidamente a los problemas. |
Tendencias en herramientas de monitoreo de infraestructuras en la nube
En mis investigaciones, analicé innumerables actualizaciones de productos, comunicados de prensa y registros de lanzamiento de diferentes proveedores de herramientas de monitoreo de infraestructura en la nube. Aquí algunas de las tendencias emergentes que estoy vigilando:
- Inteligencia impulsada por IA: Cada vez más herramientas utilizan inteligencia artificial y aprendizaje automático para predecir fallos, detectar anomalías y sugerir soluciones antes de que los problemas se agraven. Esto ayuda a los equipos a ser proactivos en vez de reactivos.
- Seguimiento granular de costos: Ahora, las herramientas de monitoreo proporcionan conocimientos más profundos sobre el gasto en la nube, ayudando a los equipos a identificar desperdicio y optimizar la asignación de recursos. Algunas incluso ofrecen recomendaciones automáticas para ahorrar costos.
- Observabilidad unificada: Los proveedores están combinando el monitoreo de infraestructura, aplicaciones y redes en una sola plataforma. Esto ofrece a los equipos una visión completa de su entorno sin cambiar entre herramientas.
- Monitoreo de edge: A medida que más cargas de trabajo se trasladan al edge, las herramientas se expanden para monitorear dispositivos y microservicios en el edge. Esto ayuda a los equipos a mantener el rendimiento y la disponibilidad en entornos distribuidos.
- Monitoreo de seguridad mejorado: Las herramientas están añadiendo funciones de detección de amenazas en tiempo real y registros de seguridad. Algunas ya integran plataformas SIEM (Gestión de Información y Eventos de Seguridad) para una respuesta más rápida a incidentes.
¿Qué son las herramientas de monitoreo de infraestructuras en la nube?
Las herramientas de monitoreo de infraestructuras en la nube proporcionan una forma automatizada de supervisar los procesos operativos dentro de una infraestructura de TI basada en la nube. Utilizadas principalmente por profesionales de TI, ingenieros de redes y administradores de sistemas, estas herramientas son invaluables para rastrear el estado, el rendimiento y la salud de servidores, bases de datos, redes y servicios de aplicaciones alojados en la nube.
Cumplen una función crítica al identificar rápidamente problemas, prevenir posibles interrupciones y asegurar el buen funcionamiento de las operaciones empresariales. Estas herramientas de monitoreo ofrecen información y análisis que ayudan a optimizar los recursos, desempeñando así un papel fundamental en la toma de decisiones estratégicas y mejorando el rendimiento general del sistema.
Características de las herramientas de monitoreo de infraestructuras en la nube
Al seleccionar herramientas de monitoreo de infraestructuras en la nube, presta atención a las siguientes características clave:
- Monitoreo en tiempo real: Proporciona visibilidad instantánea sobre el rendimiento de la infraestructura, ayudándote a detectar y resolver problemas rápidamente.
- Paneles personalizados: Permite crear vistas personalizadas de los indicadores clave, facilitando el seguimiento de lo que más importa a tu equipo.
- Detección de anomalías: Utiliza aprendizaje automático y software de monitoreo de registros para identificar patrones inusuales y señalar posibles problemas antes de que afecten el rendimiento.
- Alertas y notificaciones: Envía avisos a través de múltiples canales (correo electrónico, Slack, etc.) para notificar a tu equipo de los problemas en tiempo real.
- Agregación de registros: Recopila y organiza registros de diferentes sistemas, lo que facilita la solución de problemas y la identificación de las causas raíz.
- Seguimiento de costos: Desglosa el gasto en la nube por servicio, región o proyecto, ayudándote a identificar desperdicios y optimizar los costos.
- Control de acceso basado en roles: Te permite definir los permisos de usuario para garantizar que los miembros del equipo solo accedan a los datos que necesitan.
- Análisis de datos históricos: Almacena datos históricos de rendimiento, lo que te permite identificar tendencias y tomar decisiones informadas.
- Soluciones multi-nube: Supervisa la infraestructura a través de diferentes proveedores de nube como AWS, Azure y Google Cloud en una sola plataforma.
- APIs e integraciones: Se conecta con otras herramientas y plataformas para automatizar flujos de trabajo y centralizar datos.
Beneficios de las herramientas de monitoreo de infraestructura en la nube
Implementar herramientas de monitoreo de infraestructura en la nube proporciona varios beneficios para tu equipo y tu empresa. Aquí tienes algunos de los que puedes esperar:
- Mayor tiempo de actividad: Las herramientas de monitoreo ayudan a detectar problemas de rendimiento antes, reduciendo el tiempo de inactividad y manteniendo los servicios disponibles para los usuarios.
- Resolución más rápida de problemas: Las alertas en tiempo real y los registros detallados facilitan que tu equipo identifique y solucione problemas rápidamente.
- Mejor gestión de costos: Las funciones de seguimiento de costes y optimización de recursos te ayudan a evitar el exceso de provisión y reducir el desperdicio.
- Mayor seguridad: La detección de amenazas integrada y el registro de seguridad te permiten detectar vulnerabilidades y responder más rápido ante ataques.
- Toma de decisiones más informada: Los datos históricos y el análisis de tendencias te aportan información sobre patrones de rendimiento y necesidades de recursos.
- Gestión multi-nube simplificada: Los paneles unificados y el soporte multi-nube permiten monitorear diferentes entornos de nube desde un solo lugar.
- Mejor colaboración en equipo: El acceso basado en roles y los paneles compartidos garantizan que todos los miembros de tu equipo tengan los datos necesarios para tomar decisiones.
Costos y precios de las herramientas de monitoreo de infraestructura en la nube
Seleccionar herramientas de monitoreo de infraestructura en la nube requiere comprender los distintos modelos y planes de precios disponibles. Los costos varían según las características, el tamaño del equipo, complementos y más. La siguiente tabla resume los planes comunes, sus precios promedio y las características típicas incluidas en las herramientas de monitoreo de infraestructura en la nube:
Tabla comparativa de planes para herramientas de monitoreo de infraestructura en la nube
| Tipo de plan | Precio promedio | Características comunes |
|---|---|---|
| Plan gratuito | $0 | Herramientas básicas de monitoreo de rendimiento, alertas limitadas, soporte comunitario e integración con una sola nube. |
| Plan personal | $10–$30/usuario/mes | Seguimiento de rendimiento, alertas en tiempo real, análisis básico de registros y acceso de un solo usuario. |
| Plan para empresas | $40–$100/usuario/mes | Soporte multi-nube, detección avanzada de anomalías, paneles personalizados y permisos basados en equipos. |
| Plan empresarial | $150–$500/usuario/mes | Información basada en IA, remediación automática, monitoreo de seguridad, administrador de cuenta dedicado y seguimiento de compliance. |
Preguntas frecuentes sobre herramientas de monitoreo de infraestructura en la nube
Aquí tienes algunas respuestas a preguntas comunes sobre las herramientas de monitoreo de infraestructura en la nube:
¿Cómo gestionan estas herramientas el monitoreo en entornos multi-nube?
Muchas herramientas de monitoreo de infraestructura en la nube admiten entornos multi-nube, lo que te permite supervisar recursos a través de diferentes proveedores como AWS, Azure y Google Cloud desde una sola plataforma. Este enfoque unificado ayuda a tu equipo a mantener una supervisión constante y simplifica la gestión.
¿Pueden estas herramientas integrarse con los flujos de trabajo DevOps existentes?
Sí, la mayoría de las herramientas de monitoreo ofrecen integraciones con populares u003ca href=u0022https://thectoclub.com/tools/best-devops-monitoring-tools/u0022u003eherramientas de monitoreo para DevOpsu003c/au003e como Jenkins, GitHub y Slack. Estas integraciones permiten a tu equipo incorporar los datos de monitoreo en los flujos de trabajo actuales, mejorando la colaboración y agilizando los procesos.
¿Cómo ayudan estas herramientas a optimizar los costos en la nube?
Muchas herramientas de monitoreo ofrecen funciones que rastrean el uso de los recursos e identifican aquellos infrautilizados. Analizando estos datos, puedes tomar decisiones informadas para optimizar el gasto en la nube y asignar los recursos de manera más eficiente.
¿Qué funciones de seguridad suelen incluir estas herramientas?
Las funciones de seguridad suelen incluir detección de amenazas en tiempo real, evaluaciones de vulnerabilidades y monitoreo de cumplimiento. Estas capacidades ayudan a tu equipo a identificar y abordar rápidamente posibles problemas de seguridad, manteniendo la integridad de tu infraestructura.
¿Qué tan personalizables son los paneles y los informes en estas herramientas?
La mayoría de las herramientas ofrecen paneles de control e informes personalizables, permitiéndote adaptar la visualización de métricas y análisis a las necesidades específicas de tu equipo. Esta flexibilidad asegura que puedas centrarte en los datos más relevantes para tus operaciones.
¿Estas herramientas admiten respuestas automatizadas a incidencias detectadas?
Sí, muchas herramientas de monitoreo soportan funciones de automatización que pueden desencadenar acciones predefinidas en respuesta a alertas o anomalías específicas. Esta automatización ayuda a tu equipo a resolver incidencias rápidamente, reduciendo el tiempo de inactividad y mejorando la fiabilidad del sistema.
¿Qué sigue?
Si te encuentras investigando herramientas de monitoreo de infraestructura en la nube, conéctate con un asesor de SoftwareSelect para obtener recomendaciones gratuitas.
Solo tienes que completar un formulario y tener una breve conversación donde se indagan en los detalles de tus necesidades. Luego recibirás una lista corta de software para revisar. Incluso te acompañarán durante todo el proceso de compra, incluidas las negociaciones de precio.