14 Best System Monitoring Tools Reviewed in 2026

10 Best System Monitoring Tool Shortlist


System monitoring tools help you track the health and performance of your infrastructure so you can catch and fix problems before they impact users.
Many teams turn to these tools when they’re struggling with unexpected outages, slow systems, or limited visibility into network activity. Without the right solution, it’s hard to know what’s going wrong or even where to look.
I’ve worked with SaaS and MSP teams to evaluate and implement monitoring platforms that reduce downtime and speed up response times. This guide shares what I’ve learned to help you find a tool that fits your system and your workflow.
Why Trust Our Software Reviews
We’ve been testing and reviewing software since 2023. As tech leaders ourselves, we know how critical and difficult it is to make the right decision when selecting software.
We invest in deep research to help our audience make better software purchasing decisions. We’ve tested more than 2,000 tools for different tech use cases and written over 1,000 comprehensive software reviews. Learn how we stay transparent & our software review methodology.
Best System Monitoring Tools Summary
This comparison chart summarizes pricing details for my top system monitoring tool selections to help you find the best one for your budget and business needs.
| Tool | Best For | Trial Info | Price | ||
|---|---|---|---|---|---|
| 1 | Best for remote monitoring and management | 30-day free trial + free demo available | From $129/technician/month (billed annually) | Website | |
| 2 | Best with integrated IT asset management | 14-day free trial + free demo available | From $19/agent/month (billed annually) | Website | |
| 3 | Best for end-to-end complex IT monitoring | Free plan + 30-day free trial available | From $275/month (billed annually) | Website | |
| 4 | Best for real-time error tracking | Free plan + free trial + free demo available | From $26/month (billed annually) | Website | |
| 5 | Best for simple, centralized system monitoring | 30-day free trial | From $179/month (billed annually) | Website | |
| 6 | Best for AI-driven full-stack monitoring | Free demo + 15-day free trial available | From $7/host/month | Website | |
| 7 | Best for application performance metrics | 14-day free trial available | From $15/host/month (billed annually) | Website | |
| 8 | Best for full-stack infrastructure monitoring | 30-day free trial + free demo available | From $10/month (billed annually) | Website | |
| 9 | Best for distributed network monitoring | Free demo available | From $245/25 devices | Website | |
| 10 | Best for scalable monitoring solutions | Free download available | From $325/month (billed annually) | Website |


-

TestDevLab
Visit Website -
Site24x7
Visit WebsiteThis is an aggregated rating for this tool including ratings from Crozdesk users and ratings from other sites.4.7 -
GitHub Actions
Visit WebsiteThis is an aggregated rating for this tool including ratings from Crozdesk users and ratings from other sites.4.8


Best System Monitoring Tools Reviews
Below are my detailed summaries of the best system monitoring tools that made it onto my shortlist. My reviews offer a detailed look at the key features, pros & cons, integrations, and ideal use cases of each tool to help you find the best one for you.

Atera is an all-in-one IT management platform built for managed service providers and IT departments who need to monitor, manage, and support endpoints and networks from a single dashboard.
Who Is Atera Best For?
Atera is a strong fit for MSPs and internal IT teams that manage multiple endpoints across distributed environments.
Why I Picked Atera
I picked Atera as one of the best for remote monitoring and management because its RMM agent provides real-time visibility across distributed endpoints. The agent continuously tracks CPU, RAM, disk usage, network bandwidth, and Windows events, and it goes online in about 1.2 seconds, reducing delay when a device needs attention. Atera's alert management lets you set custom thresholds and receive instant notifications before issues impact users, offering a proactive approach for managing devices across multiple sites. Built-in remote access options—Splashtop, AnyDesk, TeamViewer, and ScreenConnect—let my team start remote sessions without switching between tools.
Atera Key Features
- IT automation: Schedule and run automated scripts across devices for tasks like onboarding, software deployment, and routine maintenance.
- SNMP monitoring: Track routers, firewalls, printers, and other network devices using automatic OID monitoring on Linux-based systems.
- Patch management: Automate Windows, macOS, and Linux software patches across all managed endpoints from a single dashboard.
- AI Copilot: Get AI-generated issue summaries and suggested resolutions to move from alert to fix faster during active incidents.
Atera Integrations
Integrations include Splashtop, TeamViewer, AnyDesk, ScreenConnect, Webroot, Bitdefender, Acronis, QuickBooks, Xero, and Domotz.
Pros and Cons
Pros:
- Consolidates IT management into a single platform, simplifying operations.
- Built-in asset and software inventory gives visibility into hardware and software deployments.
- Threshold alerts and remote maintenance tools reduce response time for device incidents.
Cons:
- Less granular control for highly complex custom workflows or integrations.
- Project management and complex SLA tracking are relatively limited.
New Product Updates from Atera

Atera Adds SNMP Scanning and AI-Powered Monitoring Updates
Atera has added dedicated SNMP scanning, AI-powered monitoring, and improved scan controls to simplify device management. These updates help teams discover devices and configure network monitoring faster. For more information, visit Atera’s official site.
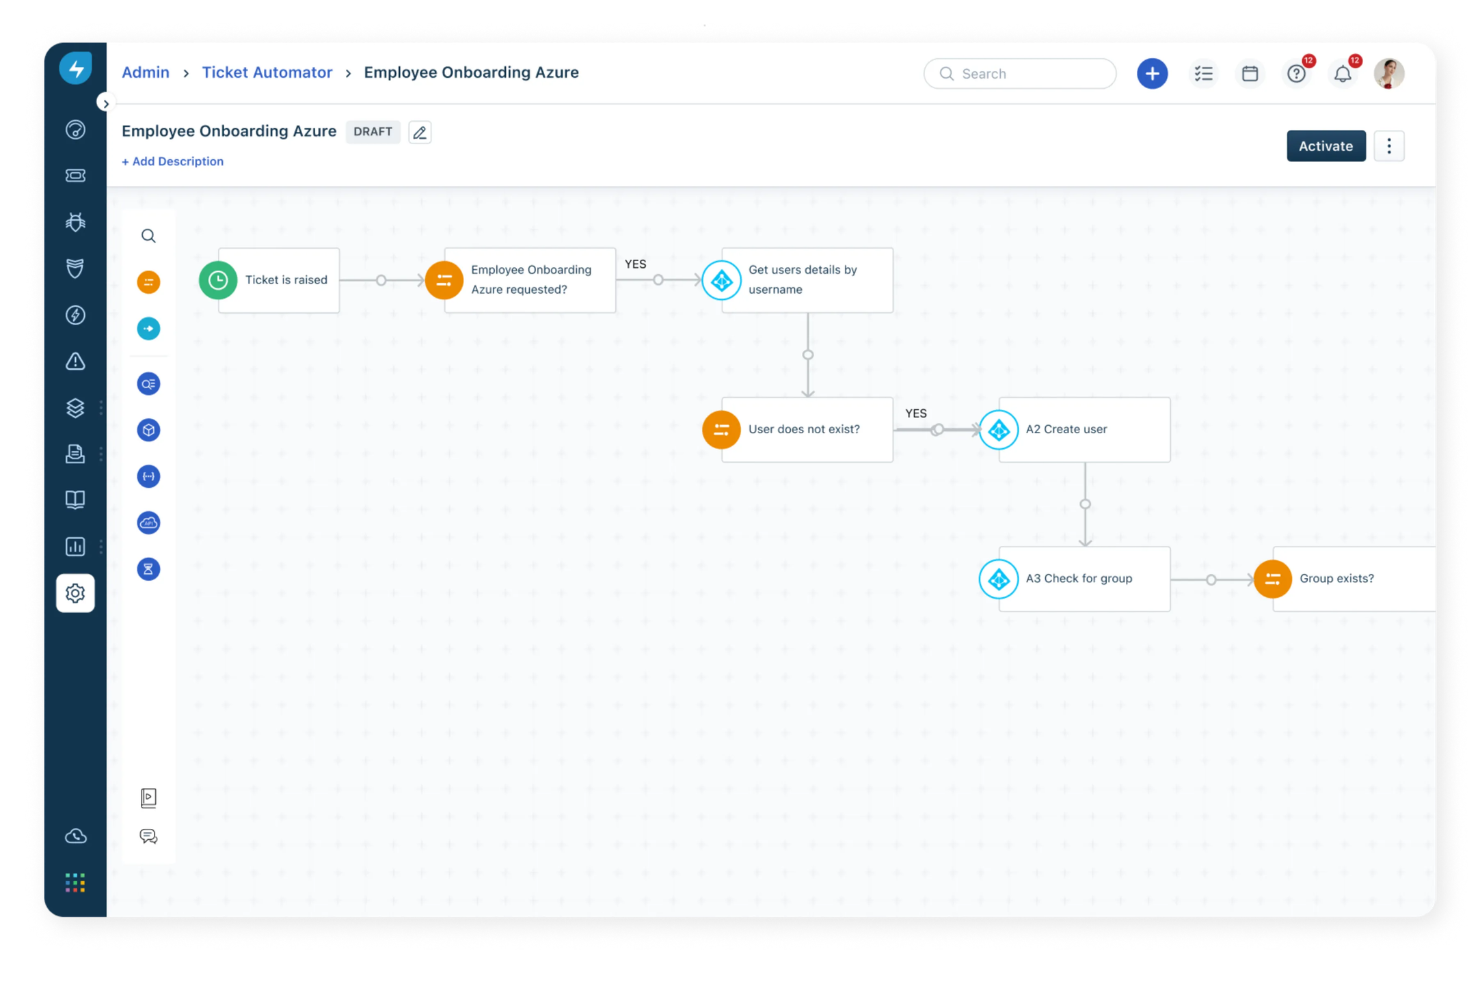
Freshservice is an IT service management platform that also supports system monitoring through its ITOM capabilities. It’s not a dedicated monitoring tool, but it works well for teams that want to bring alerts, service health, asset data, and incident workflows into one place. Instead of focusing on deep infrastructure metrics, it helps teams understand what an alert means in the context of their services and systems.
Who Is Freshservice Best For?
Freshservice suits IT teams in mid-sized to large organizations that already run a service desk and want to connect monitoring signals with incident management, asset tracking, and change workflows. It’s especially useful for teams managing internal IT services or distributed environments where understanding impact matters as much as detecting issues.
Why I Picked Freshservice
I picked Freshservice because it adds useful context to monitoring data once an alert comes in. Being able to link incidents to specific assets and see how those assets relate to other systems through the CMDB makes it easier to understand what’s actually affected and respond accordingly. It’s a good fit for teams that need to coordinate response, not just detect problems.
Freshservice Key Features
- Automated alerting: Get real-time notifications for incidents and system events.
- Customizable dashboards: Build visual dashboards to monitor key metrics and system health.
- Service request management: Track and manage IT service requests from a unified interface.
- Change management module: Plan, approve, and document changes to your IT environment.
Freshservice Integrations
Freshservice offers native integrations with Microsoft Teams, SecPod, Slack, TeamViewer, Jira, and Azure AD. Connector apps and APIs are available for custom integrations and workflow automations.
Pros and Cons
Pros:
- Connects alerts with incidents, assets, and service context
- Useful for teams that want monitoring tied into ITSM workflows
- Strong CMDB and asset tracking compared to most monitoring tools
Cons:
- Not a full-featured monitoring platform for logs, traces, or deep infrastructure metrics
- Relies on integrations for most monitoring data collection
New Product Updates from Freshservice
 Experience)
Freshservice Introduces a Reimagined IT Asset Management (ITAM) Experience
Freshservice introduces a reimagined IT Asset Management (ITAM) experience with continuous infrastructure discovery, dependency mapping, IPAM, and Software License Management. This update helps teams improve asset visibility and manage connected IT environments more effectively. For more information, visit Freshservice’s official site.
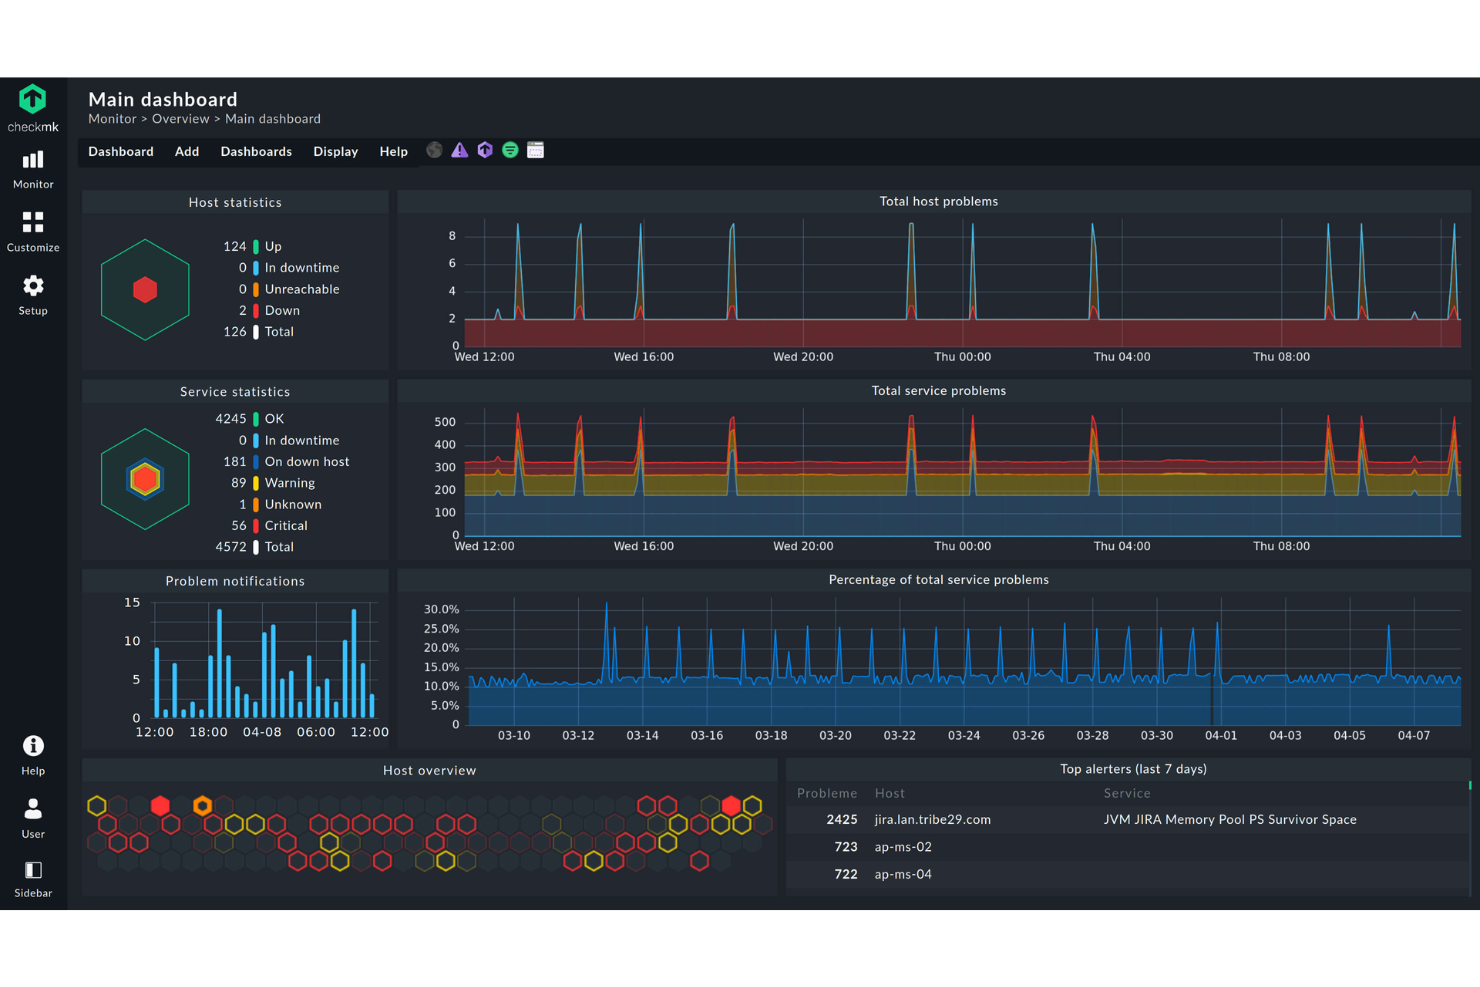
Checkmk is a monitoring platform built for IT teams and managed service providers who need to track servers, networks, applications, and cloud resources across complex environments, helping them detect issues promptly and maintain system health.
Who Is Checkmk Best For?
Checkmk is a strong fit for mid-size to large IT teams and MSPs managing hybrid or multi-cloud environments with a high volume of monitored hosts.
Why I Picked Checkmk
Checkmk earns its spot on my shortlist because it genuinely covers end-to-end monitoring across the full IT stack—servers, networks, containers, cloud services, and business processes—without requiring separate tools for each layer. I particularly like its auto-discovery feature, which automatically detects hosts and services and recommends relevant metrics and thresholds, so my team isn't spending hours on manual configuration in large environments. The business process monitoring capability is also something I find hard to replicate elsewhere—it lets you map application dependencies into a single aggregated view and even simulate worst-case failure scenarios in real time. On top of that, the distributed architecture scales to hundreds of sites and millions of devices, which matters when you're managing infrastructure that spans multiple data centers or regions.
Checkmk Key Features
- Log monitoring: Collects and filters events from syslog, SNMP traps, Windows event logs, and log files, collapsing duplicate entries to reduce alert noise.
- Predictive analytics: Analyzes historical data to forecast resource consumption and dynamically adjusts thresholds based on past events.
- Hardware and software inventory: Automatically identifies and tracks all hardware and software assets, monitoring changes and integrating data into your CMDB view.
- Customizable dashboards: Provides out-of-the-box and fully customizable dashboards for AWS, Azure, Linux, Windows, and Kubernetes environments, with interactive HTML5 graphs.
Checkmk Integrations
Integrations include AWS, Azure, Google Cloud Platform, VMware vSphere, Docker, Kubernetes, Microsoft SQL Server, Oracle Database, SAP HANA, and Cisco.
Pros and Cons
Pros:
- Flexible monitoring options that support custom setups
- Real-time dashboard updates for better infrastructure visibility
- Supports tailored monitoring configurations for complex environments
Cons:
- Interface may feel confusing at first
- Limited guidance and documentation for beginners

Sentry lets developers and IT teams monitor, diagnose, and resolve application errors and performance issues across web, mobile, and backend systems, helping you catch problems before they impact users.
Who Is Sentry Best For?
Sentry is a strong fit for software development and DevOps teams who need deep visibility into application health across multiple environments and codebases.
Why I Picked Sentry
I picked Sentry as one of the best because of how it handles real-time error tracking with actual context, not just raw log data. When an error fires in production, Sentry captures the full stack trace, local variables, breadcrumbs, and user actions leading up to the crash—so my team isn't left guessing what happened. I also like the release health monitoring, which tracks crash-free session rates and version adoption in real time, so you can spot the moment a new deploy starts degrading. Seer, Sentry's AI debugging agent, analyzes stack traces, logs, and commit history to automatically pinpoint root causes and suggest fixes—cutting down the time between "something broke" and "here's why."
Sentry Key Features
- Distributed tracing: Follow a single request across multiple services with waterfall trace views that pinpoint exactly where latency or errors are introduced.
- Custom metrics and span monitoring: Define and track performance indicators specific to your app, like slow database queries or unresponsive API calls, down to the code level.
- User impact prioritization: Automatically surface issues affecting the largest number of users so your team can triage what to fix first.
- Distributed log correlation: Link logs directly to the specific traces and issues causing performance drops, replacing manual log searches.
Sentry Integrations
Integrations include GitHub, Jira, Slack, GitLab, Microsoft Teams, PagerDuty, Bitbucket, Discord, Asana, and Datadog.
Pros and Cons
Pros:
- Integrates with many popular development and communication tools
- Contextual data assists in replicating and resolving issues
- Detailed stack traces provide precise error locations
Cons:
- Some users have mentioned a desire for more flexible alerting options
- Larger teams might find the need to upgrade for more events
- Might be overwhelming for beginners due to its extensive features
New Product Updates from Sentry

Sentry Adds Log Export in CSV and JSONL
Sentry now supports exporting up to 10,000 log lines from Explore → Logs in CSV or JSON Lines, with downloads available in-browser or as background downloads and email. For more information, visit Sentry's official site.
 .
.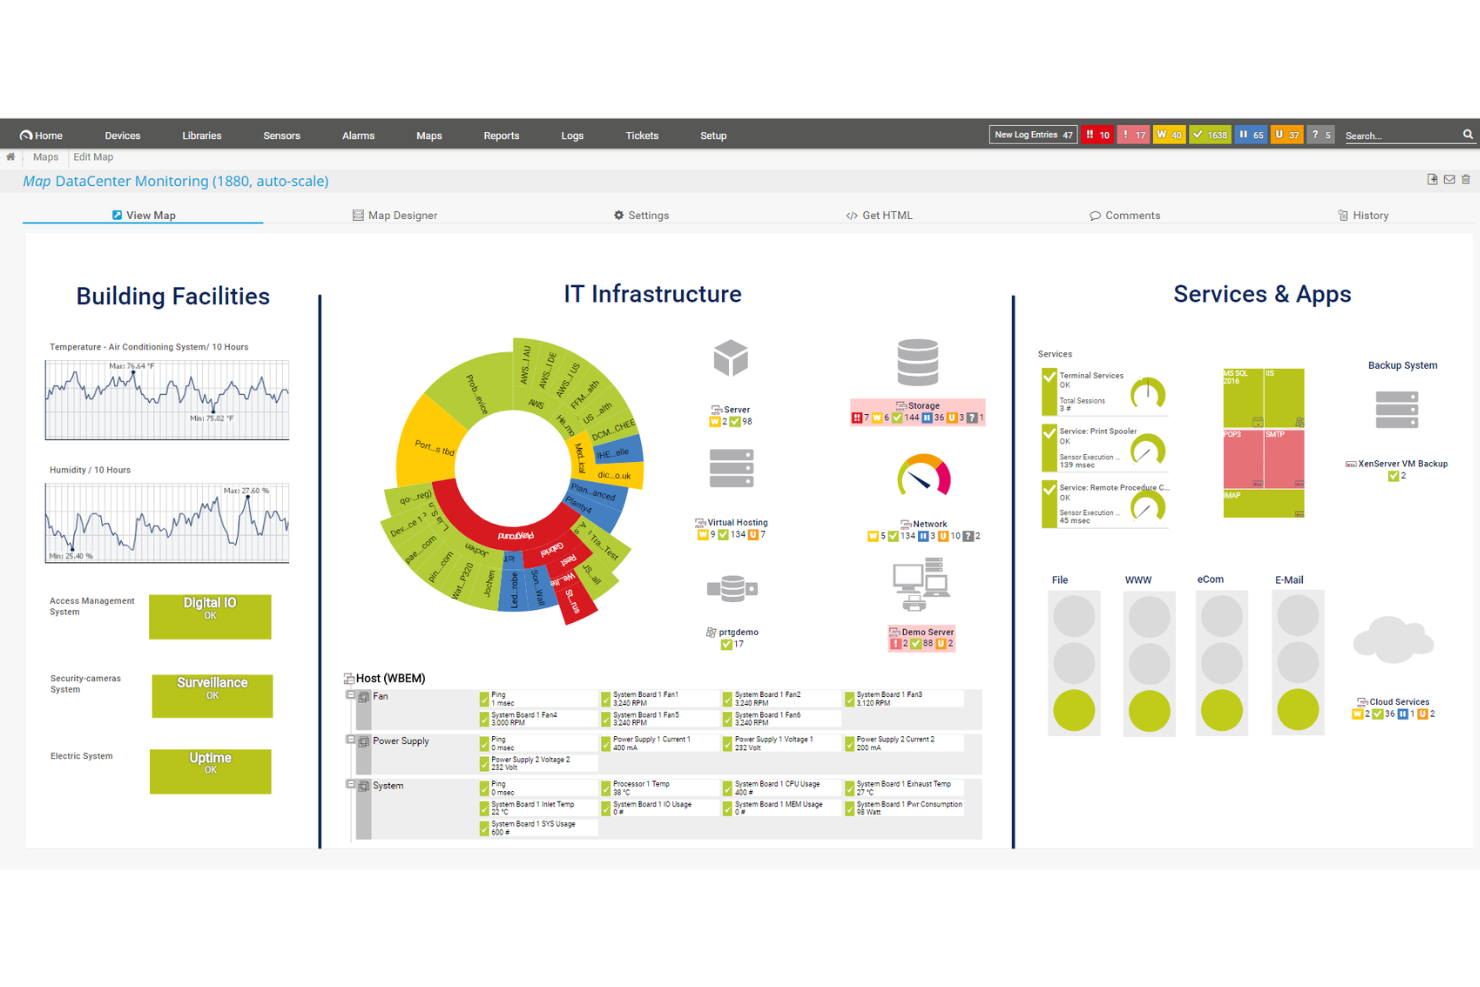
PRTG gives IT teams and system administrators a unified platform to monitor networks, servers, and applications, helping businesses of all sizes detect issues and maintain reliable infrastructure.
Who Is PRTG Best For?
PRTG is a good fit for IT teams in small to mid-sized businesses that need a straightforward way to monitor their entire infrastructure from one place.
Why I Picked PRTG
PRTG earns its spot on my shortlist because of how well it pulls everything into one place without requiring a complex setup. I like that its auto-discovery feature scans your network and automatically configures sensors for detected devices, so my team isn't spending hours manually adding servers, switches, and endpoints. The library of over 250 pre-configured sensors covers everything from SNMP traffic and CPU load to VMware environments and MQTT-based IoT devices. On top of that, the distributed monitoring feature lets me manage remote locations and branch offices through a single dashboard using remote probes, which collect data locally and send it back to a central PRTG installation.
PRTG Key Features
- Custom alerting thresholds: Set specific thresholds for any sensor so PRTG triggers notifications via email, push, SMS, or HTTP request when a metric crosses your defined limit.
- Customizable reporting: Build and schedule reports using customizable templates that pull live sensor data to share infrastructure status with stakeholders.
- AI-driven anomaly detection: PRTG uses AI-based baselines that adapt to your environment to flag unusual behavior without requiring manual threshold configuration.
- Maps and dashboards: Design real-time network maps using a drag-and-drop map designer that displays live device status across your infrastructure.
PRTG Integrations
Integrations include Amazon Web Services (AWS), Microsoft Azure, VMware, Cisco, HPE, Dell, NetApp, IBM, Oracle, and SAP.
Pros and Cons
Pros:
- Scalable to accommodate growing network demands
- Customizable dashboards and real-time alerts
- Supports multiple monitoring technologies
Cons:
- Licensing based on sensors can become expensive for larger networks
- Initial setup can be time-consuming
New Product Updates from PRTG
PRTG Introduces New Monitoring Sensors In Beta
This week, PRTG introduces three BETA sensors that broaden your monitoring scope for Proxmox VE clusters and SIMATIC S7-300/400 PLCs, giving you deeper operational insights. For more information, visit PRTG’s official site.
 .
.
Dynatrace gives IT teams and enterprises a unified platform to monitor infrastructure, applications, and user experience, helping them detect, analyze, and resolve performance issues across complex, modern environments.
Who Is Dynatrace Best For?
Dynatrace is a strong fit for large enterprises and cloud-native organizations running complex, distributed environments that need deep, automated observability across their full technology stack.
Why I Picked Dynatrace
Dynatrace earns its spot on my shortlist because of how its AI engine, Davis, goes beyond alerting to deliver precise root cause analysis automatically. When an incident fires, Davis doesn't just surface a list of anomalies—it traces the causal chain across your full stack and pinpoints the exact source, cutting mean time to recovery significantly. I also like the OneAgent deployment model, where a single agent install on a host continuously collects metrics, traces, logs, and topology data across the entire application delivery chain without manual instrumentation. Smartscape builds a real-time dependency map of your environment, so when something breaks, you already have the context to understand what's affected and why.
Dynatrace Key Features
- PurePath distributed tracing: Captures end-to-end timing and code-level context for every distributed trace across your full stack, without sampling.
- Log analytics: Ingests, indexes, and correlates log data in real time alongside metrics and traces within a single unified view.
- Digital experience monitoring: Tracks real user sessions and synthetic transactions to measure front-end performance across browsers and mobile apps.
- OpenPipeline data ingestion: Processes, enriches, and contextualizes streaming observability data from any source before it reaches storage or analytics.
Dynatrace Integrations
Integrations include AWS, Azure, Google Cloud, Jira, Slack, GitHub Copilot, PagerDuty, JetBrains, Cursor IDE, and Windsurf.
Pros and Cons
Pros:
- Extensive integrations with major cloud platforms
- Offers a holistic view of digital environments, from cloud to user experience
- Davis AI provides real-time autonomous problem detection and diagnosis
Cons:
- Some users might find the initial setup and configuration challenging
- Might be over-comprehensive for smaller businesses or simpler setups
- Absence of transparent pricing might deter potential users

Datadog is a cloud-based monitoring and analytics platform that provides deep insights into the performance of applications. It consolidates metrics, traces, and logs into a unified platform, making it especially potent for application performance monitoring, aligning with its strength in gauging metrics.
Why I Picked Datadog: When determining the best tools for monitoring, Datadog emerged prominently in my analysis. I judged its ability to offer granular, real-time insights into applications as a primary differentiator. Based on the depth and breadth of its capabilities, I found it best suited for application performance metrics.
Standout Features & Integrations:
Datadog is renowned for its APM (Application Performance Monitoring) which offers detailed performance insights and root cause analysis. Its distributed tracing and real-time analytics equip teams to understand bottlenecks in the application workflow. Complementing its core functionality, Datadog integrates with a plethora of services, including AWS, Azure, and Google Cloud, and offers a rich set of API integrations.
Pros and Cons
Pros:
- Customizable dashboards tailored to unique monitoring needs
- Broad range of integrations with cloud providers and other services
- Robust APM with insightful data visualization
Cons:
- Some users report occasional delays in metric updates
- Steeper learning curve for full utilization of its features
- Might be pricey for smaller teams or projects
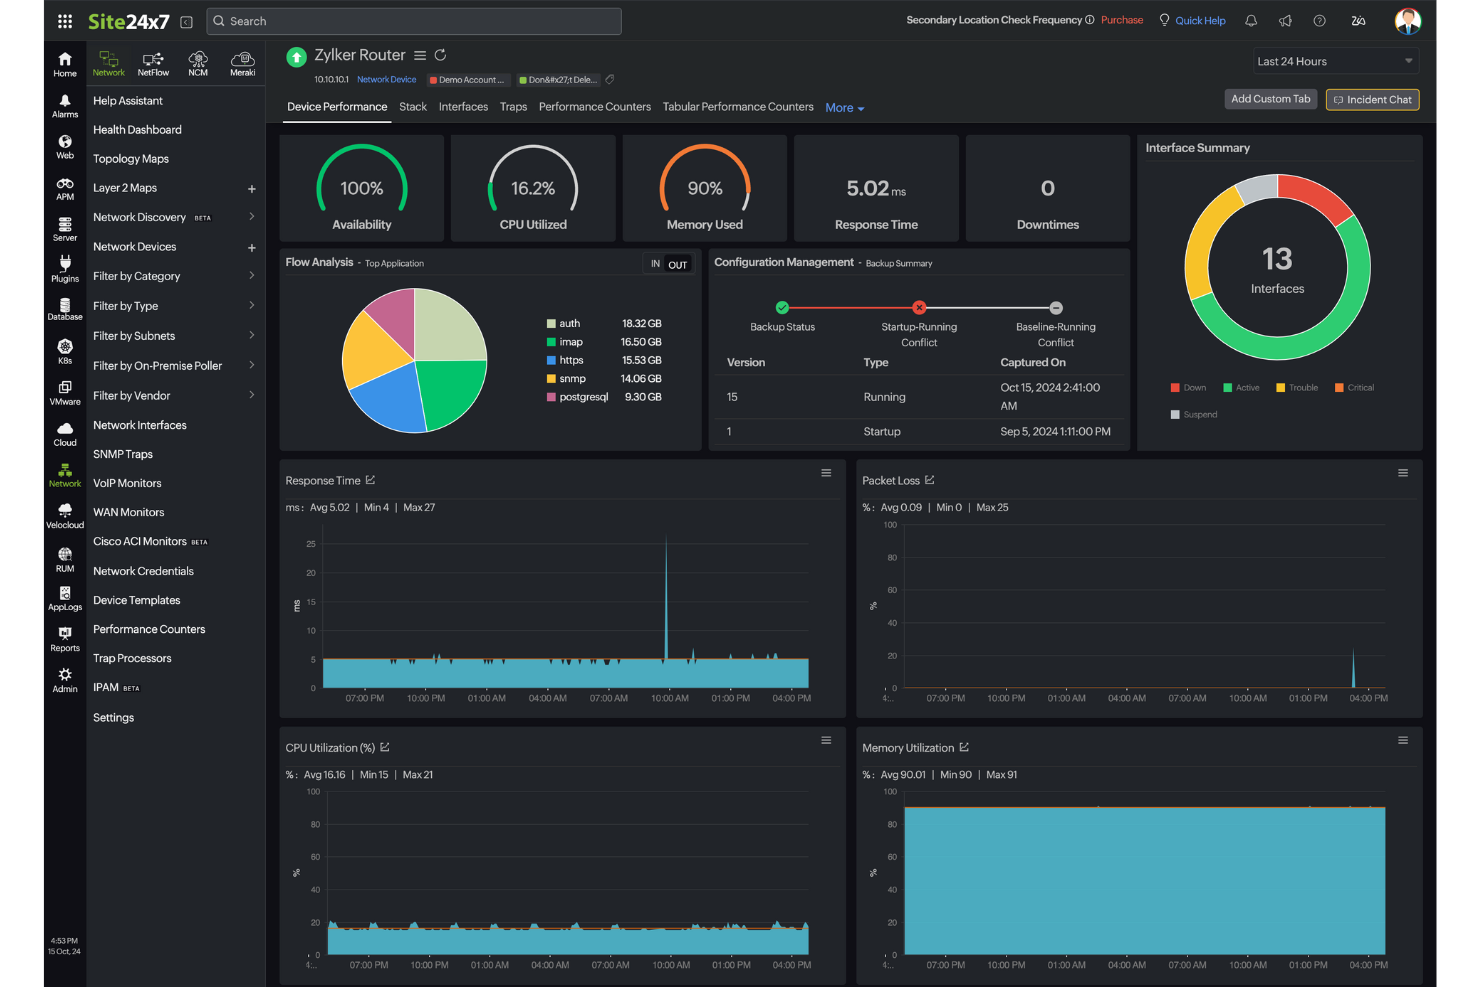
Site24x7 gives IT teams and managed service providers a unified platform to monitor servers, networks, applications, and cloud resources, helping you detect and resolve performance issues across your entire technology stack.
Who Is Site24x7 Best For?
Site24x7 is a strong fit for IT teams and MSPs managing mixed environments that span on-premises infrastructure, cloud platforms, and web applications.
Why I Picked Site24x7
Site24x7 earns its spot on my shortlist because it covers the full infrastructure stack from a single console—servers, networks, containers, cloud platforms, and applications all in one place. I particularly like the AIOps-driven anomaly detection, which uses ML to flag deviations from dynamic baselines rather than relying on static thresholds you have to manually configure. This lets my team catch a memory leak or unusual traffic spike before it cascades into an outage. The correlated metrics, traces, and logs view is also helpful—when something breaks, I'm not jumping between three different tools to piece together what happened.
Site24x7 Key Features
- Network performance monitoring: Analyzes device performance from over 450 vendors using more than 15,000 device templates at both the device and interface levels.
- Real user monitoring: Tracks how end users experience your websites across geographies, devices, browsers, and ISPs, including session replays and JavaScript error tracking.
- Network configuration management: Automates configuration backups, detects unauthorized changes, identifies firmware vulnerabilities, and tracks compliance from one place.
- Log management: Collects and indexes logs from servers, applications, networks, and cloud services into a centralized console with query-based search and dashboard visualization.
Site24x7 Integrations
Integrations include ServiceNow, PagerDuty, Opsgenie, Jira, Slack, Microsoft Teams, Zendesk, Freshservice, Splunk On-Call (VictorOps), and Discord.
Pros and Cons
Pros:
- Flexible monitoring integrates easily with multiple infrastructure components
- Quick setup process covers websites and cloud resource monitoring
- AI-powered full-stack monitoring supports multicloud infrastructure management
Cons:
- Pricing structure becomes expensive due to multiple monitor types
- Alert bugs cause issues when adding new monitoring configurations
New Product Updates from Site24x7
Site24x7 Adds Synchronization Statuses for MSPs
Site24x7 now provides MSPs enhanced alerts and synchronization statuses in a centralized notification center to spot configuration sync issues sooner and accelerate incident response. For more information, visit Site24x7's official site.


ManageEngine OpManager gives IT teams and network administrators a unified platform to monitor network devices, servers, and critical infrastructure, helping organizations rapidly detect and resolve performance issues across complex environments.
Who Is ManageEngine OpManager Best For?
ManageEngine OpManager is a strong fit for mid-size to large enterprises that need centralized visibility across multiple sites, branch offices, or geographically distributed network infrastructure.
Why I Picked ManageEngine OpManager
I picked ManageEngine OpManager as one of the best because of how well its probe-central architecture handles distributed network monitoring at scale. When you're managing infrastructure across multiple branch offices or data centers, OpManager deploys probes at each remote site that handle local discovery, mapping, and fault monitoring—then feed everything back to a single central dashboard. I like that the central server gives you full visibility into device health, CPU, memory, and disk utilization per probe without needing to log into each site separately. Additionally, any configuration changes or policy updates pushed from the central server automatically propagate to all connected probes, which cuts down on configuration drift that causes headaches in multi-site environments.
ManageEngine OpManager Key Features
- Network mapping: Automatically generates L1/L2 topology maps to visualize device relationships and pinpoint the source of outages or performance degradation.
- Adaptive thresholds: Uses ML to learn utilization patterns and set dynamic alert thresholds, reducing false positives from static threshold configurations.
- IT workflow automation: Lets you build automated responses to fault conditions, such as running diagnostic scripts or restarting services when specific alerts trigger.
- Storage capacity forecasting: Analyzes historical usage trends to predict when storage resources will be exhausted before they actually run out.
ManageEngine OpManager Integrations
Integrations include ServiceDesk Plus, NetFlow Analyzer, Network Configuration Manager, OpUtils, AlarmsOne, Applications Manager, Firewall Analyzer, Analytics Plus, AssetExplorer, and Zoho Creator.
Pros and Cons
Pros:
- Real-time, auto-updating network maps
- Supports multiple vendor environments
- Automated, scheduled network discovery
Cons:
- Initial setup can be complex
- Pricing may be high for small teams
New Product Updates from ManageEngine OpManager
ManageEngine OpManager Vendor Templates and NCM XML Import
ManageEngine OpManager introduces enhanced vendor template integration and device template import for the NCM module using XML files. This update helps teams improve device classification and speed up configuration workflows. For more information, visit ManageEngine OpManager’s official site.
 .
.
Zabbix is an open-source monitoring platform used by IT teams and enterprises to track the health and performance of networks, servers, cloud resources, and applications, helping organizations detect issues early and maintain reliable infrastructure.
Who Is Zabbix Best For?
Zabbix is a strong fit for mid-size to large enterprises and managed service providers that need a flexible, open-source monitoring solution across complex, distributed infrastructure.
Why I Picked Zabbix
Zabbix earns its spot on my shortlist because of how well it handles scale without forcing you into a rigid architecture. You can deploy an unlimited number of Zabbix proxies to distribute metric collection across remote locations, data centers, or company branches; traffic between the central server and proxies is compressed, which is important when pulling data from hundreds of thousands of devices. I also rely on the proxy group feature, which automatically balances monitoring load across proxies and handles failover if one goes down. The auto-discovery engine detects network devices, services, and resources like file systems, CPUs, and Docker containers, then automatically creates items, triggers, and graphs, so scaling up doesn't require manually configuring every new endpoint.
Zabbix Key Features
- Anomaly detection: Zabbix uses baseline monitoring to automatically calculate reference points from historical data and flag deviations in real time.
- SLA monitoring: Define service trees and custom SLA calculation logic, with daily, weekly, monthly, and yearly SLA overviews accessible from dashboards.
- Synthetic monitoring: Build multi-step browser-based scenarios to monitor web applications and APIs, including screenshot capture and performance metric collection.
- Audit log: Track every configuration change by user, including the IP address used, with full export via API for compliance or security review.
Zabbix Integrations
Integrations include AWS, Microsoft Azure, VMware, Cisco, Dell, IBM, Oracle, Slack, Jira, and ServiceNow.
Pros and Cons
Pros:
- Advanced problem detection assists in rapid troubleshooting
- Offers support for a wide variety of operating systems.
- Open-source platform, making it cost-effective for businesses.
Cons:
- Official technical support can be pricey for smaller enterprises
- Initial setup can be complex for those unfamiliar with open-source platforms.
- The interface might seem a bit outdated to some users.
Other System Monitoring Tools
Here are some additional system monitoring tools options that didn’t make it onto my shortlist, but are still worth checking out:
- Nagios
For comprehensive IT infrastructure monitoring
- New Relic
For infrastructure health insights
- Prometheus
For reliable alerting and querying
- Grafana Labs
For visualizing metrics
- Zenoss
For cloud-native IT operations
- Lakeside
For digital experience analytics
- LibreNMS
For open-source network monitoring
- Icinga
Open-source solution
- AppDynamics
Good for in-depth application performance monitoring
- Cacti
Good for visualizing network performance metrics
- Observium
Good for detailed network health insights
- OpenNMS
Good for scalable enterprise-grade network management
- Sysdig
Good for container and microservices monitoring
- Munin
Good for tracking system resources over time


System Monitoring Tool Selection Criteria
When selecting the best system monitoring tools to include in this list, I considered common buyer needs and pain points like real-time performance tracking and integration capabilities. I also used the following framework to keep my evaluation structured and fair:
Core Functionality (25% of total score)
To be considered for inclusion in this list, each solution had to fulfill these common use cases:
- Monitor system performance
- Alert on system issues
- Track resource usage
- Provide real-time data
- Generate performance reports
Additional Standout Features (25% of total score)
To help further narrow down the competition, I also looked for unique features, such as:
- Predictive analytics
- Customizable dashboards
- AI-driven insights
- Multi-cloud support
- Automated incident response
Usability (10% of total score)
To get a sense of the usability of each system, I considered the following:
- Intuitive user interface
- Easy navigation
- Customization options
- Learning curve
- Accessibility features
Onboarding (10% of total score)
To evaluate the onboarding experience for each platform, I considered the following:
- Availability of training videos
- Interactive product tours
- Access to templates
- Supportive chatbots
- Live webinars
Customer Support (10% of total score)
To assess each software provider’s customer support services, I considered the following:
- 24/7 availability
- Response time
- Support channels
- Knowledge base access
- Personalized assistance
Value For Money (10% of total score)
To evaluate the value for money of each platform, I considered the following:
- Competitive pricing
- Feature-to-price ratio
- Licensing options
- Free trial availability
- Discounts or offers
Customer Reviews (10% of total score)
To get a sense of overall customer satisfaction, I considered the following when reading customer reviews:
- User satisfaction ratings
- Feedback on performance
- Ease of use comments
- Support experience
- Value perception
How to Choose a System Monitoring Tool
It’s easy to get bogged down in long feature lists and complex pricing structures. To help you stay focused as you work through your unique software selection process, here’s a checklist of factors to keep in mind:
| Factor | What to Consider |
|---|---|
| Scalability | Can the tool grow with your business? Look for solutions that handle increased data and users without degrading performance. Consider potential future needs. |
| Integrations | Does it work with your current tech stack? Check compatibility with existing software to ensure smooth data flow and avoid isolated systems. |
| Customizability | Can you tailor it to your workflow? Evaluate if the tool allows modifications to fit your processes, avoiding rigid solutions that force you to adapt. |
| Ease of use | Is the interface intuitive for your team? A complex tool can hinder efficiency. Consider tools that offer a user-friendly design to minimize training time. |
| Implementation and onboarding | How long will it take to get up and running? Assess the time and resources needed for deployment, including training and support during the transition. |
| Cost | Is the pricing transparent and within budget? Factor in both initial costs and ongoing fees. Be wary of hidden charges that can inflate total expenses. |
| Security safeguards | Does it protect your data? Ensure the tool complies with security standards and offers features like encryption and access controls to safeguard sensitive information. |
What Are System Monitoring Tools?
System monitoring tools are software solutions that track and manage the performance and health of IT systems. IT administrators, network engineers, and system analysts typically use these tools to ensure systems run smoothly and efficiently. Real-time monitoring, alerting, and reporting capabilities help with identifying issues, optimizing resources, and maintaining uptime. These tools provide essential insights that keep systems reliable and secure, especially when using dedicated hardware monitoring software.
Features
When selecting system monitoring tools, keep an eye out for the following key features:
- Real-time monitoring: Continuously tracks system performance to quickly identify and address issues as they arise.
- Alerting: Sends notifications to users when specific thresholds are breached, enabling prompt responses to potential problems.
- Reporting: Generates detailed performance reports that help in analyzing trends and making informed decisions.
- Integration capabilities: Connects with existing software and systems to ensure seamless data flow and comprehensive monitoring.
- Customizable dashboards: Allow users to tailor the interface to display the most relevant data for their specific needs.
- Predictive analytics: Uses historical data to forecast potential future issues, helping prevent downtime before it occurs.
- Security safeguards: Offers features like encryption and access controls to protect sensitive system data.
- Scalability: Adapts to growing data and user demands without compromising performance.
- User-friendly interface: Ensures ease of use, reducing the learning curve and minimizing the need for extensive training.
- Automated incident response: Provides tools to automatically address common issues, reducing the need for manual intervention.
Benefits
Implementing system monitoring tools, including modern Nagios alternatives, provides several benefits for your team and your business. Here are a few you can look forward to:
- Improved uptime: Real-time monitoring and alerting help you quickly address issues, reducing downtime and keeping systems running smoothly.
- Enhanced security: Security safeguards like encryption and access controls protect sensitive data, minimizing the risk of breaches.
- Informed decision-making: Detailed reporting and predictive analytics offer insights that guide resource allocation and future planning.
- Increased efficiency: Automated incident response reduces manual workload, allowing your team to focus on more strategic tasks.
- Better resource management: Tracking resource usage helps in optimizing system performance and avoiding unnecessary expenses.
- Scalability support: The ability to handle growing demands ensures your systems can grow alongside your business without performance loss.
- User satisfaction: A user-friendly interface makes it easier for your team to adopt and effectively use the tool, minimizing frustration.
Costs & Pricing
Selecting system monitoring tools requires an understanding of the various pricing models and plans available. Costs vary based on features, team size, add-ons, and more. The table below summarizes common plans, their average prices, and typical features included in system monitoring tools solutions:
Plan Comparison Table for System Monitoring Tools
| Plan Type | Average Price | Common Features |
|---|---|---|
| Free Plan | $0 | Basic monitoring, limited alerts, and community support. |
| Personal Plan | $5-$15/user/month | Real-time monitoring, basic reporting, and email notifications. |
| Business Plan | $20-$50/user/month | Advanced reporting, integrations, and customizable dashboards. |
| Enterprise Plan | $60-$100/user/month | Full analytics suite, predictive analytics, and dedicated customer support. |
System Monitoring Tools FAQs
Here are some answers to common questions about system monitoring tools:
Can system monitoring tools integrate with ticketing systems?
Yes, many tools connect with ticketing platforms like Jira or ServiceNow. This means alerts can create tickets automatically, so your team doesn’t miss anything. It helps your workflows stay organized and keeps issue resolution on track. Setup usually involves using webhooks or native plugins.
What types of alerts can you set in system monitoring tools?
You can set alerts for thresholds, anomalies, or specific events like service outages. Some tools support custom alerts for log messages or failed checks. You decide how alerts are triggered—by value, time range, or trends. Delivery can be through email, SMS, Slack, or other channels.
Can system monitoring tools track both servers and applications?
Yes, many tools track hardware metrics and also monitor application-level performance. This includes uptime, response time, and user behavior for apps. You can get visibility into how server health affects app performance. Some tools offer separate modules for infrastructure and application monitoring.
How do system monitoring tools support multi-cloud environments?
Most tools let you connect to AWS, Azure, and Google Cloud through APIs or agents. They collect data across these platforms and present it in a single dashboard. This gives your team one view of performance, even if systems run in different clouds. It reduces the need to juggle multiple vendor tools.
What’s Next:
If you're in the process of researching system monitoring tools, connect with a SoftwareSelect advisor for free recommendations.
You fill out a form and have a quick chat where they get into the specifics of your needs. Then you'll get a shortlist of software to review. They'll even support you through the entire buying process, including price negotiations.