22 Cloud-Based Network Monitoring Tools for 2026

Cloud-Based Network Monitoring Tools Shortlist
Here’s my shortlist of cloud-based network monitoring tools:


Cloud-based network monitoring tools are platforms that let you track, analyze, and manage your network’s health and performance from anywhere using the cloud. If you’re searching for ways to reduce downtime, catch issues early, and keep your infrastructure secure without the hassle of on-premises hardware, these tools are designed for you.
With so many options available, it’s tough to know which solution fits your environment, compliance needs, and integration requirements. This list will help you compare leading cloud-based network monitoring tools for 2026, so you can make an informed decision and keep your systems running smoothly.
Why Trust Our Software Reviews
Best Cloud-Based Network Monitoring Tools Summary
This comparison chart summarizes pricing details for my top cloud-based network monitoring tool selections to help you find the best one for your budget and business needs.
| Tool | Best For | Trial Info | Price | ||
|---|---|---|---|---|---|
| 1 | Best for automated device discovery | Free 15-day trial | From $16/hybrid unit/month | Website | |
| 2 | Best for open-source extensibility | Free 30-day trial | From $20/user/month (billed annually) | Website | |
| 3 | Best for interactive network mapping | Free 30-day trial + Free edition (unavailable in the US, Canada, Japan, Taiwan) | Pricing upon request | Website | |
| 4 | Best for unified infrastructure visibility | Free plan + 14-day free trial available | From $15/host/month (billed annually) | Website | |
| 5 | Best for distributed monitoring scalability | Free, open-source | Free to use | Website | |
| 6 | Best for advanced network performance analytics | 14-day free trial | From $7/node/month | Website | |
| 7 | Best for customizable data visualization | Free plan available | From $19/month | Website | |
| 8 | Best for real-time AWS resource tracking | Free trial available | Pricing upon request | Website | |
| 9 | Best for customizable alert workflows | 30-day free trial + free demo available | From $104/month | Website | |
| 10 | Best for hybrid environment support | Free trial + free demo available | From GBP €590/perpetual (billed annually) | Website |
-

Freshservice
Visit WebsiteThis is an aggregated rating for this tool including ratings from Crozdesk users and ratings from other sites.4.6 -
Deel IT
Visit Website -
Rippling IT
Visit WebsiteThis is an aggregated rating for this tool including ratings from Crozdesk users and ratings from other sites.4.8


Cloud-based Network Monitoring Tools Reviews
Below are my detailed summaries of cloud-based network monitoring tools that made it onto my shortlist. My reviews offer a detailed look at the features, integrations, and best use cases of each platform to help you find the best one for your needs.
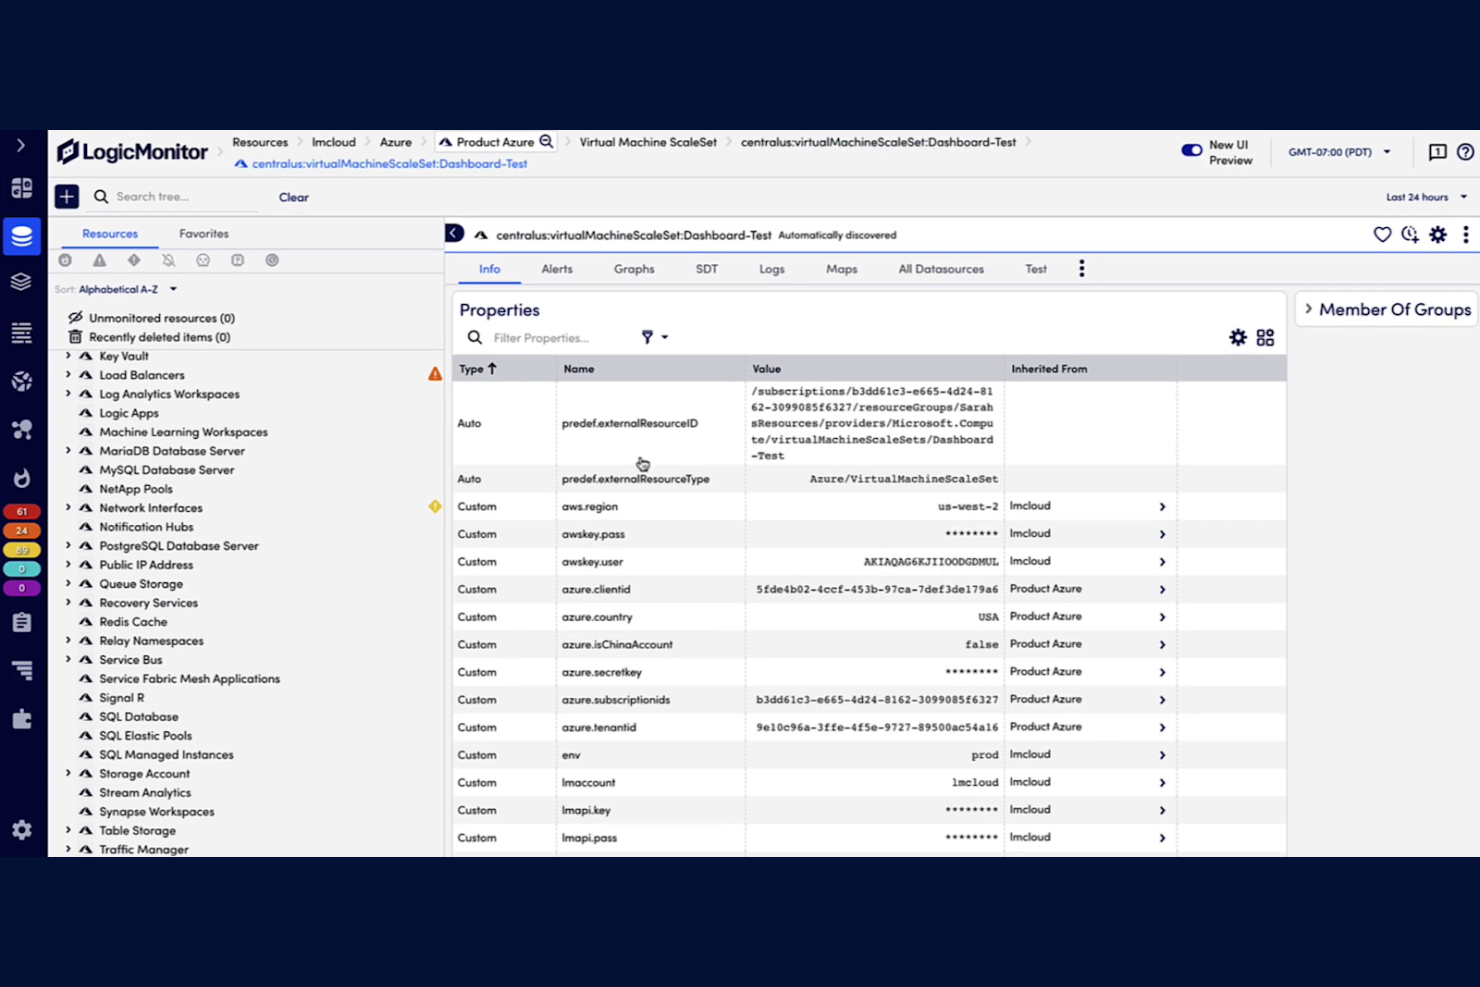
If you’re looking for a network monitoring tool that can automatically detect and map devices across complex environments, LogicMonitor is worth considering. This platform is designed for IT teams managing hybrid infrastructure who need to reduce manual setup and keep pace with rapid network changes. Its automated device discovery helps you maintain visibility and control as your network grows or shifts.
Why I Picked LogicMonitor
Unlike some network monitoring software that requires manual device input, LogicMonitor stands out for its automated device discovery capabilities. I picked LogicMonitor because it continuously scans your environment to identify new devices and map network topology without extra configuration. This automation is especially valuable for IT teams managing dynamic or large-scale networks where devices are frequently added or changed. With LogicMonitor, you can maintain an up-to-date inventory and reduce the risk of blind spots in your monitoring coverage.
LogicMonitor Key Features
In addition to automated device discovery, LogicMonitor offers several other features that support network monitoring:
- Dynamic topology mapping: Visualizes network relationships and dependencies in real time.
- Customizable alert thresholds: Lets you set specific triggers for different devices or metrics.
- Integrated log analysis: Correlates log data with performance metrics for deeper troubleshooting.
- Cloud and hybrid infrastructure monitoring: Monitors resources across public clouds, private clouds, and on-premises environments.
LogicMonitor Integrations
Integrations include AWS, Azure, NetApp, ServiceNow, Slack, PagerDuty, and Microsoft Teams.
Pros and Cons
Pros:
- Predictive AI for anomaly detection
- Unified view for hybrid/cloud stacks
- Excellent automated resource discovery
Cons:
- UI can feel clunky and inconsistent
- Complex setup for custom data sources
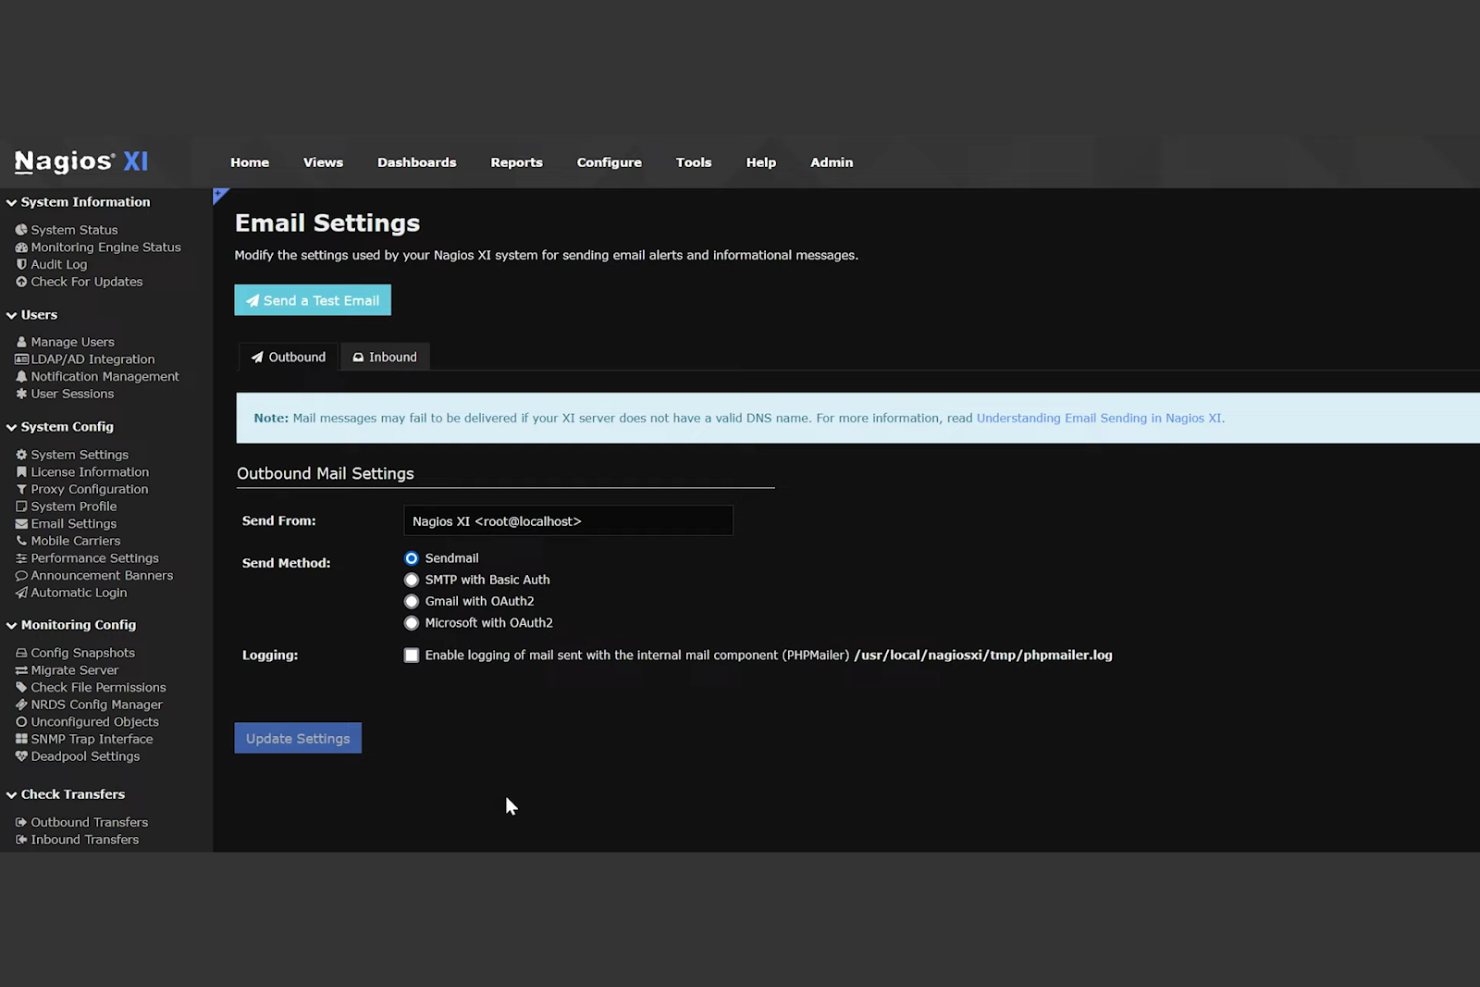
If you’re looking for a network monitoring tool with deep open-source flexibility, Nagios is worth considering. It appeals to IT specialists and organizations that want to customize monitoring for unique cloud and hybrid environments. With its plugin architecture and active community, Nagios helps teams build tailored solutions for complex infrastructure challenges.
Why I Picked Nagios
What makes Nagios stand out for cloud-based network monitoring is its open-source extensibility, which gives you full control over how you monitor your environment. The plugin framework lets you add or create custom checks for cloud services, virtual machines, and hybrid infrastructure. I appreciate that you can tap into a large library of community-contributed plugins, so you’re not limited to built-in monitoring options. This flexibility is especially useful for IT teams with unique requirements or rapidly evolving cloud architectures.
Nagios Key Features
Some other features that make Nagios appealing for cloud-based network monitoring include:
- Multi-tenant monitoring: Supports monitoring of multiple environments or clients from a single instance.
- Automated alerting: Sends notifications via email, SMS, or custom scripts when issues are detected.
- Performance graphing: Visualizes historical and real-time performance data for tracked resources.
- Role-based access control: Lets you assign different permissions to users based on their responsibilities.
Nagios Integrations
Integrations include Amazon Web Services, Microsoft Azure, VMware, Cisco, Dell EMC, and more.
Pros and Cons
Pros:
- Rock-solid reliability once configured
- Low resource overhead on Linux
- Extremely flexible and customizable
Cons:
- No native auto-discovery in Core
- Core version lacks a modern web UI
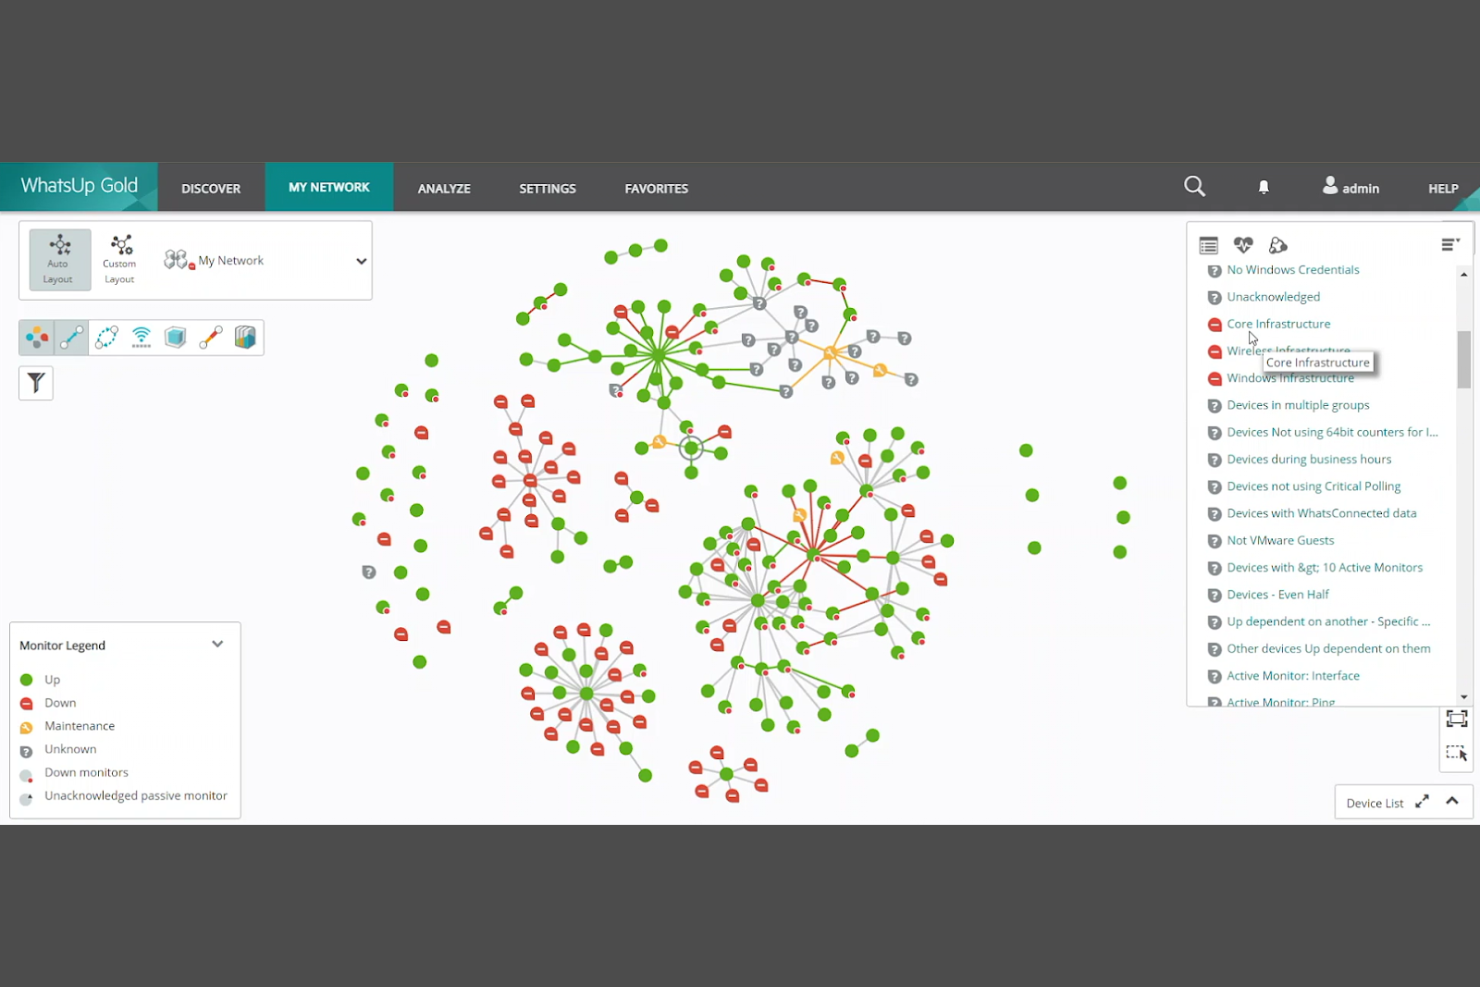
WhatsUp Gold stands out for IT teams that need real-time, interactive network mapping to visualize complex environments. Its dynamic maps help network administrators quickly spot issues and understand device relationships across cloud and on-premises infrastructure. This approach is especially useful for organizations managing hybrid networks or frequent topology changes.
Why I Picked WhatsUp Gold
One thing that sets WhatsUp Gold apart is its interactive network mapping, which is especially valuable for cloud-based network monitoring. The platform automatically discovers devices and creates live topology maps, so you can see real-time changes as your network evolves. I like how you can drill down into specific devices or connections directly from the map, making it easier to troubleshoot issues quickly. This level of visual clarity is a strong fit for teams managing dynamic or hybrid network environments.
WhatsUp Gold Key Features
In addition to its interactive mapping capabilities, there are several other features worth noting:
- Cloud resource monitoring: Tracks the status and performance of AWS and Azure resources alongside on-premises devices.
- Configurable alerting: Lets you set custom thresholds and receive notifications through multiple channels.
- Network traffic analysis: Provides visibility into bandwidth usage and application traffic patterns.
- Device status reporting: Generates detailed reports on device health, uptime, and performance metrics.
WhatsUp Gold Integrations
Integrations include Microsoft Azure, Amazon Web Services, VMware, Cisco, Dell EMC, and more.
Pros and Cons
Pros:
- Reliable agentless network monitoring
- Strong out-of-the-box alert options
- Device-based pricing is easy to budget
Cons:
- High costs for advanced plugin modules
- Web UI can feel slow and clunky
Datadog brings together network, infrastructure, and application monitoring in a single cloud-based platform. It’s a strong fit for IT teams managing complex, hybrid, or multi-cloud environments who need unified visibility across all their systems. If you’re looking to correlate network performance with application health and security, Datadog offers a centralized view that helps you spot issues quickly.
Why I Picked Datadog
I chose Datadog because it excels at providing unified IT infrastructure visibility, which is essential for teams managing distributed networks and cloud resources. Its network performance monitoring capabilities let you visualize traffic flow between hosts, containers, and services in real time. I also appreciate how Datadog’s customizable dashboards bring together metrics from servers, cloud providers, and applications, so you can quickly spot and investigate anomalies across your entire stack. This level of correlation and visibility is especially valuable when you need to troubleshoot issues that span multiple layers of your environment.
Datadog Key Features
Some other features in Datadog that are useful for network monitoring include:
- Cloud-native integrations: Connects with AWS, Azure, Google Cloud, and other providers to collect and correlate cloud service metrics.
- Log management: Aggregates and analyzes logs from across your infrastructure for faster troubleshooting and root cause analysis.
- Synthetic monitoring: Simulates user traffic to test application and network performance from multiple global locations.
- Alerting and incident management: Offers customizable alert rules and integrates with incident response tools to help teams act quickly on network issues.
Datadog Integrations
Integrations include AWS, Azure, Google Cloud, PagerDuty, Jira, ServiceNow, and GitHub.
Pros and Cons
Pros:
- Powerful alerting and monitors
- Vast library of integrations
- Robust full stack observability
Cons:
- Data indexing gets pricey fast
- High cost for custom metrics
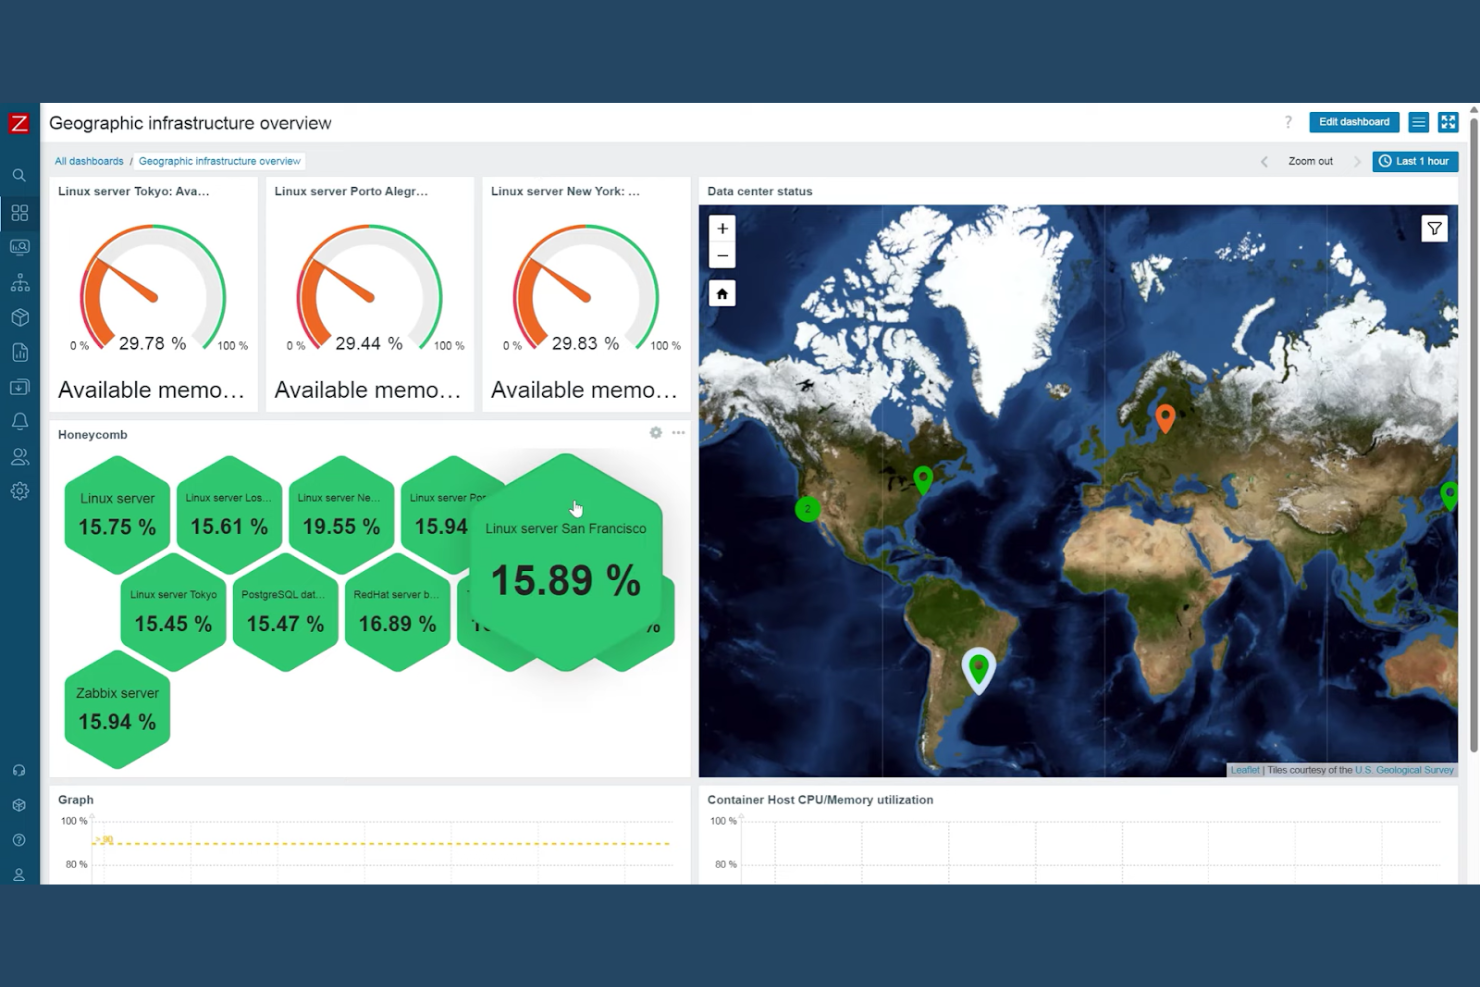
Zabbix is designed for IT teams and enterprises that need to monitor large, distributed networks across multiple locations. It’s a strong fit for organizations managing complex infrastructures with thousands of devices or endpoints. Zabbix helps you centralize monitoring, automate detection, and scale visibility as your network grows.
Why I Picked Zabbix
What sets Zabbix apart is its ability to scale monitoring across highly distributed and complex environments. I picked Zabbix because it supports agent-based and agentless monitoring, making it flexible for different network architectures. Its distributed monitoring architecture lets you deploy proxies in remote locations, so you can collect and centralize data from multiple sites without losing visibility. This approach is especially useful for organizations that need to monitor thousands of devices or geographically dispersed infrastructure.
Zabbix Key Features
Some other features that make Zabbix useful for cloud-based network monitoring include:
- Customizable dashboards: Build visual overviews of network health and performance using widgets and charts.
- Automated alerting: Set up triggers and notifications for specific network events or thresholds.
- Template library: Use pre-built templates for common devices, applications, and services to speed up deployment.
- API access: Integrate Zabbix with other tools or automate tasks using its REST API.
Zabbix Integrations
Integrations include Microsoft Azure, Amazon Web Services, VMware, Cisco, IBM, Oracle, Slack, Elasticsearch, MySQL, PostgreSQL, and more.
Pros and Cons
Pros:
- Low resource footprint on agents
- Highly scalable for large environments
- Massive library of community templates
Cons:
- Database management is resource heavy
- User experience can feel clunky
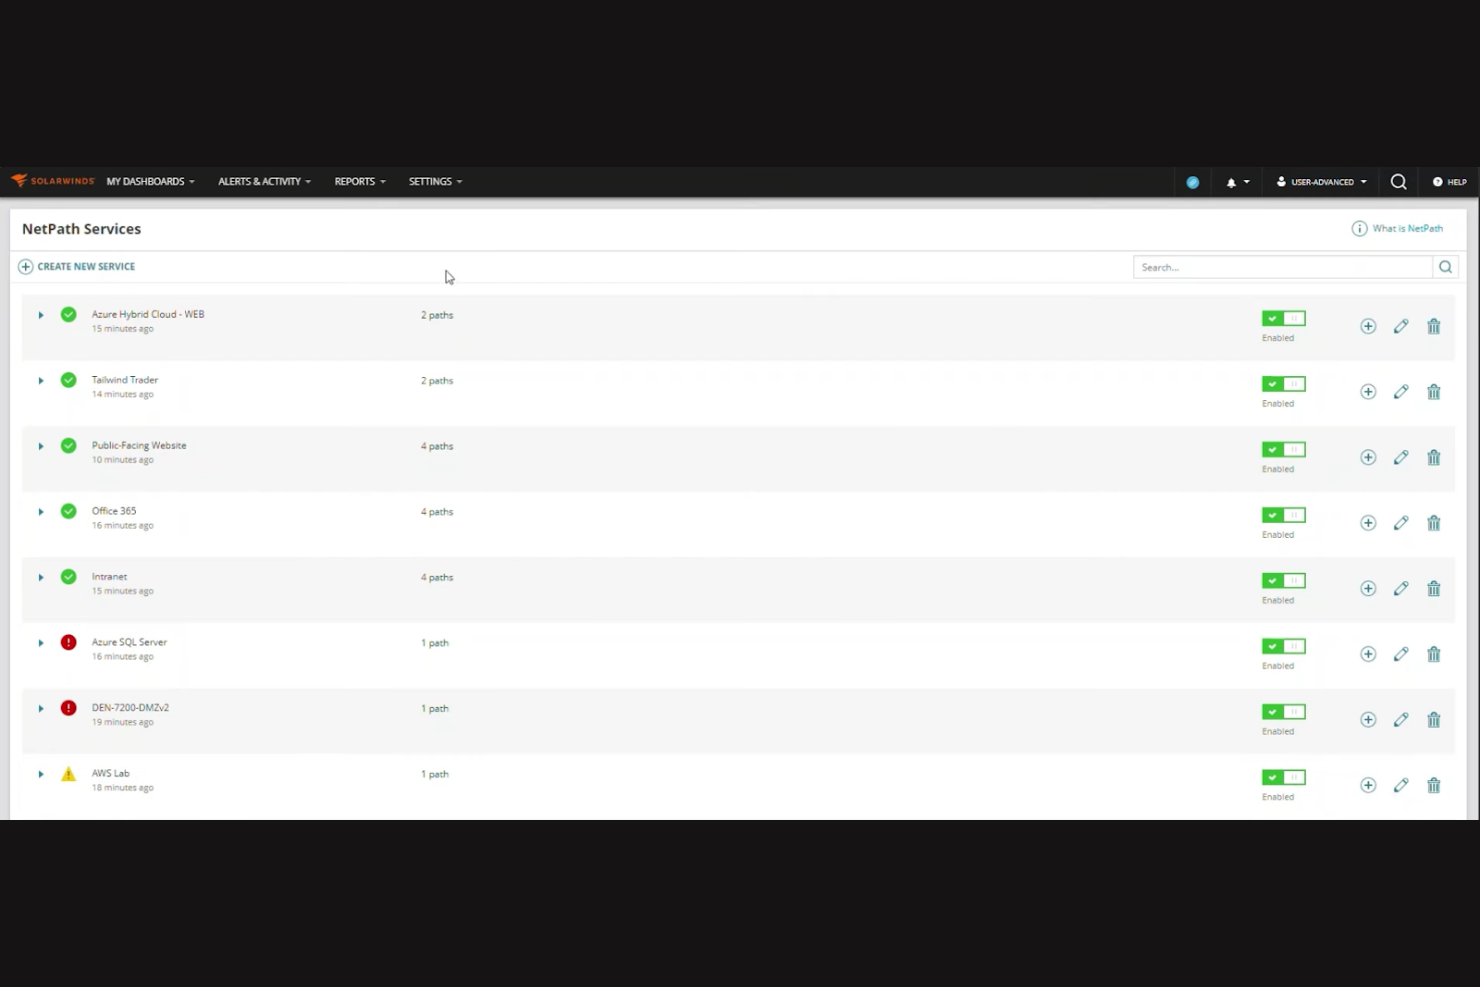
SolarWinds is designed for IT teams that need deep visibility into network performance across cloud and hybrid environments. It’s especially useful for organizations that want advanced analytics to pinpoint bottlenecks and optimize resource usage. With its focus on granular monitoring and real-time diagnostics, SolarWinds helps you address complex network challenges before they impact users.
Why I Picked SolarWinds
When I evaluated tools for advanced network performance analytics, SolarWinds stood out for its depth of monitoring and diagnostic capabilities. The platform offers detailed traffic analysis and performance baselining, which help you identify unusual patterns and potential issues in real time. I appreciate how its NetPath feature visually maps network paths across cloud and on-premises environments, making it easier to pinpoint bottlenecks. These analytics-driven features make SolarWinds a strong choice for IT teams that need actionable insights to maintain reliable cloud network performance.
SolarWinds Key Features
Some other features that make SolarWinds useful for cloud-based network monitoring include:
- Customizable dashboards: Build visual displays tailored to your team’s monitoring priorities.
- Automated device discovery: Detects and adds new network devices as they come online.
- Role-based access control: Assigns permissions based on user roles and responsibilities.
- REST API support: Integrates with other IT management tools and custom workflows.
SolarWinds Integrations
Integrations include Microsoft Active Directory, VMware, Amazon Web Services, Microsoft Azure, Slack, and more.
Pros and Cons
Pros:
- Fast discovery of local network assets
- Simplified node-based licensing model
- Strong community and documentation
Cons:
- Support response times can be erratic
- Advanced features require top-tier plans
Grafana Cloud gives IT teams and network specialists a flexible way to visualize and analyze data from multiple sources in one place. It’s especially useful for organizations that need to build custom dashboards and monitor complex, distributed cloud environments. With its open architecture, Grafana Cloud lets you tailor visualizations to fit your unique network monitoring needs.
Why I Picked Grafana Cloud
Grafana Cloud stands out for its deep focus on customizable data visualization, which is essential for teams monitoring complex cloud networks. I picked Grafana Cloud because it lets you build highly tailored dashboards that pull in metrics from a wide range of sources. The platform supports advanced visualization options, including custom panels and dynamic, real-time data updates. This level of flexibility is especially valuable when you need to track unique KPIs or correlate data across multiple cloud services.
Grafana Cloud Key Features
Some other features that make Grafana Cloud valuable for cloud-based network monitoring include:
- Alerting and notification system: Configure alerts based on thresholds and send notifications through channels like Slack, PagerDuty, or email.
- Multi-source data support: Connect to databases, cloud services, and monitoring tools such as Prometheus, AWS CloudWatch, and Azure Monitor.
- User access controls: Set granular permissions for teams and individuals to manage dashboard access and editing rights.
- Plugin ecosystem: Extend functionality with plugins for new data sources, visualizations, and app integrations.
Grafana Cloud Integrations
Integrations include Prometheus, InfluxDB, Elasticsearch, AWS CloudWatch, MySQL, Graphite, Splunk, and more.
Pros and Cons
Pros:
- Managed service reduces ops overhead
- Powerful PromQL and KQL query support
- Generous free tier for small projects
Cons:
- Alerting setup can be quite complex
- Lack of granular billing safeguards
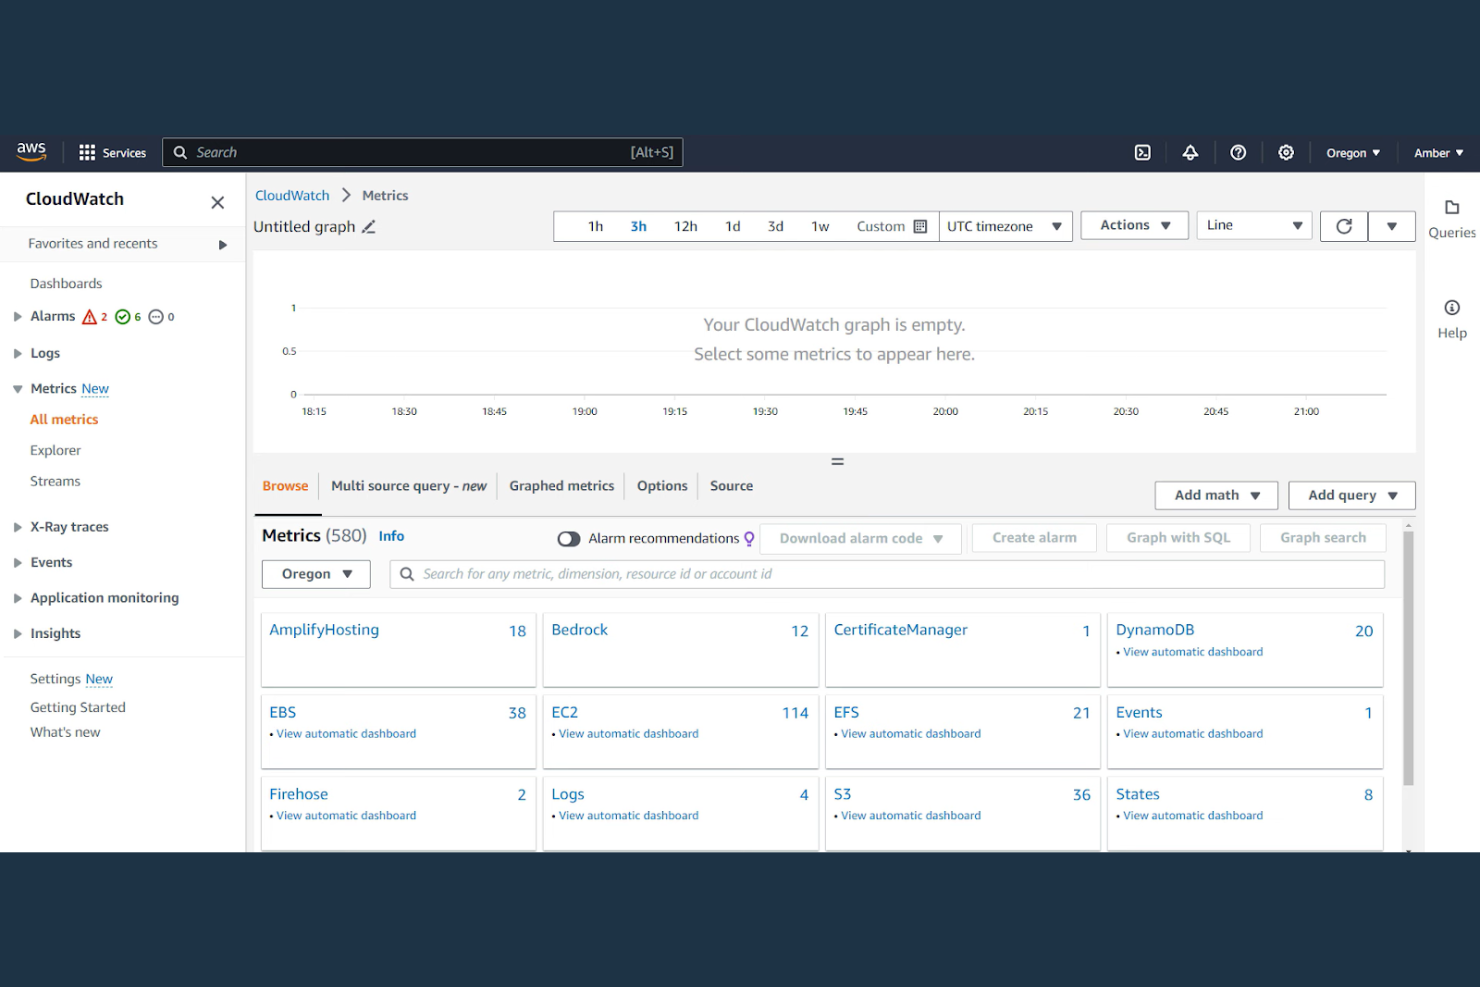
For IT teams managing AWS infrastructure, AWS CloudWatch delivers real-time monitoring and observability tailored to Amazon Web Services environments. This tool is a strong fit for organizations that need to track resource utilization, application performance, and operational health across AWS workloads. With its ability to collect and visualize metrics, logs, and events natively from AWS resources, CloudWatch helps you quickly identify and respond to issues in dynamic cloud environments.
Why I Picked AWS CloudWatch
When you need immediate insight into your AWS resources, AWS CloudWatch offers real-time tracking that’s tightly integrated with the AWS ecosystem. I picked CloudWatch because it automatically collects and visualizes metrics, logs, and events from a wide range of AWS services, giving you up-to-the-minute visibility into your cloud infrastructure. Its real-time dashboards and automated alarms help you spot and respond to performance issues as they happen. For IT specialists focused on AWS environments, this level of optimal performance is hard to match.
AWS CloudWatch Key Features
Some other features in AWS CloudWatch that are useful for network monitoring include:
- Custom metrics: Lets you publish and track your own application or infrastructure metrics alongside AWS service data.
- Log Insights: Provides a query engine for searching and analyzing log data at scale.
- Composite alarms: Allows you to combine multiple alarms into a single alert for more nuanced monitoring.
- CloudWatch Synthetics: Simulates user activity to monitor application endpoints and APIs for availability and latency.
AWS CloudWatch Integrations
Integrations include Amazon EC2, Amazon S3, Amazon RDS, AWS Lambda, Amazon ECS, Amazon EKS, and Amazon SNS.
Pros and Cons
Pros:
- Reliable alerting with anomaly detection
- Highly scalable for enterprise workloads
- Powerful SQL-like log analytics (KQL)
Cons:
- Dashboard UI is basic and feels dated
- Log storage fees can spiral quickly
With ManageEngine, you get a network monitoring solution that stands out for its highly customizable alert workflows. This tool is a strong match for IT teams in organizations with complex or dynamic infrastructure who need granular control over how and when alerts are triggered and escalated. If your business requires tailored notification rules and automated responses to specific network events, ManageEngine offers the flexibility to design workflows that fit your environment.
Why I Picked ManageEngine
What drew me to ManageEngine is its focus on customizable alert workflows, which is a key need for many IT teams managing cloud-based networks. You can set up multi-level escalation rules, define custom alert triggers based on specific network conditions, and automate responses to incidents. I appreciate how the platform lets you tailor notification channels and schedules for different teams or roles, so alerts always reach the right people at the right time. This level of flexibility is especially useful if your environment demands precise control over how network issues are detected and handled.
ManageEngine Key Features
Some other features in ManageEngine that are valuable for network monitoring include:
- Network topology mapping: Automatically discovers and visualizes network devices and their relationships in real time.
- Bandwidth analysis: Monitors and reports on bandwidth usage by application, protocol, or device.
- Configuration management: Tracks and manages changes to network device configurations with version control.
- IP address management: Centralizes tracking and allocation of IP addresses across your network.
ManageEngine Integrations
Integrations include ServiceNow, Slack, Microsoft Teams, Jira, AWS, and Dell EMC.
Pros and Cons
Pros:
- Generous free tiers for small teams
- Unified IT management console
- Strong automated patch management
Cons:
- Support quality can be inconsistent
- Initial setup is complex and slow
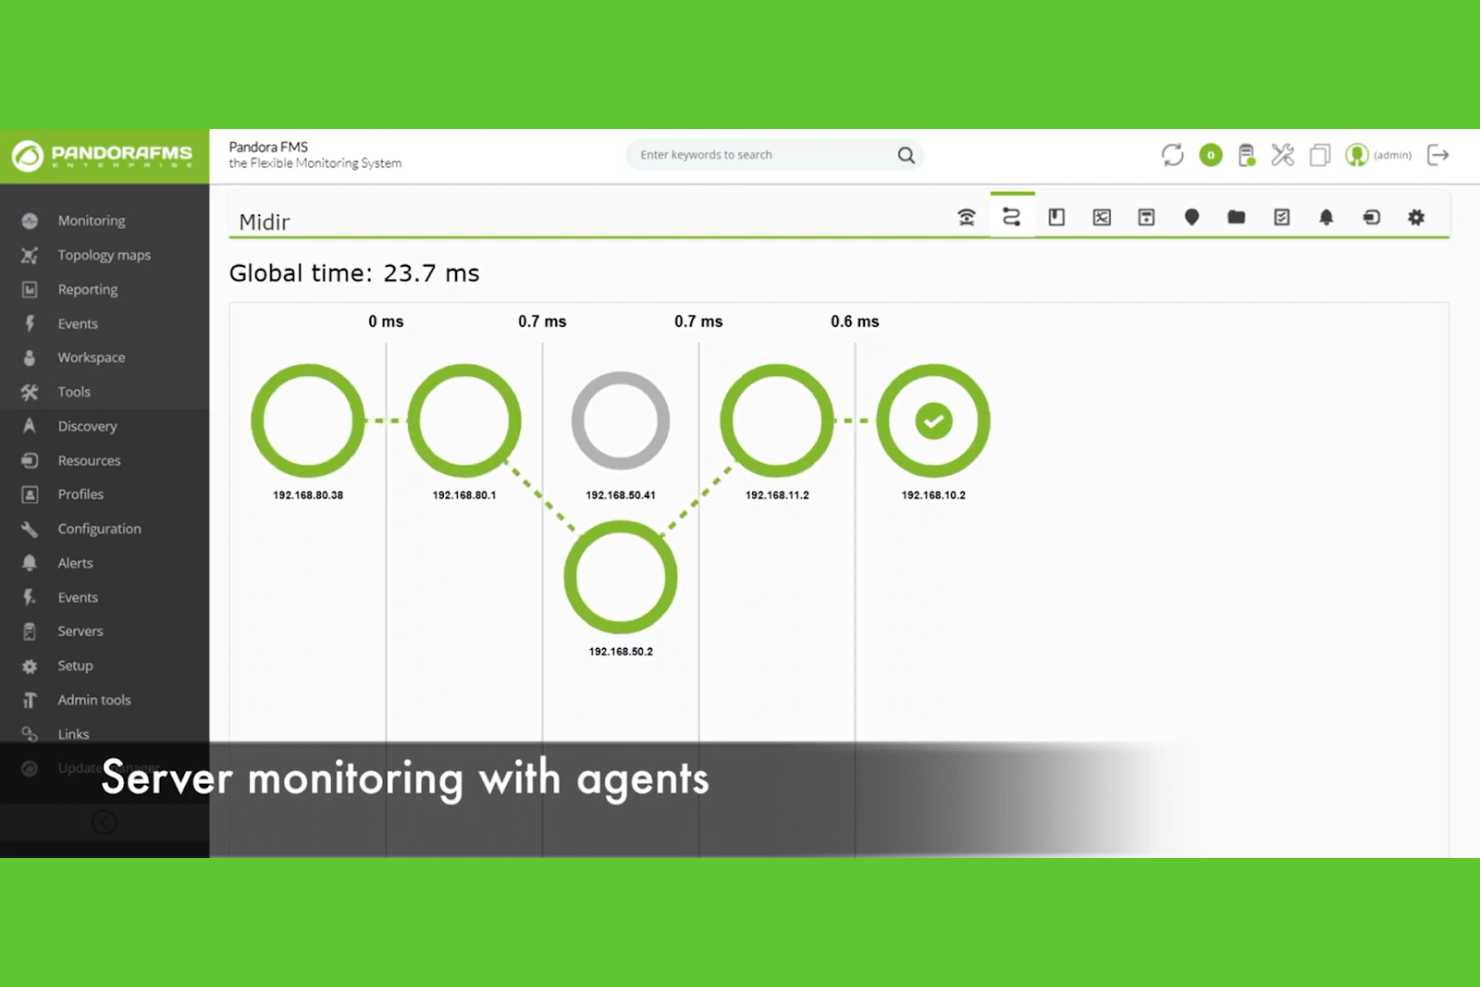
Pandora FMS is built for IT teams managing both cloud and on-premises infrastructure in complex, hybrid environments. It appeals to organizations that need unified monitoring across diverse systems, from legacy servers to modern cloud platforms. With its flexible agent and agentless monitoring, Pandora FMS helps you keep tabs on every part of your network, no matter where it lives.
Why I Picked Pandora FMS
What drew me to Pandora FMS is its strong support for hybrid environments, which is essential for teams juggling both cloud and on-premises assets. The platform offers unified monitoring that covers physical, virtual, and cloud infrastructure from a single console. I like that it supports both agent-based and agentless monitoring, giving you flexibility in how you collect data across different systems. This makes Pandora FMS a practical choice for organizations that need to bridge legacy infrastructure with modern cloud deployments.
Pandora FMS Key Features
Some other features that make Pandora FMS useful for cloud-based network monitoring include:
- Customizable alerting system: Set up detailed alerts based on thresholds, events, or anomalies.
- Service mapping: Visualize dependencies and relationships between networked services and devices.
- SNMP and WMI monitoring: Collect data from a wide range of network devices and Windows systems.
- Reporting and analytics engine: Generate scheduled or on-demand reports with historical and real-time data.
Pandora FMS Integrations
Integrations include Microsoft Azure, Amazon Web Services, VMware, Cisco, Slack, and more.
Pros and Cons
Pros:
- Deep customization via 500+ plugins
- Flexible agent and agentless options
- Strong multi-tenant MSP capabilities
Cons:
- Higher cost for Enterprise edition
- Initial setup and config is complex
Other cloud-based Network Monitoring Tools
Here are some additional cloud-based network monitoring tools options that didn’t make it onto my shortlist, but are still worth checking out:
- Azure Monitor
For native Microsoft ecosystem integration
- PRTG
For flexible sensor-based monitoring
- Site24x7
For integrated website and network monitoring
- Dynatrace
For AI-driven anomaly detection
- New Relic
For full-stack observability
- Auvik
For rapid multi-site deployment
- Icinga
For detailed SLA reporting
- Monitis
For all-in-one monitoring dashboards
- Zenoss
For event-based automation
- Cacti
For customizable graphing templates
- Exabeam
For security event correlation
- Kentik
For network traffic analytics


Cloud-based Network Monitoring Tools Selection Criteria
When selecting the best cloud-based network monitoring tools to include in this list, I considered common buyer needs and pain points like managing distributed environments and reducing downtime from network issues. I also used the following framework to keep my evaluation structured and fair:
Core Functionality (25% of total score)
To be considered for inclusion in this list, each solution had to fulfill these common use cases:
- Monitor network devices and traffic in real time
- Generate alerts for outages or performance issues
- Provide historical reporting and analytics
- Support multi-site or distributed network environments
- Offer secure remote access to monitoring dashboards
Additional Standout Features (25% of total score)
To help further narrow down the competition, I also looked for unique features, such as:
- Automated network discovery and mapping
- AI-driven anomaly detection
- Customizable dashboard widgets and visualizations
- Built-in compliance and audit reporting
- Integration with cloud service provider APIs
Usability (10% of total score)
To get a sense of the usability of each system, I considered the following:
- Simple and intuitive user interface
- Logical navigation and menu structure
- Clear visualization of network status
- Minimal clicks to access key features
- Responsive design for mobile and desktop
Onboarding (10% of total score)
To evaluate the onboarding experience for each platform, I considered the following:
- Availability of step-by-step setup guides
- Access to training videos and documentation
- Pre-built templates for common network devices
- Interactive product tours or walkthroughs
- Live chat or onboarding webinars
Customer Support (10% of total score)
To assess each software provider’s customer support services, I considered the following:
- 24/7 support availability
- Multiple support channels like chat, email, and phone
- Access to a searchable knowledge base
- Fast response times to support requests
- Community forums or user groups
Value For Money (10% of total score)
To evaluate the value for money of each platform, I considered the following:
- Transparent and predictable pricing structure
- Flexible plans for different business sizes
- No hidden fees or surprise charges
- Features included at each pricing tier
- Free trial or demo availability
Customer Reviews (10% of total score)
To get a sense of overall customer satisfaction, I considered the following when reading customer reviews:
- Consistent reliability and uptime feedback
- Positive comments on scalability and flexibility
- Reports of helpful and knowledgeable support
- User satisfaction with reporting and analytics
- Feedback on integration with other IT tools
How to Choose cloud-based Network Monitoring Tools
It’s easy to get bogged down in long feature lists and complex pricing structures. To help you stay focused as you work through your unique software selection process, here’s a checklist of factors to keep in mind:
| Factor | What to Consider |
|---|---|
| Scalability | Can the tool handle your current and projected network size, including multi-site or hybrid setups? Look for proven support for thousands of devices if needed. |
| Integrations | Does the tool natively connect with your existing IT stack, such as cloud providers, ticketing systems, or SIEM platforms? Check for required connectors. |
| Customizability | Can you tailor dashboards, alerts, and reports to your organization’s workflows and terminology? Avoid tools that lock you into rigid templates. |
| Ease of use | Will your team be able to navigate and operate the tool without extensive training? Test for logical menus and clear visualizations. |
| Implementation and onboarding | How long will it take to deploy and start monitoring? Ask about migration support, available templates, and onboarding resources. |
| Cost | Are pricing tiers transparent and predictable as your network grows? Watch for hidden costs tied to device count, data retention, or advanced features. |
| Security safeguards | Does the tool offer encryption, role-based access, and compliance with your industry’s standards? Confirm how data is stored and transmitted. |
| Support availability | Is help available when you need it, especially during incidents? Check for 24/7 support, response SLAs, and escalation paths. |
What Are Cloud-based Network Monitoring Tools?
Cloud-based network monitoring tools are software platforms that track, analyze, and report on the health and performance of network infrastructure using cloud-hosted services. These tools help IT teams monitor devices, traffic, and connectivity across distributed environments without relying on on-premises hardware. They provide real-time visibility, automated alerts, and historical analytics to support proactive network management and rapid incident response.
Features
When selecting cloud-based network monitoring tools, keep an eye out for the following key features:
- Real-time monitoring: Continuously tracks network devices, connections, and traffic to provide up-to-date status and performance data.
- Automated alerting: Sends notifications when network issues, outages, or threshold breaches are detected, so teams can respond quickly.
- Custom dashboards: Let users build visual overviews of network health, device status, and key metrics using configurable widgets and charts.
- Historical reporting: Stores and analyzes past network data to help identify trends, recurring issues, and long-term performance changes.
- Multi-site support: Monitors devices and connections across multiple locations or cloud environments from a single interface.
- Device discovery: Automatically scans and identifies new devices on the network, reducing manual setup and ensuring complete visibility.
- Role-based access control: Restricts user permissions based on roles, helping maintain security and compliance across teams.
- Integration capabilities: Connect with other IT management tools, ticketing systems, or cloud services to centralize workflows and data.
- Network mapping: Visually represents network topology, showing how devices and connections relate for easier troubleshooting and planning.
Benefits
Implementing cloud-based network monitoring tools provides several benefits for your team and your business. Here are a few you can look forward to:
- Centralized visibility: Monitor all network devices and sites from a single, cloud-accessible dashboard, making it easier to manage distributed environments.
- Faster incident response: Automated alerts and real-time monitoring help your team detect and address issues before they escalate.
- Reduced infrastructure overhead: Eliminate the need for on-premises monitoring hardware and maintenance by leveraging cloud-hosted services.
- Scalability: Easily expand monitoring coverage as your network grows, without major changes to your existing setup.
- Improved collaboration: Role-based access and remote dashboards enable multiple team members to work together, regardless of location.
- Historical insights: Access to long-term reporting and analytics supports better planning, troubleshooting, and capacity management.
- Integration with IT workflows: Connect monitoring data with ticketing, automation, or cloud management tools to streamline operations and incident handling.
Costs & Pricing
Selecting cloud-based network monitoring tools requires an understanding of the various pricing models and plans available. Costs vary based on features, team size, add-ons, and more. The table below summarizes common plans, their average prices, and typical features included in cloud-based network monitoring tools solutions:
Plan Comparison Table for cloud-based Network Monitoring Tools
| Plan Type | Average Price | Common Features |
|---|---|---|
| Free Plan | $0 | Basic device monitoring, limited alerting, community support, and access to standard dashboards. |
| Personal Plan | $5-$19/user/month | Monitoring for a small number of devices, basic reporting, email alerts, and single-user access. |
| Business Plan | $40-$100/user/month | Multi-site monitoring, advanced reporting, integrations, role-based access, and priority support. |
| Enterprise Plan | $120-$300/user/month | Unlimited device monitoring, custom dashboards, API access, compliance features, and 24/7 support. |
Cloud-based Network Monitoring Tools FAQs
Here are some answers to common questions about cloud-based network monitoring tools:
How do cloud-based network monitoring tools differ from on-premises solutions?
Cloud-based network monitoring tools run on remote servers and are accessed through a web interface, while on-premises solutions require local hardware and software installations. Cloud tools offer easier remote access, faster deployment, and reduced maintenance, but may require careful review of data privacy and compliance needs.
Can cloud-based network monitoring tools handle hybrid or multi-cloud environments?
Yes, most cloud-based network monitoring tools are designed to monitor on-premises, hybrid, and multi-cloud networks from a single dashboard. Look for tools that support integrations with major cloud providers and offer flexible device discovery across different environments.
What security considerations should I keep in mind when using cloud-based network monitoring tools?
You should confirm that the tool uses encryption for data in transit and at rest, supports role-based access controls, and complies with relevant industry standards. Ask vendors about their data storage locations, retention policies, and incident response procedures.
How quickly can my team deploy a cloud-based network monitoring tool?
Most cloud-based network monitoring tools can be deployed within hours or days, depending on network complexity and integration needs. Many offer automated device discovery, setup wizards, and onboarding resources to speed up the process.
What types of support are typically available for cloud-based network monitoring tools?
Support options usually include email, live chat, phone, and a searchable knowledge base. Some vendors also offer onboarding webinars, community forums, and 24/7 support for higher-tier plans. Always check support response times and escalation procedures before choosing a tool.
What’s Next:
If you're in the process of researching cloud-based network monitoring tools, connect with a SoftwareSelect advisor for free recommendations.
You fill out a form and have a quick chat where they get into the specifics of your needs. Then you'll get a shortlist of software to review. They'll even support you through the entire buying process, including price negotiations.