10 Migliori Strumenti di Monitoraggio dell’Infrastruttura Cloud del 2026

10 Migliori Strumenti di Monitoraggio dell'Infrastruttura Cloud - Shortlist


Mantenere efficiente l'infrastruttura cloud non riguarda solo il tempo di attività, ma anche l’individuazione tempestiva dei problemi di prestazione prima che impattino sugli utenti, la garanzia della scalabilità senza sprechi e la visibilità su ambienti complessi. Se ti sei mai trovato a combattere con rallentamenti inspiegabili, interruzioni impreviste o mancanza di informazioni in tempo reale, sai quanto può essere difficile tenere tutto sotto controllo senza gli strumenti di monitoraggio adeguati.
Gli strumenti di monitoraggio dell'infrastruttura cloud offrono un modo centralizzato per tenere traccia delle prestazioni delle applicazioni, dell’attività di rete e dell’utilizzo delle risorse su tutti gli ambienti cloud. Negli anni ho testato una vasta gamma di questi strumenti, valutando quanto siano efficaci nel rilevare problemi, ridurre i tempi di risposta e integrarsi nei flussi di lavoro esistenti. In questa guida analizzerò le migliori soluzioni disponibili, aiutandoti a trovare quella più adatta alle tue esigenze di monitoraggio cloud.
Table of Contents
- Migliori Software Selezionati
- Perché Fidarti di Noi
- Confronta Specifiche
- Recensioni
- Altri Strumenti di Monitoraggio dell'Infrastruttura Cloud
- Recensioni di Software Correlati
- Criteri di Selezione
- Come Scegliere
- Tendenze negli Strumenti di Monitoraggio dell'Infrastruttura Cloud
- Cosa Sono gli Strumenti di Monitoraggio dell'Infrastruttura Cloud
- Funzionalità
- Vantaggi
- Costi e Prezzi
- Domande Frequenti
Perché Fidarti delle Nostre Recensioni Software
Testiamo e recensiamo software dal 2023. Come leader tecnologici, sappiamo quanto sia cruciale e difficile prendere la decisione giusta nella scelta di un software.
Investiamo in una ricerca approfondita per aiutare il nostro pubblico a effettuare scelte migliori di acquisto software. Abbiamo testato oltre 2.000 strumenti per diversi casi d’uso tecnologici e scritto più di 1.000 recensioni complete. Scopri come restiamo trasparenti e la nostra metodologia di recensione del software.
Riepilogo dei Migliori Strumenti di Monitoraggio dell'Infrastruttura Cloud
| Tool | Best For | Trial Info | Price | ||
|---|---|---|---|---|---|
| 1 | Ideale per test di transazioni sintetiche | No | Prezzo su richiesta | Website | |
| 2 | Ideale per il monitoraggio delle prestazioni delle applicazioni | No | $945 all'anno per un massimo di 25 server o applicazioni | Website | |
| 3 | Ideale per il monitoraggio di infrastrutture IT ibride | No | Prezzi su richiesta | Website | |
| 4 | Ideale per metriche di salute dettagliate | Sì | $99/mese | Website | |
| 5 | Ideale per l'approccio Infrastructure as Code (IaC) | Sì | $20/user/month | Website | |
| 6 | Ideale per l'ambiente IBM Cloud | No | $10 per milione di metriche raccolte/mese | Website | |
| 7 | Ideale per dati unificati di applicazioni e infrastrutture | Prova gratuita di 30 giorni disponibile | Da $7/nodo/mese | Website | |
| 8 | Migliore per il monitoraggio cloud open source | Not available | Gratuito, supporto a pagamento da $1000/mese | Website | |
| 9 | Ideale per osservabilità in tempo reale | No | $60 per host al mese | Website | |
| 10 | Ideale per la visibilità su ogni percorso di rete | No | Prezzo personalizzato | Website |
-

TestDevLab
Visit Website -
Site24x7
Visit WebsiteThis is an aggregated rating for this tool including ratings from Crozdesk users and ratings from other sites.4.7 -
GitHub Actions
Visit WebsiteThis is an aggregated rating for this tool including ratings from Crozdesk users and ratings from other sites.4.8


Recensioni dei Migliori Strumenti di Monitoraggio dell'Infrastruttura Cloud
Di seguito trovi i miei riepiloghi dettagliati dei migliori strumenti di monitoraggio dell’infrastruttura cloud che sono entrati nella mia shortlist. Le recensioni offrono una panoramica approfondita delle funzionalità principali, dei pro e contro, delle integrazioni e dei casi d’uso ideali di ciascuno strumento per aiutarti a trovare quello più adatto a te.
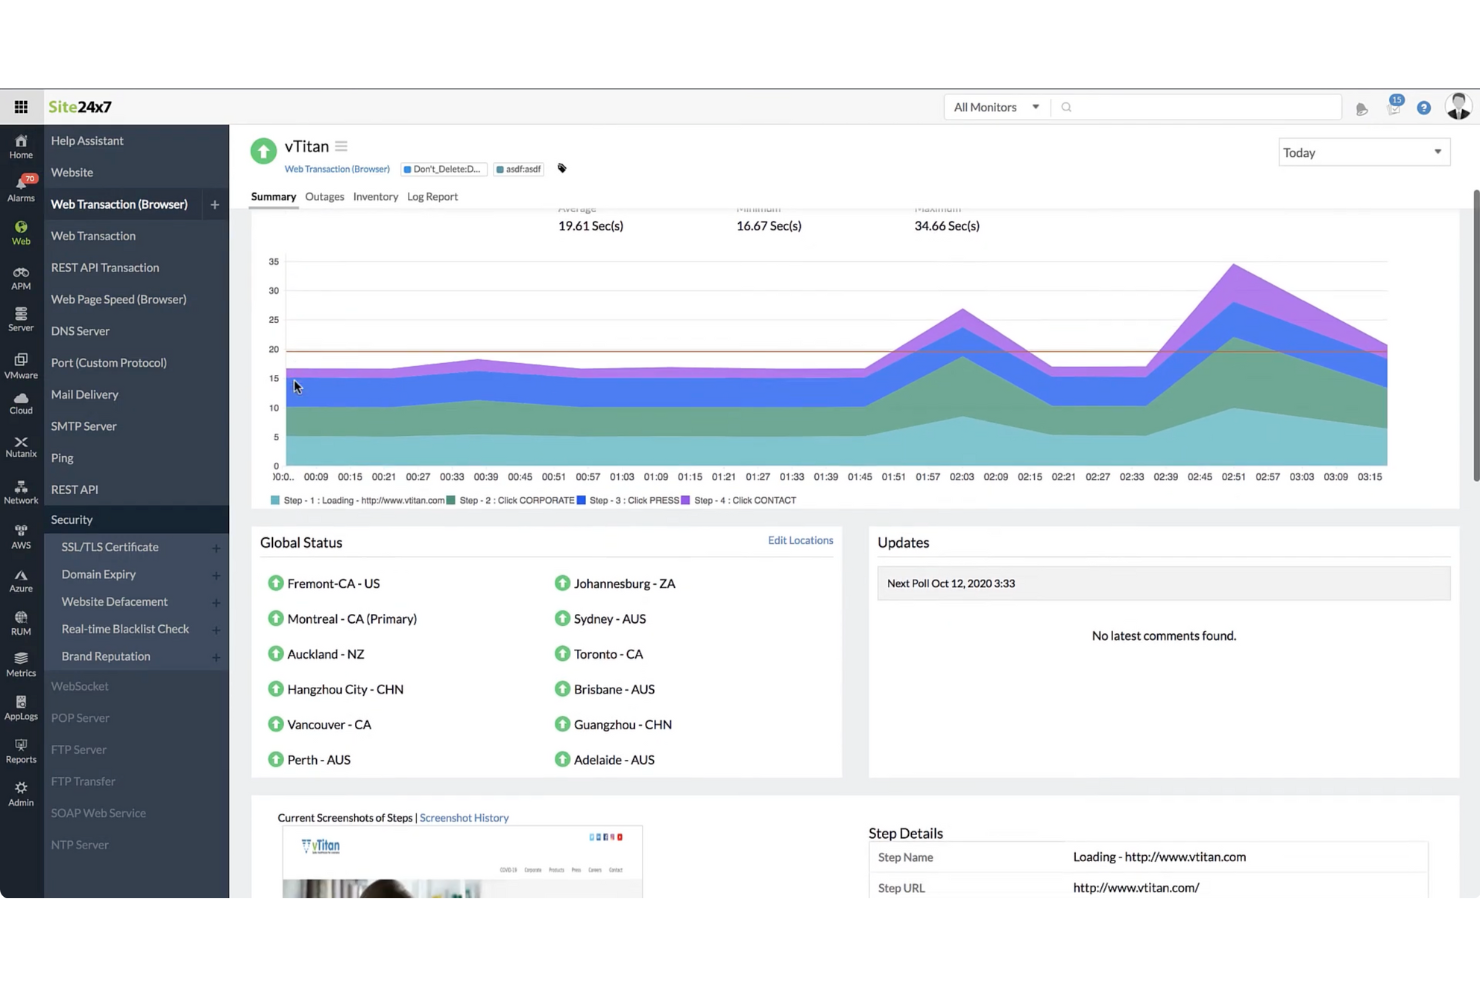
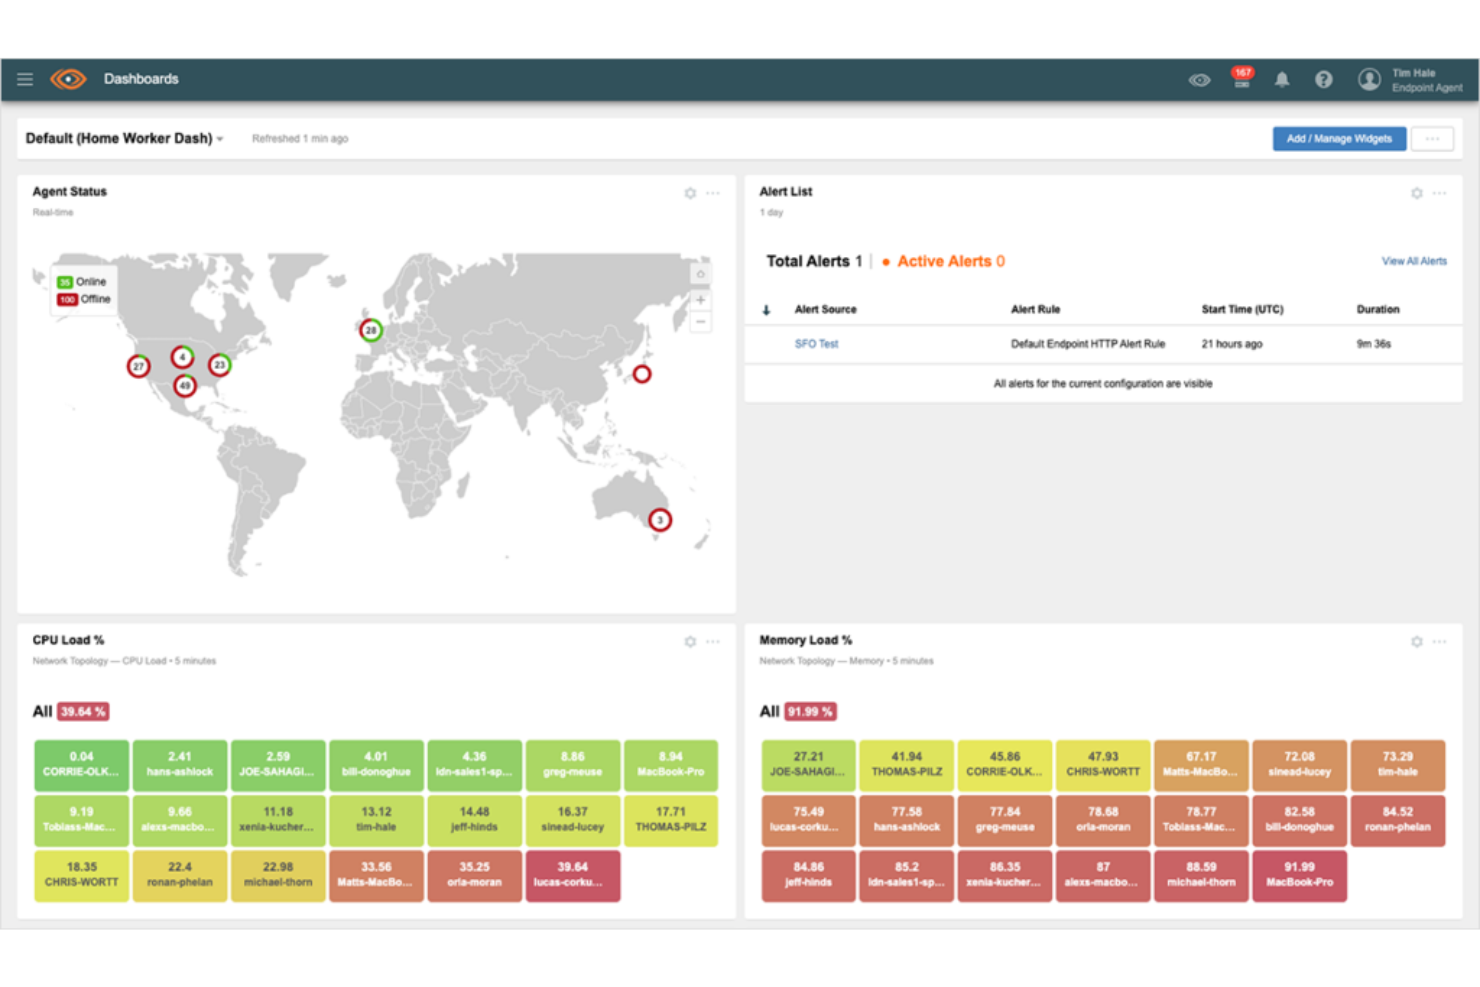
Per le aziende che gestiscono infrastrutture cloud complesse, Site24x7 offre una soluzione di monitoraggio che include test di transazioni sintetiche per aiutare a tracciare la disponibilità e le prestazioni dei servizi. Si rivolge a team IT e organizzazioni che necessitano di una chiara visibilità nei loro ambienti cloud, contribuendo a risolvere problemi come rallentamenti delle prestazioni, uso delle risorse e gestione degli incidenti. Con una copertura che include le principali piattaforme cloud e una gamma di funzionalità di monitoraggio, Site24x7 aiuta i team a mantenere operazioni stabili e un'esperienza utente coerente.
Perché ho scelto Site24x7
Ho scelto Site24x7 per i suoi test di transazioni sintetiche, che aiutano a monitorare la disponibilità dei servizi simulando i flussi di lavoro di utenti e sistemi. La piattaforma supporta inoltre i principali ambienti cloud e include il monitoraggio delle prestazioni applicative per tracciare il comportamento delle applicazioni e individuare le problematiche. Le sue funzioni di automazione agevolano la gestione degli incidenti, aiutando i team a rispondere più rapidamente e gestire le risorse in modo più efficiente.
Caratteristiche principali di Site24x7
Oltre ai test di transazioni sintetiche, Site24x7 offre:
- Monitoraggio del traffico reale (RUM): Questa funzionalità fornisce informazioni sull'effettiva esperienza utente rilevando e analizzando le interazioni degli utenti con le applicazioni.
- Gestione dei log: Con questa funzione puoi aggregare e analizzare i log provenienti da diverse fonti per ottenere una visione completa dello stato del sistema.
- Monitoraggio della rete: Offre una panoramica sulle prestazioni della rete aiutando a risolvere problemi di connettività e ottimizzare l'infrastruttura di rete.
Integrazioni di Site24x7
Le integrazioni includono Slack, ServiceNow, Moogsoft, Jira, PagerDuty, Freshservice, Microsoft Teams, Amazon EventBridge, Zapier e ManageEngine Analytics Plus.
Pros and Cons
Pros:
- Monitoraggio flessibile che si integra facilmente con molteplici componenti dell'infrastruttura
- Monitoraggio completo per svariati sistemi
- Il monitoraggio full-stack potenziato dall'AI supporta la gestione di infrastrutture multicloud
Cons:
- Configurazione complessa rallenta l'impostazione iniziale e la comprensione della piattaforma
- Bug nelle notifiche causano problemi all'aggiunta di nuove configurazioni di monitoraggio
New Product Updates from Site24x7

Site24x7 Adds Discovery Issues for AWS Monitoring
Site24x7 added Discovery Issues for AWS monitoring, helping teams identify why resources are not being discovered across services and regions. The feature surfaces permission gaps, policy restrictions, and blocked API actions to support faster troubleshooting. For more information, visit Site24x7’s official site.
 .
.Ideale per il monitoraggio delle prestazioni delle applicazioni
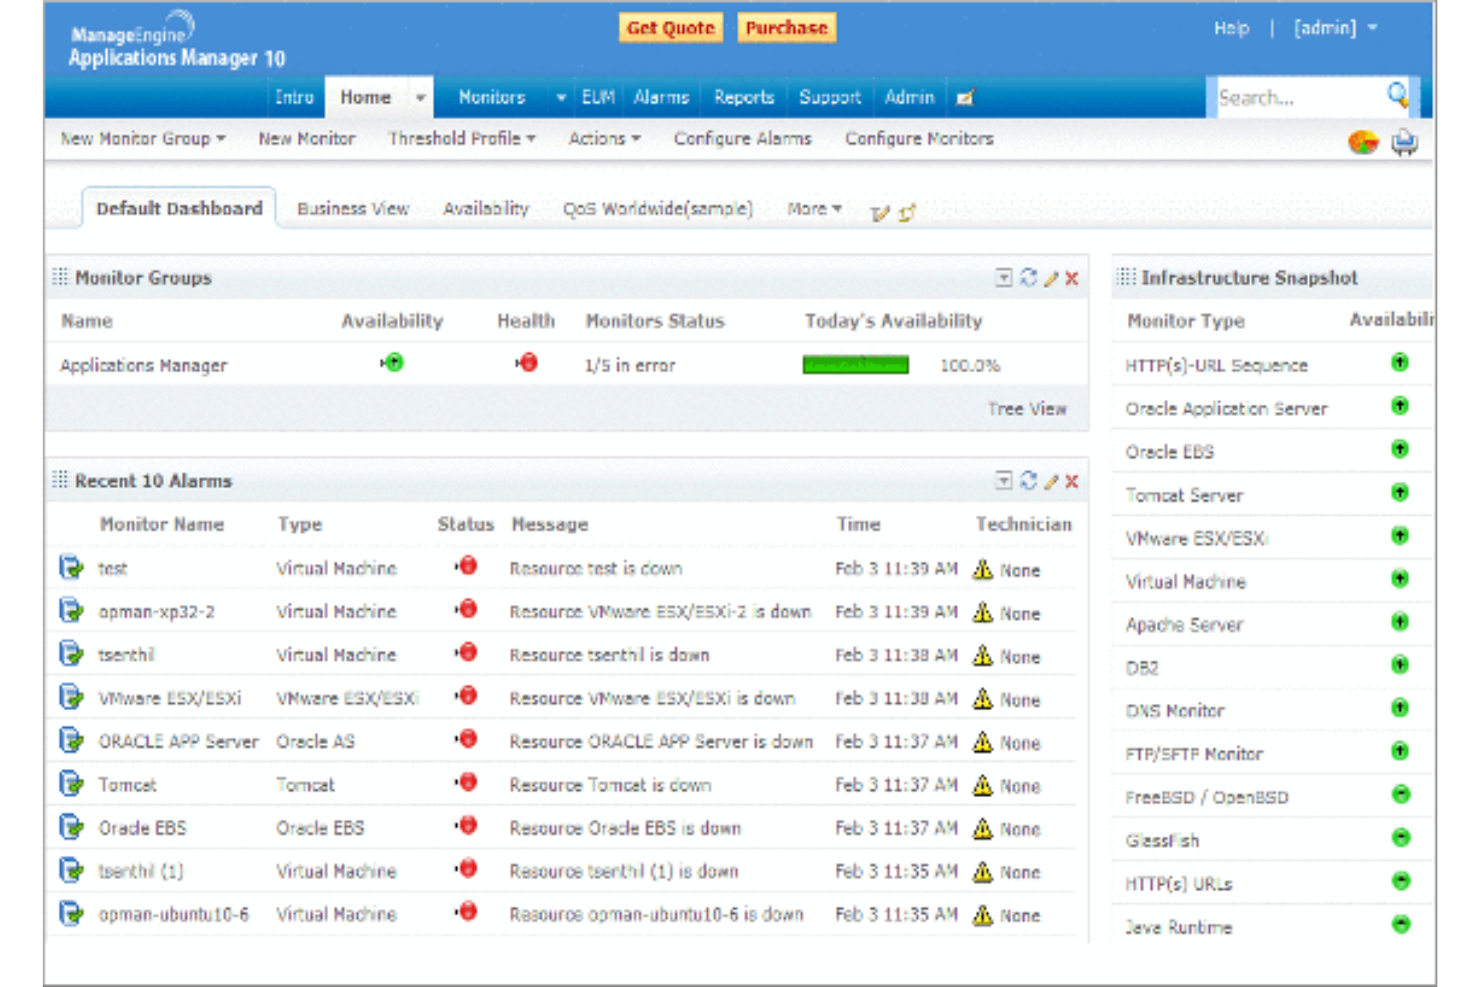
ManageEngine Applications Manager è uno strumento robusto che offre un monitoraggio delle prestazioni end-to-end per un ampio spettro di applicazioni, database, server e sistemi. È particolarmente abile nel fornire approfondimenti sulle prestazioni delle applicazioni, rendendolo una soluzione ottimale per il monitoraggio delle prestazioni delle applicazioni.
Perché ho scelto ManageEngine Applications Manager:
Nella selezione di ManageEngine Applications Manager per questa lista, ho tenuto conto della sua capacità completa di monitorare e gestire applicazioni in diversi ambienti. Si distingue per la fornitura di dettagliate informazioni sulle prestazioni delle applicazioni, agevolando il rilevamento e la risoluzione rapida dei problemi.
Di conseguenza, l'ho ritenuto il 'migliore per il monitoraggio delle prestazioni delle applicazioni' grazie alle sue superiori capacità in quest'area specifica.
Funzionalità di spicco e integrazioni:
Alcune delle funzionalità di spicco di ManageEngine Applications Manager includono la capacità di rilevamento delle applicazioni, il monitoraggio approfondito dei componenti e l'automazione intelligente. Queste caratteristiche permettono un monitoraggio robusto e la risoluzione automatica dei problemi, assicurando prestazioni ottimali delle applicazioni.
Per quanto riguarda le integrazioni, ManageEngine Applications Manager può integrarsi con varie applicazioni, server e database, come Oracle, MySQL, Microsoft SQL Server, SAP e molti altri.
Pros and Cons
Pros:
- Monitoraggio dettagliato delle prestazioni delle applicazioni
- Ampia compatibilità con varie applicazioni, server e database
- Automazione intelligente per la risoluzione dei problemi
Cons:
- Può essere complesso da configurare e impostare
- Il costo iniziale elevato potrebbe essere un ostacolo per aziende di piccole dimensioni
- L'interfaccia potrebbe non essere intuitiva quanto alcune alternative
New Product Updates from ManageEngine Applications Manager
Oracle Cloud Application Monitoring Now Available in ManageEngine Applications Manager
ManageEngine Applications Manager introduces Oracle Cloud Application Monitoring, Oracle Cloud Function Monitoring, and Oracle Cloud NAT Gateway Monitoring. These new capabilities help teams monitor Oracle Cloud applications, serverless workloads, and network resources from a single platform. For more information, visit ManageEngine Applications Manager's official site.
 .
.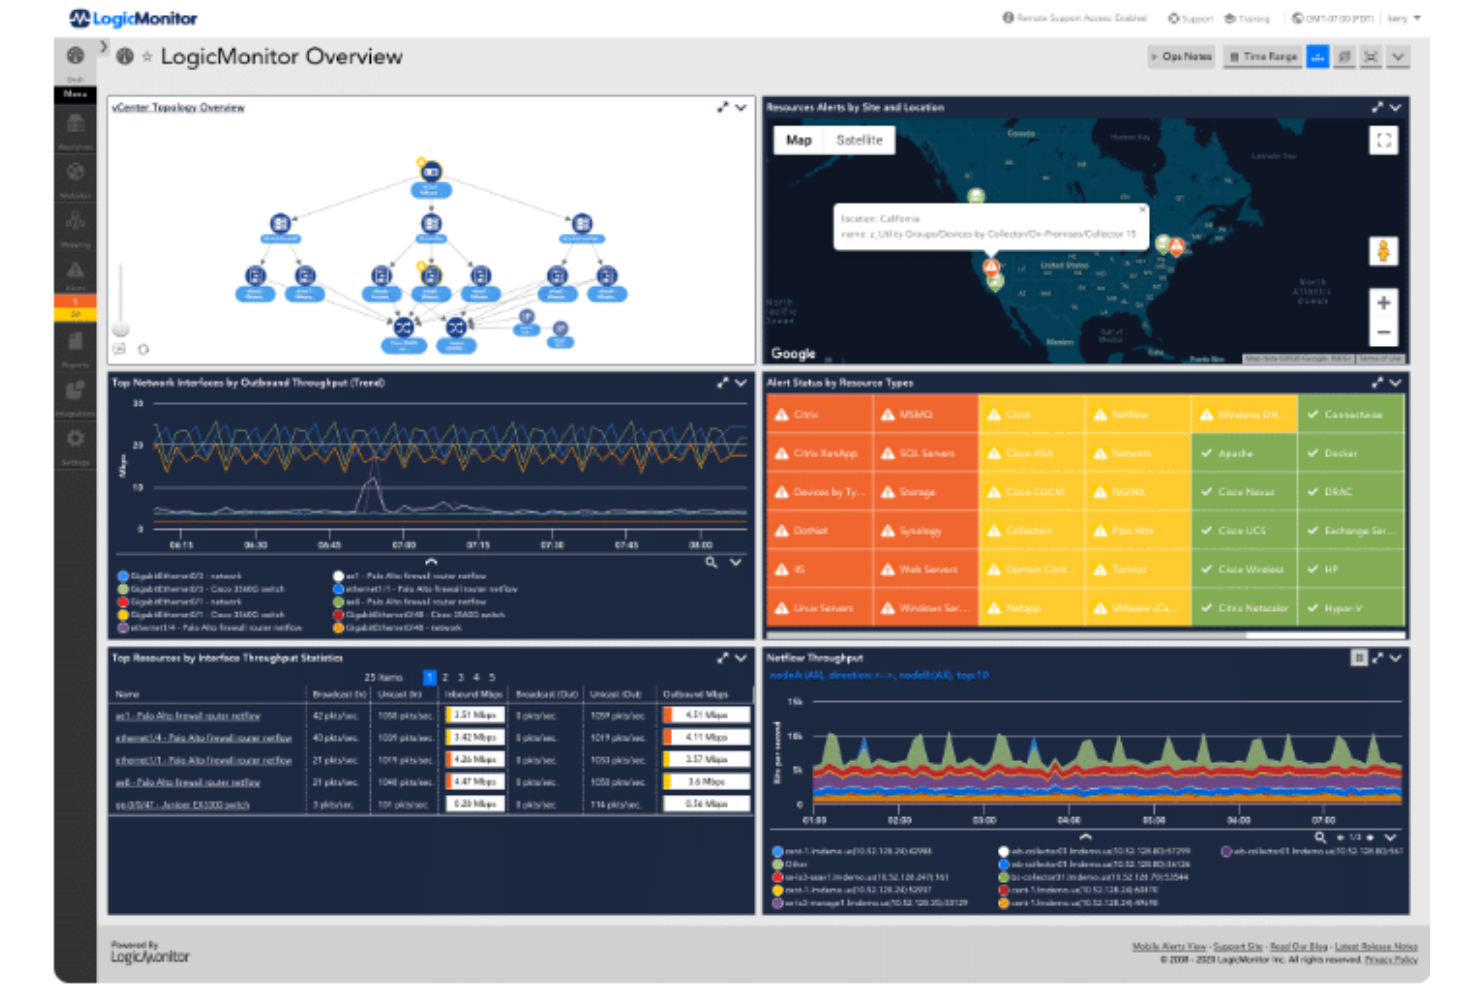
LogicMonitor è una piattaforma SaaS automatizzata per il monitoraggio delle prestazioni IT che offre una visibilità completa sulle infrastrutture IT complesse. Grazie alla sua capacità di gestire ambienti sia on-premises che cloud, si pone come una delle migliori soluzioni per il monitoraggio di infrastrutture IT ibride.
Perché ho scelto LogicMonitor:
Nella scelta di uno strumento che eccelle nel monitoraggio delle infrastrutture IT ibride, LogicMonitor è stata la mia scelta. La sua versatilità nel supportare una vasta gamma di infrastrutture, comprese quelle cloud, on-premises e ibride, lo distingue dagli altri. Ho determinato LogicMonitor come il migliore per il monitoraggio delle infrastrutture IT ibride grazie alla funzione di rilevamento automatico dei dispositivi e alla capacità di gestire sistemi diversi.
Funzionalità di spicco e integrazioni:
La funzione di rilevamento automatico dei dispositivi di LogicMonitor è notevole perché semplifica il processo di aggiunta di nuovi dispositivi al sistema. Offre inoltre dashboard personalizzabili, garantendo agli utenti la flessibilità di monitorare l'infrastruttura in base alle proprie esigenze specifiche.
In termini di integrazioni, LogicMonitor supporta varie piattaforme cloud come AWS, Google Cloud e Azure. Inoltre, si integra con strumenti chiave per il business come ServiceNow, Slack e Jira, agevolando operazioni più efficienti.
Pros and Cons
Pros:
- Rilevamento automatico dei dispositivi per una configurazione semplice
- Dashboard personalizzabili per un monitoraggio su misura
- Supporta varie piattaforme cloud e strumenti aziendali
Cons:
- I prezzi non sono trasparenti
- Alcuni utenti potrebbero trovare l'interfaccia meno intuitiva
- L'impostazione dei dashboard personalizzati può richiedere competenze tecniche
New Relic è una piattaforma di analisi software basata su cloud che offre approfondimenti sui dati in tempo reale per aiutare le aziende a valutare le prestazioni delle proprie applicazioni software. Grazie alle sue metriche di salute approfondite, è particolarmente abile nel fornire informazioni dettagliate sullo stato e l'efficienza di questi sistemi.
Perché ho scelto New Relic:
New Relic mi ha colpito per le sue potenti capacità di analisi, ed è per questo che l'ho selezionato per questa lista. La sua abilità nel fornire metriche di salute granulari e in tempo reale lo distingue dagli altri strumenti. Credo che New Relic sia il migliore per metriche di salute dettagliate grazie alle sue funzionalità complete di analisi e visualizzazione dei dati, che forniscono approfondimenti più approfonditi sulle prestazioni delle applicazioni.
Caratteristiche principali e integrazioni:
Una delle caratteristiche distintive di New Relic è la sua capacità di monitoraggio delle prestazioni delle applicazioni (APM), che offre una panoramica completa sulla salute delle tue applicazioni. Inoltre, offre il monitoraggio reale degli utenti, che fornisce dati su come gli utenti interagiscono con le tue applicazioni.
New Relic si integra perfettamente con una varietà di piattaforme come AWS, Azure, Google Cloud Platform e Kubernetes. Queste integrazioni aiutano a fornire una visione più olistica della tua infrastruttura e delle applicazioni.
Pros and Cons
Pros:
- Metriche di salute dettagliate per approfondimenti approfonditi
- Ampia gamma di integrazioni con piattaforme cloud
- Capacità complete di monitoraggio delle prestazioni delle applicazioni
Cons:
- Prezzo elevato per le piccole imprese
- Un'interfaccia complessa che può risultare difficile per i principianti
- Le funzionalità estese possono causare un sovraccarico di informazioni per alcuni utenti
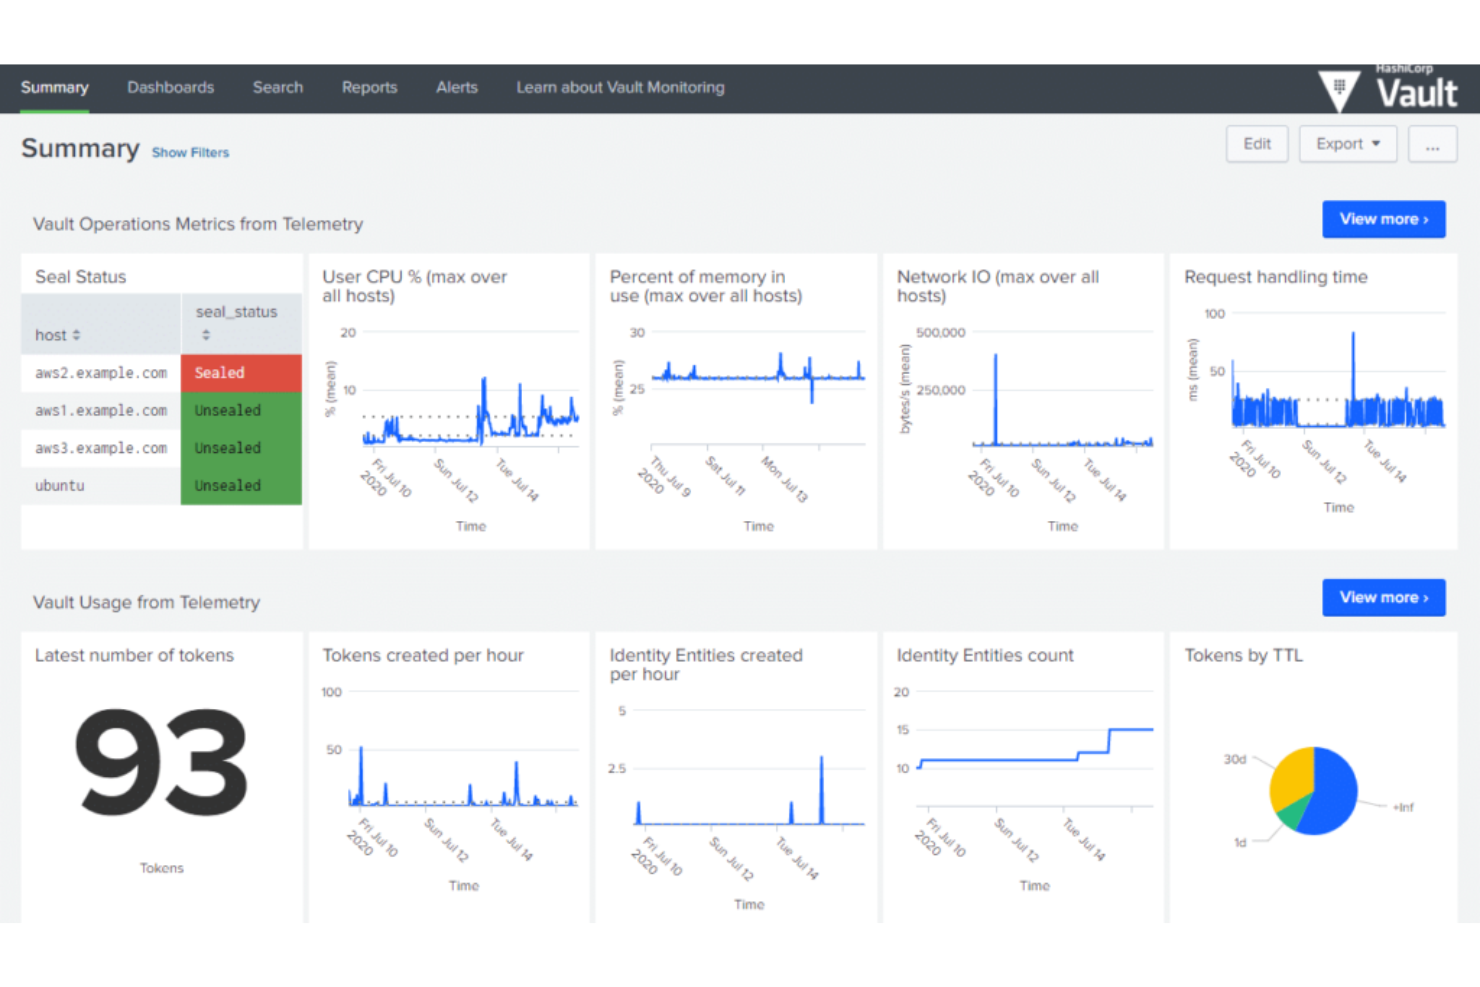
HashiCorp offre una suite di strumenti open-source per consentire alle aziende di definire, fornire e gestire le infrastrutture dei data center utilizzando un approccio dichiarativo basato sul codice. È particolarmente adatto alle organizzazioni che desiderano adottare la metodologia Infrastructure as Code (IaC) per migliorare l'efficienza e mantenere la coerenza nella gestione dell'infrastruttura.
Perché ho scelto HashiCorp:
Ho incluso HashiCorp nella mia selezione grazie alle sue solide capacità IaC, che lo rendono piuttosto distintivo nel panorama della gestione dell'infrastruttura. Questo approccio IaC favorisce efficienza, ripetibilità e sicurezza nell'approvvigionamento e nella gestione dell'infrastruttura.
Per questi motivi, ritengo HashiCorp il 'Migliore per' le organizzazioni interessate a sfruttare l'approccio IaC.
Funzionalità chiave e integrazioni:
Strumenti di HashiCorp come Terraform, Vault e Consul offrono una vasta gamma di funzionalità che coprono l'approvvigionamento dell'infrastruttura, la sicurezza e il networking dei servizi. La funzionalità di codifica dell'infrastruttura di Terraform lo rende estremamente prezioso per il deployment e la gestione di infrastrutture di qualsiasi scala.
Le integrazioni significative includono quelle con AWS, GCP e Azure, estendendo efficacemente le sue capacità IaC su più ambienti cloud.
Pros and Cons
Pros:
- Eccellenti capacità di Infrastructure as Code
- Si integra con le principali piattaforme cloud
- Offre una varietà di strumenti per diversi aspetti della gestione dell'infrastruttura
Cons:
- Può essere complesso da configurare e utilizzare
- Le versioni enterprise possono essere costose per i team più piccoli
- Il supporto per gli utenti gratuiti potrebbe essere limitato
IBM Cloud Monitoring è un servizio di monitoraggio che fornisce informazioni in tempo reale sulle prestazioni delle tue applicazioni e infrastrutture ospitate sul cloud IBM. Questo strumento è stato appositamente progettato per funzionare in modo fluido con l'ambiente cloud IBM, rendendolo la scelta migliore per chi investe in questo ecosistema.
Perché ho scelto IBM Cloud Monitoring:
La scelta di IBM Cloud Monitoring per questa lista è stata semplice considerando la sua superiore integrazione e compatibilità nativa con l'ambiente cloud IBM. Si distingue per la sua interoperabilità senza soluzione di continuità con i vari servizi del cloud IBM.
Ho giudicato questo servizio 'il migliore per l'ambiente IBM cloud' grazie alla sua capacità di fornire metriche dettagliate, dashboard e avvisi specifici per il cloud IBM.
Funzionalità principali e integrazioni:
Le metriche dettagliate di IBM Cloud Monitoring offrono un'enorme quantità di dati sulle prestazioni della tua infrastruttura. È degna di nota la sua capacità di fornire dati di monitoraggio in tempo reale e facilitare il rilevamento rapido delle anomalie.
Per quanto riguarda le integrazioni, si integra perfettamente con diversi servizi cloud IBM, tra cui IBM Cloud Databases, IBM Kubernetes Service e IBM Cloud Functions, solo per citarne alcuni.
Pros and Cons
Pros:
- Integrazione senza soluzione di continuità con i servizi IBM cloud
- Metriche dettagliate offrono una visione completa
- Monitoraggio in tempo reale e rilevamento anomalie
Cons:
- La struttura dei prezzi può essere complessa e dipendere dall'utilizzo
- Potrebbe non integrarsi bene con servizi non-IBM
- L'interfaccia potrebbe richiedere un periodo di apprendimento per i nuovi utenti
Ideale per dati unificati di applicazioni e infrastrutture
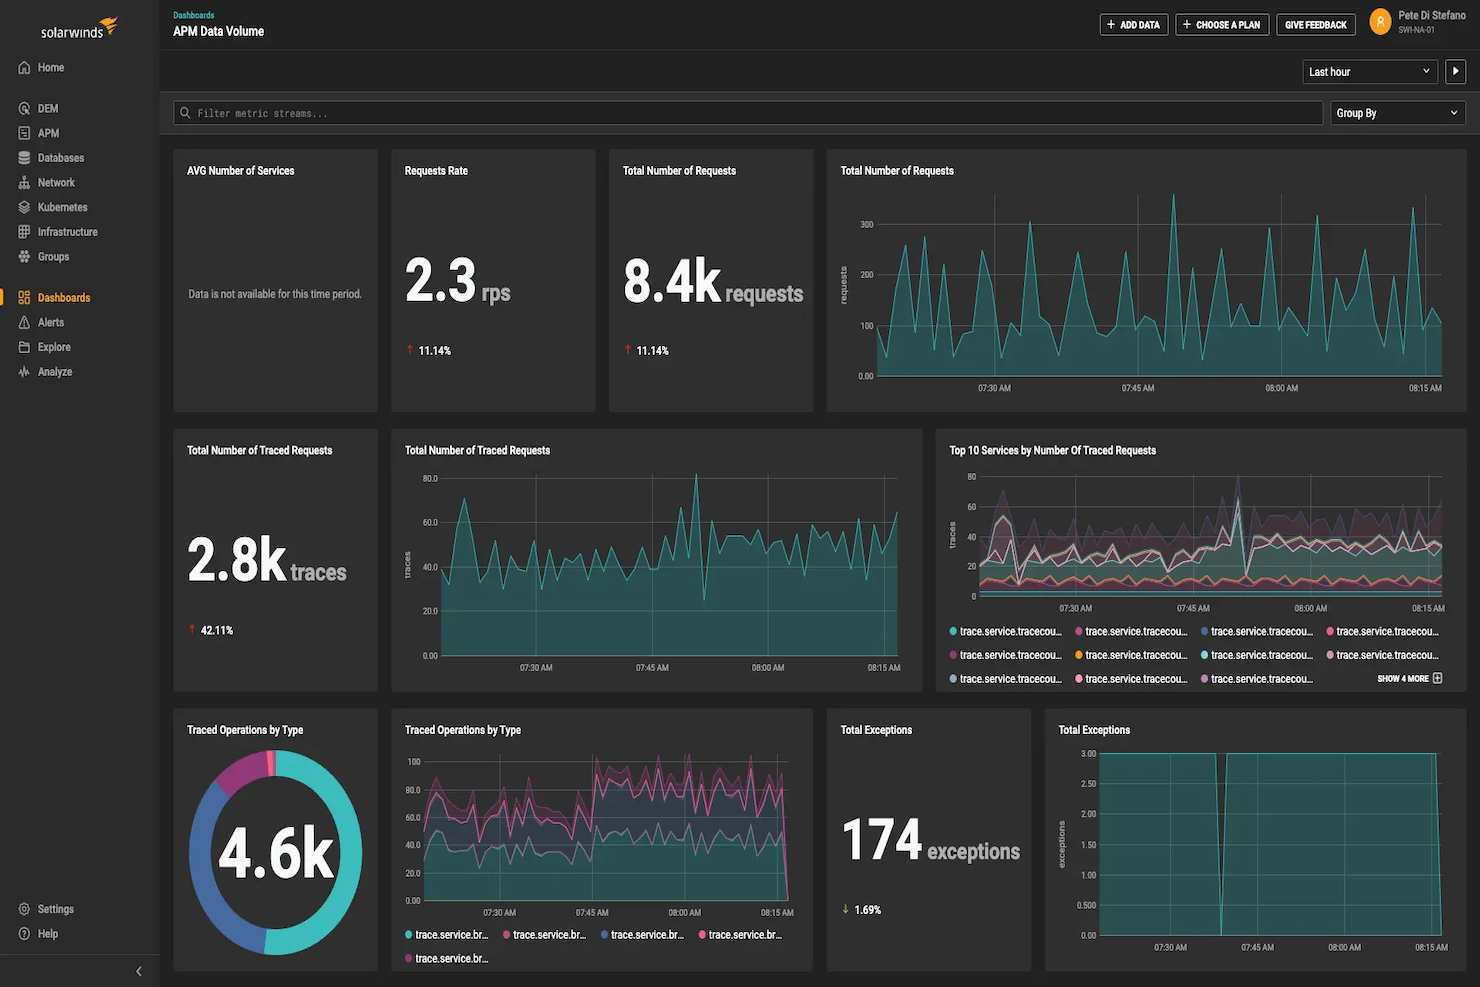
SolarWinds Observability SaaS è una piattaforma di monitoraggio dell'infrastruttura cloud progettata per team IT e DevOps. Offre visibilità su applicazioni cloud, infrastruttura, log, database, reti e dati sull'esperienza utente. Affronta le complessità della gestione di ambienti IT eterogenei, fornendo strumenti per semplificare i processi di monitoraggio, migliorare la risoluzione dei problemi e offrire insight attuabili, rendendolo ideale per i team che vogliono ottimizzare le operazioni IT e migliorare le prestazioni dei sistemi.
Perché ho scelto SolarWinds Observability SaaS
Ho scelto SolarWinds Observability SaaS per la sua capacità di fornire una visibilità completa attraverso dati unificati di applicazioni e infrastrutture. Questa caratteristica è fondamentale per comprendere pienamente gli ambienti IT, che comprende anche supporto a framework open-source e integrazioni di terze parti. Inoltre, le sue funzionalità AIOps, potenziate dal machine learning, aiutano a ridurre l'affaticamento da alert dando priorità ai problemi reali, rendendolo uno strumento prezioso per i team sopraffatti da notifiche costanti.
Funzionalità principali di SolarWinds Observability SaaS
Ecco alcune funzionalità che potresti trovare utili:
- Strumentazione automatica e mappatura delle dipendenze: Questa funzione consente al tuo team di monitorare e mappare le dipendenze in modo efficiente senza interventi manuali.
- Rilevamento delle anomalie in tempo reale e analisi della causa radice basata su AI: Aiuta a individuare e risolvere rapidamente i problemi prima che impattino sulle prestazioni del sistema.
- Implementazione rapida e interfaccia intuitiva: Il team può ottenere rapidamente valore grazie a un'interfaccia intuitiva che semplifica la configurazione e la gestione continua.
- Supporto ai framework open-source: Garantisce un'integrazione semplice con gli strumenti esistenti e flessibilità nella gestione dell'infrastruttura IT.
Integrazioni SolarWinds Observability SaaS
Le integrazioni includono AWS, Azure, Google Cloud Platform, Kubernetes, ServiceNow, Slack, Microsoft Teams, Jira, Splunk e PagerDuty.
Pros and Cons
Pros:
- Efficace per troubleshooting e insight operativi
- Archiviazione dati completa con supporto AWS S3
- Le funzionalità AIOps riducono l'affaticamento da alert
Cons:
- Opzioni di personalizzazione limitate per dashboard e report
- Curva di apprendimento ripida per configurazioni complesse

Zabbix Cloud Monitoring è uno strumento potente che offre il monitoraggio in tempo reale di server, macchine virtuali e servizi cloud. Riconosciuto per la sua natura open source, si distingue come il migliore per le organizzazioni che cercano personalizzazione ed economicità.
Perché ho scelto Zabbix Cloud Monitoring:
Ho scelto Zabbix per la sua natura open source che offre possibilità di personalizzazione e il suo ampio spettro di monitoraggio che include server, VM e servizi cloud. Si distingue per la sua flessibilità, permettendo di modificarlo in base a esigenze specifiche.
Per questo motivo, si aggiudica il riconoscimento di essere il 'Migliore per' il monitoraggio cloud open source, ideale per chi valorizza flessibilità e un approccio pratico.
Funzionalità distintive e integrazioni:
Zabbix eccelle nel rilevamento della rete, offrendo la scoperta automatica di dispositivi e configurazioni di rete. Fornisce strumenti avanzati di visualizzazione dei dati che permettono di comprendere le statistiche di monitoraggio a colpo d'occhio. In quanto strumento open source, Zabbix si integra con una vasta gamma di altri sistemi, tra cui MySQL, PostgreSQL e IBM DB2.
Pros and Cons
Pros:
- Open source, offre possibilità di personalizzazione
- Ampia gamma di integrazioni
- Funzionalità di monitoraggio complete
Cons:
- Curva di apprendimento ripida per utenti non tecnici
- La configurazione può essere complessa
- Il supporto a pagamento è relativamente costoso
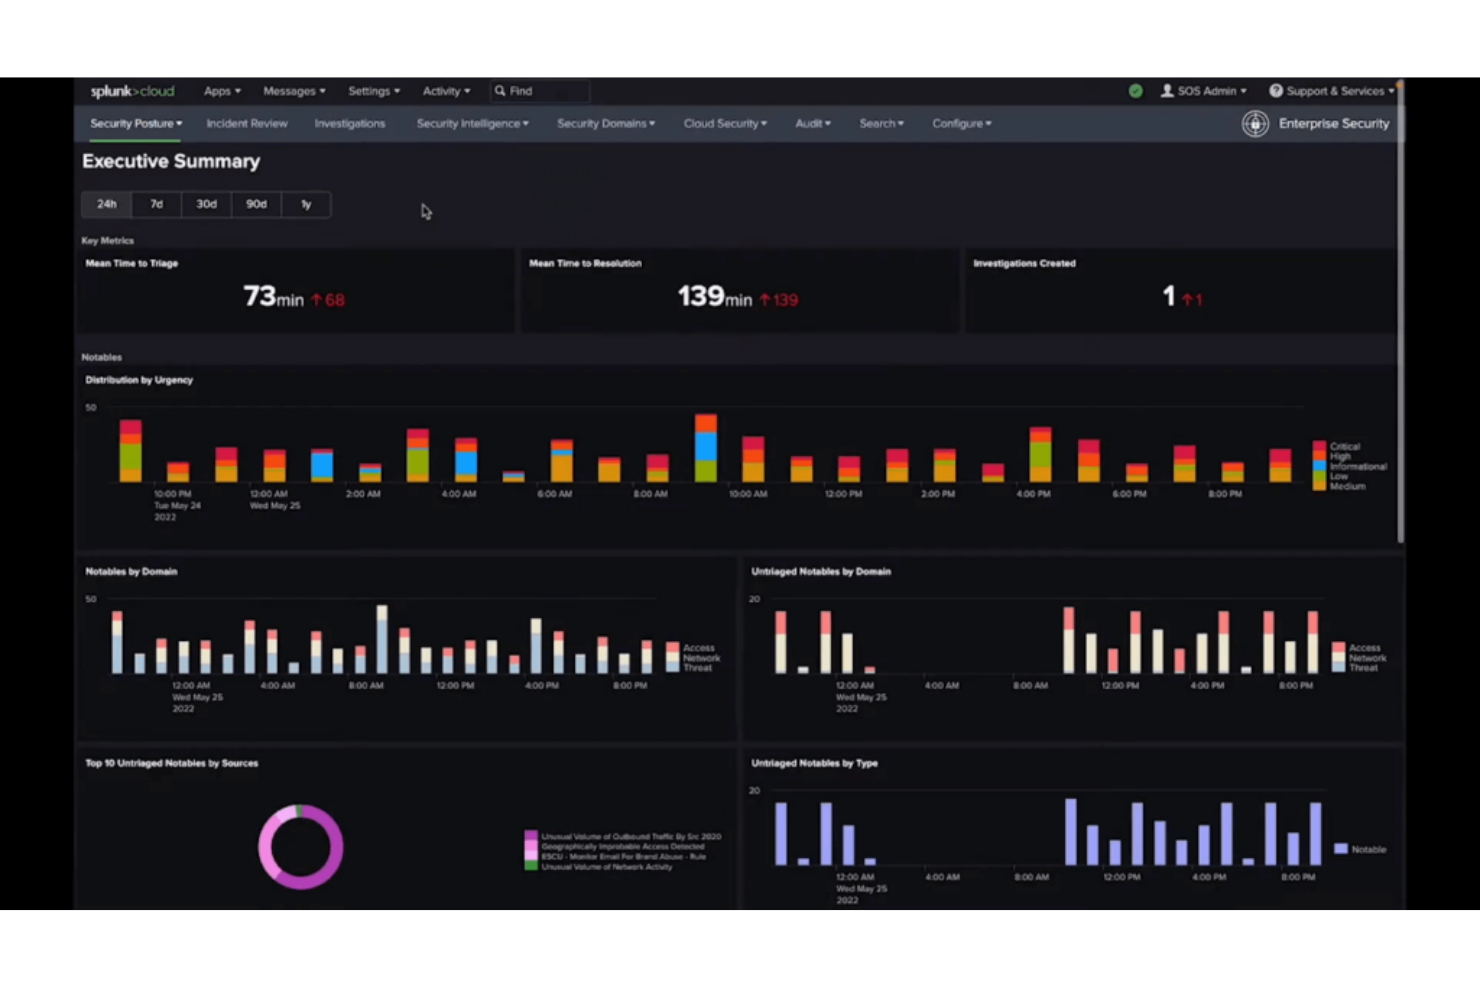
Splunk Infrastructure Monitoring è uno strumento che offre osservabilità e analisi in tempo reale per infrastrutture cloud e microservizi. Essendo una piattaforma nota per velocità ed efficienza, è la scelta ideale per le aziende che necessitano di insight immediati sulle performance del proprio cloud.
Perché ho scelto Splunk Infrastructure Monitoring:
Ho selezionato Splunk Infrastructure Monitoring per le sue forti capacità nel fornire insight in tempo reale, che lo rendono un punto di riferimento nello scenario dell’osservabilità.
È la ricchezza di queste analisi che mi ha portato a ritenerlo il 'Migliore per' l’osservabilità in tempo reale, particolarmente utile per le aziende che richiedono una conoscenza immediata delle loro operazioni cloud.
Funzionalità distintive e integrazioni:
Splunk Infrastructure Monitoring dispone di un’architettura di streaming in tempo reale che permette di fornire insight immediati. Include anche funzionalità come il baselining dinamico istantaneo e il rilevamento di anomalie, per individuare problemi in modo proattivo.
Le integrazioni chiave includono quelle con AWS, Google Cloud e Azure, permettendone il monitoraggio senza interruzioni su ambienti multi-cloud.
Pros and Cons
Pros:
- Offre osservabilità in tempo reale
- Include funzionalità di rilevamento proattivo dei problemi
- Si integra bene con le principali piattaforme cloud
Cons:
- Potrebbe risultare costoso per le piccole imprese
- Interfaccia complessa che può richiedere tempo di apprendimento
- Memorizzazione limitata dei dati storici
ThousandEyes è uno strumento completo che offre una visibilità approfondita sui percorsi di rete. Si distingue per la mappatura dei percorsi di rete, l'individuazione dei colli di bottiglia prestazionali e il monitoraggio costante dello stato di tutti i percorsi, rendendolo il migliore per una visibilità completa su ogni percorso di rete.
Perché ho scelto ThousandEyes:
Ho selezionato ThousandEyes per la sua particolare attenzione alla visibilità totale della rete. Si differenzia per il suo approccio al monitoraggio, in quanto offre una visione end-to-end di tutti i percorsi di rete, non solo di alcuni componenti limitati.
Lo considero il 'migliore per' la visibilità su ogni percorso di rete grazie alla sua straordinaria capacità di illuminare l'intera struttura, portando alla luce potenziali problemi e permettendo interventi rapidi.
Caratteristiche principali e integrazioni:
ThousandEyes si distingue grazie a funzionalità come la visualizzazione dei percorsi, che offre una panoramica chiara dell'intera rete, e la capacità di monitorare le prestazioni di ISP, CDN, DNS e altro ancora. Si integra senza problemi con varie piattaforme, includendo la condivisione di dati con strumenti come Slack, PagerDuty e ServiceNow, oltre a importazione/esportazione dati per ulteriori analisi.
Pros and Cons
Pros:
- Offre una visibilità approfondita su tutti i percorsi di rete
- Funzione di visualizzazione dei percorsi per una mappatura chiara della rete
- Ampia gamma di integrazioni utili
Cons:
- L'interfaccia può risultare un po' complessa per i principianti
- Il modello di prezzo personalizzato potrebbe non essere adatto a tutti i budget
- Mancano alcune funzionalità avanzate di rilevamento anomalie basate su AI
Altri Strumenti di Monitoraggio dell'Infrastruttura Cloud
Di seguito trovi un elenco di ulteriori strumenti di monitoraggio dell’infrastruttura cloud che ho selezionato, ma che non sono rientrati nella top 10.
- meshIQ
Ideale per il monitoraggio e la gestione del middleware
- Dynatrace
Ideale per il monitoraggio assistito dall'IA
- Checkmk
Ideale per il monitoraggio completo dell'infrastruttura IT
- Datadog
Migliore per l'osservabilità full-stack
- Dotcom Monitor
Ideale per monitoraggio basato su agenti e senza agenti


Recensioni Software Correlati
Se qui non hai ancora trovato ciò che cerchi, dai un'occhiata a questi strumenti alternativi che abbiamo testato e valutato.
- Software di Monitoraggio Rete
- Software di Monitoraggio Server
- Soluzioni SD-Wan
- Strumenti di Monitoraggio dell’Infrastruttura
- Packet Sniffer
- Strumenti di Monitoraggio Applicazioni
Come Valuto gli Strumenti di Monitoraggio dell'Infrastruttura Cloud
Quando valuto questi strumenti, considero due livelli: requisiti di base e i fattori differenzianti che distinguono i buoni dai migliori.
Funzionalità di Base (Requisiti Fondamentali per Questa Lista)
Queste capacità di base servono come criteri di accettazione per l'inclusione nella mia lista:
- Monitoraggio delle Risorse Multi-Cloud: Verifico se uno strumento dispone di integrazioni native con AWS, Azure e GCP e quanti servizi copre per ciascun provider già pronti all'uso.
- Metriche in Tempo Reale & Dashboard: Qui la granularità è importante. Cerco interrogazione a intervalli inferiori al minuto e dashboard personalizzabili che i team possano adattare a cluster o regioni specifiche.
- Avvisi & Rilevamento delle Anomalie: Valuto come vengono configurati gli avvisi, quali canali di notifica sono supportati e se lo strumento offre soglie dinamiche oltre a regole statiche.
- Correlazione di Log & Eventi: Collegare un picco della CPU a un deployment fallito è la vera prova. Cerco visualizzazioni unificate che colleghino log ed eventi alle timeline delle metriche.
- Visibilità su Container & Orchestrazione: Controllo la presenza di metriche a livello di cluster, nodo, pod e carico di lavoro attraverso le piattaforme di orchestrazione.
- Auto-Discovery & Topologia Dinamica: Le nuove istanze vengono continuamente create: valuto se lo strumento le rileva automaticamente e mappa le dipendenze senza input manuali.
Valuto ciascun fornitore su una scala da 0 (non offre la funzionalità) a 5 (eccelle in quest'area) per ciascun criterio.
I fornitori devono raggiungere un punteggio medio minimo per essere considerati per l'inclusione nella mia lista. Da lì, considero ciò che distingue ogni piattaforma.
Fattori Differenzianti (Cosa Distingue i Fornitori)
Dopo aver selezionato la mia lista, ecco come confronto i diversi fornitori in questo settore:
Funzionalità Distintive
Cerco analisi delle cause principali basate su intelligenza artificiale in grado di aiutare i team a filtrare il rumore durante la gestione degli incidenti, dando priorità agli avvisi realmente utili. Gli strumenti che offrono una profonda osservabilità dei costi permettono a DevOps e SRE di collegare le prestazioni dell'infrastruttura alle spese cloud, fondamentale per le organizzazioni focalizzate sul FinOps. Tracing distribuito e APM end-to-end sono particolarmente preziosi quando è necessario collegare dati di basso livello dell'infrastruttura alle esperienze applicative, supportando una rapida risoluzione dei problemi in ambienti a microservizi.
Oltre le Funzionalità
La trasparenza dei prezzi è un importante fattore distintivo in questo settore. Valuto se i fornitori applicano tariffe per host, volume di dati o metriche personalizzate e quanto i costi rimangono prevedibili con la crescita. Anche l'ampiezza dell'ecosistema di integrazioni è importante. Verifico la compatibilità con OpenTelemetry e le connessioni native a strumenti ITSM e CI/CD come ServiceNow e Jenkins, dato che il monitoraggio raramente vive isolato. Per i settori regolamentati, guardo alle certificazioni di conformità come SOC 2 Type II, HIPAA e FedRAMP, oltre a funzionalità RBAC e log di audit.
Come Scegliere uno Strumento di Monitoraggio dell'Infrastruttura Cloud
È facile perdersi tra lunghe liste di funzionalità e strutture di prezzo complesse. Per aiutarti a rimanere focalizzato durante la tua selezione software, ecco una checklist di fattori da tenere a mente:
| Fattore | Cosa Considerare |
|---|---|
| Scalabilità | Assicurati che lo strumento possa gestire esigenze infrastrutturali in crescita. La tua soluzione di monitoraggio dovrebbe scalare man mano che il tuo ambiente cloud si espande, aggiungendo nuove istanze e servizi senza problemi di prestazioni. |
| Integrazioni | Scegli uno strumento che si integri con i provider cloud attualmente in uso (AWS, Azure, GCP) e servizi di terze parti (come Slack, Jira). Questo aiuta a centralizzare i dati di monitoraggio e ad automatizzare gli avvisi. |
| Personalizzazione | Scegli una soluzione che ti permetta di creare dashboard, report e avvisi personalizzati per adattarsi alle esigenze specifiche e ai flussi di lavoro del tuo team. La flessibilità nella visualizzazione dei dati è fondamentale. |
| Semplicità d'Uso | Un'interfaccia intuitiva riduce la curva di apprendimento e velocizza la risoluzione dei problemi. Assicurati che lo strumento sia comprensibile sia per sviluppatori sia per utenti non tecnici. |
| Budget | Controlla la struttura dei prezzi per costi nascosti come conservazione dei dati, assistenza premium o integrazioni aggiuntive. Confronta i diversi livelli di prezzo per evitare di pagare più del necessario. |
| Salvaguardie di Sicurezza | Assicurati che lo strumento offra crittografia, controllo di accesso basato sui ruoli e connessioni API sicure per proteggere i dati infrastrutturali sensibili. La conformità a standard di settore (come SOC 2) è un vantaggio. |
| Automazione | Cerca funzionalità di automazione come rilevamento anomalie, auto-risoluzione e ottimizzazione delle prestazioni per ridurre il lavoro manuale e migliorare l'efficienza. |
| Avvisi in tempo reale | Assicurati che lo strumento fornisca avvisi e notifiche in tempo reale su più canali (email, Slack, ecc.) per rispondere rapidamente ai problemi. |
Tendenze negli strumenti di monitoraggio dell'infrastruttura cloud
Nella mia ricerca, ho consultato innumerevoli aggiornamenti di prodotto, comunicati stampa e registri di rilascio di diversi fornitori di strumenti di monitoraggio dell'infrastruttura cloud. Ecco alcune delle tendenze emergenti che sto osservando:
- Analisi guidate dall’IA: Sempre più strumenti utilizzano intelligenza artificiale e apprendimento automatico per prevedere guasti, rilevare anomalie e suggerire soluzioni prima che i problemi degenerino. Questo aiuta i team a essere proattivi invece che reattivi.
- Monitoraggio granulare dei costi: Gli strumenti di monitoraggio ora forniscono analisi approfondite sulla spesa in cloud, aiutando i team a individuare sprechi e ottimizzare l'allocazione delle risorse. Alcuni strumenti offrono anche consigli automatizzati per risparmiare sui costi.
- Osservabilità unificata: I fornitori stanno unificando il monitoraggio di infrastrutture, applicazioni e reti in una singola piattaforma. Questo permette ai team di avere una visione completa dell’ambiente senza dover cambiare strumento.
- Monitoraggio perimetrale (edge): Con lo spostamento di sempre più carichi di lavoro verso l'edge, gli strumenti si stanno ampliando per monitorare dispositivi edge e microservizi. Questo aiuta i team a mantenere prestazioni e disponibilità in ambienti distribuiti.
- Monitoraggio della sicurezza potenziato: Gli strumenti aggiungono funzioni di rilevamento delle minacce in tempo reale e registrazione degli eventi di sicurezza. Alcuni ora offrono integrazioni con piattaforme SIEM (Security Information and Event Management) per una risposta più rapida agli incidenti.
Cosa sono gli strumenti di monitoraggio dell'infrastruttura cloud?
Gli strumenti di monitoraggio dell'infrastruttura cloud forniscono un modo automatizzato per supervisionare i processi operativi all'interno di un'infrastruttura IT basata su cloud. Utilizzati principalmente da professionisti IT, ingegneri di rete e amministratori di sistema, questi strumenti sono preziosi per monitorare lo stato, le prestazioni e la salute di server, database, reti e servizi applicativi ospitati nel cloud.
Svolgono una funzione essenziale nell'identificare rapidamente i problemi, prevenire possibili interruzioni e garantire il regolare svolgimento delle operazioni aziendali. Questi strumenti di monitoraggio offrono approfondimenti e analisi che aiutano a ottimizzare le risorse, svolgendo quindi un ruolo chiave nelle decisioni strategiche e nel miglioramento complessivo delle prestazioni del sistema.
Caratteristiche degli strumenti di monitoraggio dell'infrastruttura cloud
Quando selezioni strumenti di monitoraggio dell'infrastruttura cloud, fai attenzione alle seguenti caratteristiche chiave:
- Monitoraggio in tempo reale: Fornisce visibilità immediata sulle prestazioni dell'infrastruttura, aiutandoti a individuare e risolvere rapidamente i problemi.
- Cruscotti personalizzati: Permette di creare viste personalizzate delle metriche chiave, rendendo più facile tenere traccia di ciò che conta di più per il tuo team.
- Rilevamento anomalie: Utilizza l'apprendimento automatico e il software di monitoraggio dei log per identificare schemi insoliti e segnalare potenziali problemi prima che impattino le prestazioni.
- Avvisi e notifiche: Invia segnalazioni attraverso vari canali (email, Slack, ecc.) per notificare il tuo team di eventuali problemi in tempo reale.
- Aggregazione dei log: Raccoglie e organizza i log provenienti da diversi sistemi, facilitando la risoluzione dei problemi e l'individuazione delle cause principali.
- Monitoraggio dei costi: Suddivide la spesa cloud per servizio, regione o progetto, aiutandoti a individuare sprechi e ottimizzare i costi.
- Controllo degli accessi basato sui ruoli: Ti consente di definire i permessi degli utenti per assicurare che ciascun membro del team abbia accesso solo ai dati necessari.
- Analisi dei dati storici: Archivia i dati delle prestazioni del passato, permettendo di individuare trend e prendere decisioni informate.
- Soluzioni multi-cloud: Monitora l'infrastruttura su diversi fornitori cloud come AWS, Azure e Google Cloud all'interno di un'unica piattaforma.
- API e integrazioni: Si collega con altri strumenti e piattaforme per automatizzare flussi di lavoro e centralizzare i dati.
Vantaggi degli strumenti di monitoraggio dell'infrastruttura cloud
L'implementazione degli strumenti di monitoraggio dell'infrastruttura cloud offre numerosi vantaggi per il tuo team e la tua azienda. Ecco alcuni di cui potrai beneficiare:
- Maggiore disponibilità: Gli strumenti di monitoraggio consentono di individuare precocemente problemi di prestazioni, riducendo i tempi di inattività e mantenendo disponibili i servizi per gli utenti.
- Risoluzione più rapida dei problemi: Avvisi in tempo reale e log dettagliati semplificano l'individuazione e la correzione dei problemi da parte del tuo team.
- Migliore gestione dei costi: Le funzionalità di monitoraggio delle spese e di ottimizzazione delle risorse ti aiutano a evitare l'over-provisioning e a ridurre gli sprechi.
- Sicurezza potenziata: Il rilevamento delle minacce e i log di sicurezza integrati permettono di individuare le vulnerabilità e rispondere più rapidamente agli attacchi.
- Decisioni più informate: I dati storici e l'analisi delle tendenze forniscono informazioni sui pattern di prestazioni e sulle necessità di risorse.
- Gestione multi-cloud semplificata: Dashboard unificate e supporto multi-cloud consentono il monitoraggio di diversi ambienti cloud da un'unica interfaccia.
- Migliore collaborazione del team: L'accesso basato sui ruoli e i cruscotti condivisi assicurano che ogni membro del team disponga dei dati necessari per prendere decisioni.
Costi e prezzi degli strumenti di monitoraggio dell'infrastruttura cloud
La scelta degli strumenti di monitoraggio dell'infrastruttura cloud richiede la comprensione dei vari modelli e piani tariffari disponibili. I costi variano in base alle funzionalità, alla dimensione del team, ai componenti aggiuntivi e altro ancora. La tabella seguente riassume i piani più comuni, i prezzi medi e le tipiche funzionalità comprese negli strumenti di monitoraggio dell'infrastruttura cloud:
Tabella comparativa dei piani per strumenti di monitoraggio dell'infrastruttura cloud
| Tipo di piano | Prezzo medio | Funzionalità comuni |
|---|---|---|
| Piano gratuito | $0 | Strumenti base di monitoraggio delle prestazioni, avvisi limitati, supporto dalla community e integrazione con un solo cloud. |
| Piano personale | $10–$30/user/month | Tracciamento delle prestazioni, avvisi in tempo reale, analisi di base dei log e accesso per un singolo utente. |
| Piano business | $40–$100/user/month | Supporto multi-cloud, rilevamento avanzato delle anomalie, cruscotti personalizzati e permessi per team. |
| Piano enterprise | $150–$500/user/month | Insight basati su AI, automazione della risoluzione dei problemi, monitoraggio della sicurezza, account manager dedicato e verifica della conformità. |
Domande frequenti sugli strumenti di monitoraggio dell'infrastruttura cloud
Ecco alcune risposte alle domande più comuni sugli strumenti di monitoraggio dell’infrastruttura cloud:
Come gestiscono questi strumenti il monitoraggio in ambienti multi-cloud?
Molti strumenti di monitoraggio dell’infrastruttura cloud supportano ambienti multi-cloud, consentendo di monitorare le risorse su diversi provider come AWS, Azure e Google Cloud da un’unica piattaforma. Questo approccio unificato aiuta il tuo team a mantenere una supervisione coerente e semplifica la gestione.
Questi strumenti possono integrarsi con i flussi di lavoro DevOps esistenti?
Sì, la maggior parte degli strumenti di monitoraggio offre integrazioni con i principali u003ca href=u0022https://thectoclub.com/tools/best-devops-monitoring-tools/u0022u003estrumenti di monitoraggio DevOpsu003c/au003e come Jenkins, GitHub e Slack. Queste integrazioni permettono al tuo team di incorporare i dati di monitoraggio nei flussi di lavoro già in uso, migliorando la collaborazione e ottimizzando i processi.
Come aiutano questi strumenti a ottimizzare i costi cloud?
Molti strumenti di monitoraggio offrono funzionalità che tracciano l’utilizzo delle risorse e individuano le risorse sottoutilizzate. Analizzando questi dati, puoi prendere decisioni informate per ottimizzare la spesa cloud e allocare le risorse in modo più efficiente.
Quali funzionalità di sicurezza sono incluse tipicamente in questi strumenti?
Le funzionalità di sicurezza includono spesso il rilevamento delle minacce in tempo reale, valutazioni delle vulnerabilità e monitoraggio della conformità. Queste capacità aiutano il tuo team a identificare e risolvere rapidamente eventuali problemi di sicurezza, preservando l’integrità dell’infrastruttura.
Quanto sono personalizzabili le dashboard e i report in questi strumenti?
La maggior parte degli strumenti offre dashboard e report personalizzabili, permettendoti di adattare la visualizzazione delle metriche e delle analisi alle esigenze specifiche del tuo team. Questa flessibilità assicura che tu possa focalizzarti sui dati più rilevanti per le tue operazioni.
Questi strumenti supportano risposte automatiche ai problemi rilevati?
Sì, molti strumenti di monitoraggio supportano funzionalità di automazione che possono attivare azioni predefinite in risposta a determinati avvisi o anomalie. Questa automazione aiuta il tuo team a intervenire rapidamente, riducendo i tempi di inattività e migliorando l’affidabilità del sistema.
E ora?
Se stai cercando degli strumenti per il monitoraggio dell'infrastruttura cloud, collegati gratuitamente con un consulente SoftwareSelect per ricevere raccomandazioni.
Compili un modulo e fai una breve chiacchierata in cui ti vengono richiesti i dettagli delle tue necessità. Poi riceverai una shortlist di software da valutare. Ti supporteranno anche durante tutto il processo d'acquisto, comprese le trattative sul prezzo.