Le 10 migliori alternative a LogicMonitor recensite nel 2026

Migliori alternative a LogicMonitor: la shortlist


Trovare lo strumento di monitoraggio giusto può essere una vera seccatura. Vuoi qualcosa che si adatti alle esigenze del tuo team senza aggiungere complessità. Ecco perché molte organizzazioni cercano alternative a LogicMonitor.
Per esperienza, spesso le aziende cercano soluzioni che offrano una scalabilità migliore, funzionalità specifiche o un rapporto qualità/prezzo superiore. Potrebbero trovare che LogicMonitor non sia più in linea con i loro obiettivi o il loro budget attuali.
Ho testato e recensito in modo indipendente diverse opzioni per offrirti un punto di vista imparziale su ciò che è disponibile. Ti guiderò tra i migliori strumenti per affrontare le tue specifiche sfide.
Cerchi integrazione cloud avanzata o la flessibilità dell'open source? Questo elenco ti aiuterà a trovare l'alternativa giusta. Scopriamo le soluzioni migliori che possono rendere il monitoraggio molto più semplice da gestire.
Cos’è LogicMonitor?
LogicMonitor è un software di produttività pensato per professionisti IT e aziende che hanno bisogno di soluzioni di monitoraggio efficienti. Viene utilizzato dai team IT per monitorare infrastrutture, applicazioni e le prestazioni della rete, offrendo preziose informazioni sullo stato dei sistemi.
Monitoraggio automatico, dashboard personalizzabili e notifiche in tempo reale aiutano a individuare i problemi e ottimizzare le prestazioni. In generale, LogicMonitor offre una piattaforma centralizzata per mantenere i sistemi sempre operativi.
Riepilogo delle migliori alternative a LogicMonitor
Questa tabella comparativa riassume i dettagli sui prezzi delle mie principali alternative a LogicMonitor per aiutarti a trovare quella più adatta al tuo budget e alle necessità della tua azienda.
| Tool | Best For | Trial Info | Price | ||
|---|---|---|---|---|---|
| 1 | Best for endpoint management | 14-day free trial available | Pricing upon request | Website | |
| 2 | Best for cost-effective monitoring | Free download available | From $325/month (billed annually) | Website | |
| 3 | Best for AI-powered data analysis | 14-day free trial + free demo available | Pricing upon request | Website | |
| 4 | Best for automated real-time data access | Free demo available | From $21.20/MVS/month | Website | |
| 5 | Best for unified, flexible observability | Free plan available | From $19/month | Website | |
| 6 | Best for integrated IT solutions | 30-day free trial + free demo available | From $104/month | Website | |
| 7 | Best for customizable dashboard | Free demo + 30-day free trial available | From $179/month (billed annually) | Website | |
| 8 | Best for open-source observability | 30-day free trial + free demo available | From $49/month | Website | |
| 9 | Best for AI-native insights | Free plan + demo available | From $1,150/month | Website | |
| 10 | Best for AI-powered observability | Free trial available | From $7/host/month | Website |
Perché Fidarti delle Nostre Recensioni Software
Testiamo e recensiamo software dal 2023. Come leader tecnologici, sappiamo quanto sia cruciale e difficile prendere la decisione giusta nella scelta di un software.
Investiamo in una ricerca approfondita per aiutare il nostro pubblico a effettuare scelte migliori di acquisto software. Abbiamo testato oltre 2.000 strumenti per diversi casi d’uso tecnologici e scritto più di 1.000 recensioni complete. Scopri come restiamo trasparenti e la nostra metodologia di recensione del software.
-

TestDevLab
Visit Website -
Site24x7
Visit WebsiteThis is an aggregated rating for this tool including ratings from Crozdesk users and ratings from other sites.4.7 -
GitHub Actions
Visit WebsiteThis is an aggregated rating for this tool including ratings from Crozdesk users and ratings from other sites.4.8


Recensioni delle migliori alternative a LogicMonitor
Qui sotto trovi le mie recensioni dettagliate sulle migliori alternative a LogicMonitor che sono entrate nella mia shortlist. Le mie recensioni offrono un’analisi approfondita delle caratteristiche principali, dei pro e contro, delle integrazioni e dei casi d’uso ideali di ogni strumento per aiutarti a scegliere la soluzione più adatta a te.
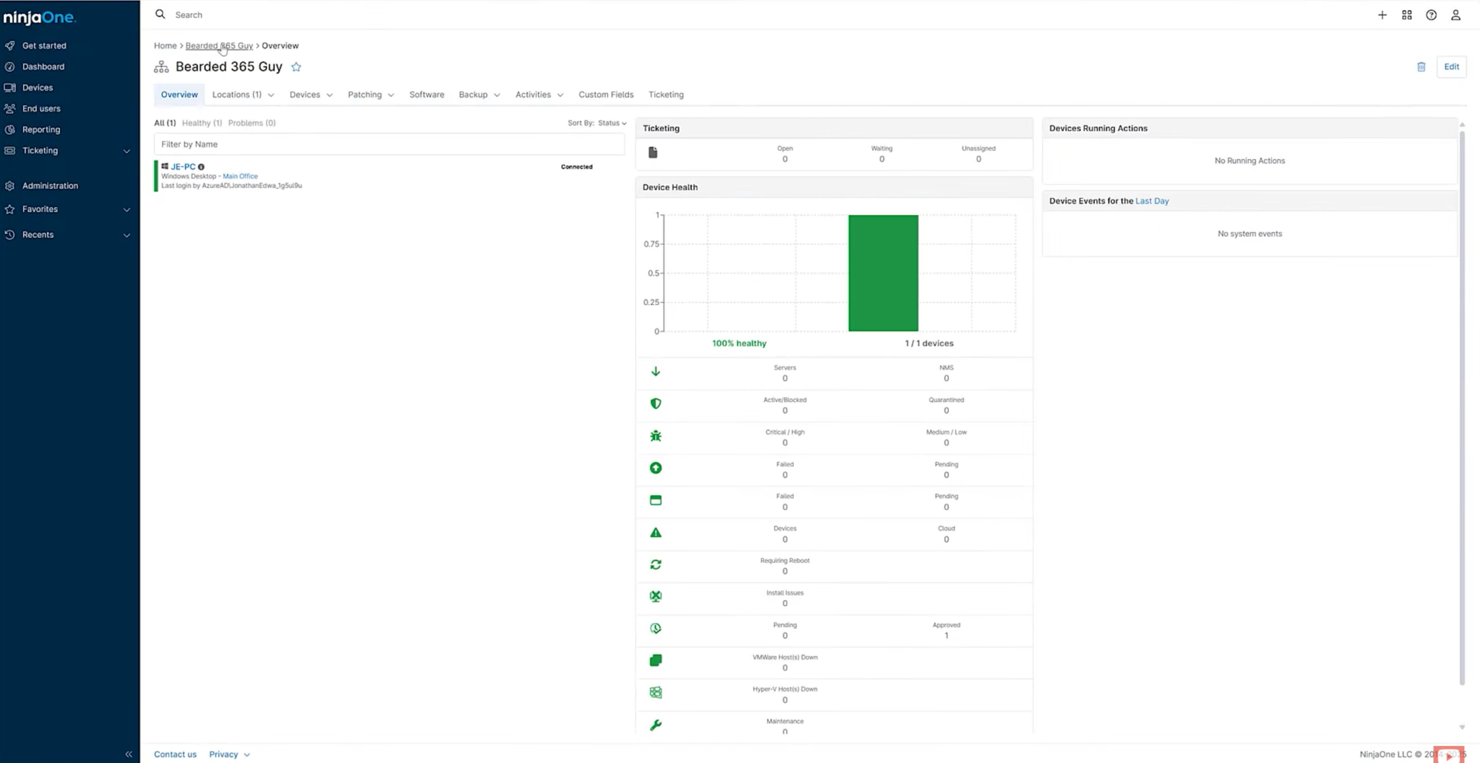
NinjaOne is an endpoint management solution designed for IT professionals and managed service providers who need to manage and secure endpoints efficiently. It offers tools to remotely monitor, manage, and support IT assets.
Why NinjaOne is a good LogicMonitor alternative: NinjaOne excels in endpoint management, with features such as remote access, patch management, and automated scripting to streamline IT operations. Its intuitive interface makes it easy for teams to manage devices, ensure security, and maintain control over IT assets.
Standout features and integrations:
Features include inventory management for keeping track of all your IT assets and software deployment that simplifies the rollout of new applications. You can also use its reporting tools to generate insights into your IT operations.
Integrations include ConnectWise, Autotask, Splashtop, Webroot, Bitdefender, StorageCraft, QuickBooks, and more.
Pros and Cons
Pros:
- Detailed reporting tools
- Automated patch management
- Strong security features
Cons:
- Requires ongoing maintenance
- Limited customization options
New Product Updates from NinjaOne
NinjaOne Adds Windows Agent Deployment to Network Discovery
NinjaOne adds Windows agent deployment directly from Network Discovery. This update helps IT teams move from discovering unmanaged Windows devices to monitoring, patching, and managing them faster. For more information, visit NinjaOne’s official site.
 .
.
Zabbix is an open-source monitoring software designed for IT and network administrators seeking on-premises performance, application, and server monitoring. It provides a vast suite of monitoring tools to ensure system reliability and performance.
Why Zabbix is a good LogicMonitor alternative: Zabbix offers cost-effective monitoring solutions, making it an attractive choice for budget-conscious teams. Its real-time monitoring and alerting features keep you up to date about system performance. The tool's customizable dashboards and scalability options provide flexibility for different business needs. It also monitors firewall metrics (CPU, interface traffic, uptime).
Standout features and integrations:
Features include distributed monitoring for keeping track of multiple networks from a single interface and a flexible notification system that promptly identifies any issues. Its data visualization tools help you create custom graphs and reports for improved insights.
Integrations include VMware, AWS, Azure, Docker, Kubernetes, MySQL, PostgreSQL, Oracle, Cisco, IBM, and more.
Pros and Cons
Pros:
- Open-source flexibility
- Customizable alerts
- Highly scalable
Cons:
- Dated interface
- Limited built-in reporting

Splunk is a data analysis and monitoring platform used by IT and security teams to gain insights from machine-generated data. It searches and analyzes logs from applications, servers, networks, and security systems to improve workflow and operational performance.
Why Splunk is a good LogicMonitor alternative: Splunk offers AI-powered data analysis, providing advanced insights into your data. Its real-time data processing and predictive analytics help you anticipate issues before they become critical. The platform's customizable dashboards and alerts facilitate efficient data management and decision-making.
Standout features and integrations:
Features include machine learning capabilities that let you automate data analysis processes and anomaly detection to identify unusual patterns in your data. Its advanced search functions can be used to delve deeper into data insights.
Integrations include AWS, Microsoft Azure, Google Cloud Platform, ServiceNow, Salesforce, VMware, Cisco, IBM, Slack, Jira, and more.
Pros and Cons
Pros:
- Strong machine learning capabilities
- Customizable dashboards
- Advanced, real-time data analytics
Cons:
- Complex deployment
- High cost for large data volumes

IBM Instana is an application performance monitoring tool designed for DevOps and IT teams who need to manage and optimize application performance. It monitors applications and infrastructure in real time to ensure optimal system operation.
Why IBM Instana is a good LogicMonitor alternative: IBM Instana provides real-time data access, allowing you to quickly identify and resolve performance issues. Its automatic discovery and monitoring capabilities help keep track of dynamic environments. The tool provides instant feedback on application health and performance, making it easier to maintain system reliability.
Standout features and integrations:
Features include automatic instrumentation to simplify the setup process by detecting and monitoring all services automatically. Its root cause analysis helps you understand and fix issues quickly, while its detailed service maps visualize application dependencies and performance.
Integrations include AWS, Azure, Kubernetes, Docker, Red Hat OpenShift, Google Cloud Platform, IBM Cloud, VMware, Apache Kafka, MongoDB, and more.
Pros and Cons
Pros:
- Detailed service mapping
- Automatic discovery
- Real-time monitoring
Cons:
- Vendor lock-in
- Customization complexity

Grafana Cloud is a monitoring service designed for developers and IT teams who need to visualize and analyze metrics, logs, and traces. Its extensive platform provides monitoring and observability across multiple systems.
Why Grafana Cloud is a good LogicMonitor alternative: Grafana Cloud offers an open observability platform that allows you to customize and extend monitoring capabilities. Its intuitive dashboards and flexible visualization tools help you gain insights into your data. The solution supports multiple data sources, so you can monitor diverse systems effectively.
Standout features and integrations:
Features include advanced alerting that lets you set up notifications for critical events and the creation of custom dashboards for tailored data visualization. You can also use its log aggregation option to collect and analyze logs from various sources.
Integrations include Prometheus, Loki, Tempo, AWS, Azure, Google Cloud Platform, Elasticsearch, MySQL, PostgreSQL, InfluxDB, and more.
Pros and Cons
Pros:
- Supports multiple data sources
- Scalable for growing needs
- Highly customizable dashboards
Cons:
- Limited built-in analytics
- Dependent on external data

ManageEngine is an IT management software designed for enterprises and IT teams that need a suite of network, server, and application management tools. It provides functionalities for monitoring, managing, and securing IT operations.
Why ManageEngine is a good LogicMonitor alternative: ManageEngine offers a wide range of integrated IT solutions, making it suitable for teams looking for all-in-one management software. Its out-of-the-box network monitoring, application management, and security management features offer IT oversight to improve IT operations and efficiency.
Standout features and integrations:
Features include IT asset tracking and management, IT help desk management to support user requests, and endpoint management for securing and managing devices across your network.
Integrations include Microsoft 365, ServiceNow, Slack, Jira, Microsoft Teams, Salesforce, Zendesk, Google Workspace, Zoho CRM, QuickBooks, and more.
Pros and Cons
Pros:
- Great value for money
- Flexible deployment options
- Wide range of IT tools
Cons:
- Steep learning curve
- Can be resource-intensive

Paessler PRTG is an all-in-one network and infrastructure monitoring tool for devices, applications, and traffic, designed for IT administrators and network managers.
Why Paessler PRTG is a good LogicMonitor alternative: Paessler PRTG provides customizable dashboards that allow you to tailor monitoring to your specific needs. Its sensor-based approach lets you choose precisely what to monitor, providing flexibility and detailed insights. The tool's user-friendly interface and customizable alerts enhance monitoring efficiency.
Standout features and integrations:
Features include automatic network discovery to quickly identify all devices on your network, remote probes that allow monitoring of multiple networks from a single interface, and custom real-time maps that visualize network layout and status.
Integrations include Microsoft Azure, Amazon Web Services, VMware, Cisco, SQL Server, NetApp, Dell EMC, HPE, Google Cloud, Microsoft 365, and more.
Pros and Cons
Pros:
- Intuitive user interface
- Flexible sensor-based licensing
- Highly customizable monitoring
Cons:
- Complex alert settings
- Limited scalability for large networks

SigNoz is an open-source observability platform designed for developers and IT teams who monitor and analyze application performance. It provides monitoring, tracing, and log management for modern applications.
Why SigNoz is a good LogicMonitor alternative: SigNoz is an open-source APM that allows you to customize and extend the platform to fit your needs. Its real-time monitoring and distributed tracing features provide insights into application performance. The platform's log management capabilities enable efficient troubleshooting and analysis.
Standout features and integrations:
Features include customizable dashboards to tailor views to your team's needs and anomaly detection that helps spot issues proactively. It also has an alerting system to notify you of critical issues as they arise.
Integrations include Kubernetes, Docker, Prometheus, Grafana, Elasticsearch, Apache Kafka, AWS, GCP, Azure, and more.
Pros and Cons
Pros:
- Active community support
- Scalable architecture
- Open-source customization
Cons:
- Limited documentation
- Limited enterprise-grade features

Last9 is a reliability platform designed for developers and site reliability engineers who need to ensure system uptime and performance. It offers monitoring, alerting, and incident management tools to maintain system reliability.
Why Last9 is a good LogicMonitor alternative: Last9 provides AI-native insights that help you predict and prevent system failures through its predictive analytics and anomaly detection features. The platform's real-time monitoring capabilities give your team the information it needs to maintain system health.
Standout features and integrations:
Features include predictive analytics, which help forecast potential system issues before they occur, and incident management that streamlines response to system alerts. Its customizable dashboards allow you to tailor monitoring views to your team's needs.
Integrations include AWS, Google Cloud Platform, Azure, Kubernetes, Docker, Prometheus, Grafana, Slack, Datadog, PagerDuty, and more.
Pros and Cons
Pros:
- Intuitive UI and dashboards
- Predictive analytics
- Unified observability
Cons:
- May need additional configuration
- Cloud-only delivery

Dynatrace is an observability platform designed to monitor and optimize application performance for IT and DevOps teams. It provides AI-powered insights to improve system reliability and efficiency.
Why Dynatrace is a good LogicMonitor alternative: Dynatrace's AI observability helps you detect anomalies and predict issues before they impact users. Its automatic root cause analysis and full-stack monitoring give you a holistic view of your IT environment. The platform's user-friendly dashboards and real-time analytics support quick decision-making.
Standout features and integrations:
Features include user experience monitoring that lets you track how real users interact with your applications and cloud infrastructure monitoring to ensure your cloud resources are optimized. Its automated problem detection enables you to identify issues as they arise.
Integrations include AWS, Azure, Google Cloud Platform, Kubernetes, VMware, OpenShift, SAP, ServiceNow, Slack, Microsoft Teams, and more.
Pros and Cons
Pros:
- Automatic root cause analysisReal-time analytics
- Full-stack monitoring
- AI-driven insights
Cons:
- Resource-intensive on systems
- Steep learning curve for new users
Altre alternative a LogicMonitor
Ecco alcune alternative aggiuntive a LogicMonitor che non sono entrate nella mia shortlist ma che meritano comunque una valutazione:
- Datadog
For cloud monitoring services
- AppDynamics
For application performance tracking
- New Relic
For full-stack observability
- Auvik
For cloud-based network monitoring
- ManageEngine OpManager
For network performance insights
- Nagios
For open-source monitoring
- Netdata
For real-time health monitoring
- Better Stack
For real-time incident response
- eG Innovations
For end-user experience tracking
- Amazon CloudWatch
For AWS resource monitoring
- ScienceLogic
For hybrid IT environments
- Obkio
For network performance optimization
- Azure Monitor
For Azure service insights


Criteri di selezione delle alternative a LogicMonitor
Nella selezione delle migliori alternative a LogicMonitor inserite in questo elenco, ho considerato i bisogni comuni degli acquirenti e le principali criticità legate ai software di produttività, come la scalabilità e le capacità di integrazione. Ho anche utilizzato il seguente schema per mantenere la mia valutazione strutturata ed equa:
Funzionalità principali (25% del punteggio totale)
Per essere inclusa in questo elenco, ogni soluzione doveva soddisfare questi utilizzi comuni:
- Monitoraggio delle prestazioni di rete
- Monitoraggio dello stato delle applicazioni
- Notifiche in tempo reale
- Supporto alla visualizzazione dei dati
- Reportistica automatica
Caratteristiche distintive aggiuntive (25% del punteggio totale)
Per restringere ulteriormente le alternative, ho valutato anche funzionalità uniche, tra cui:
- Approfondimenti basati sull’IA
- Dashboard personalizzabili
- Analisi predittiva
- Supporto multi-cloud
- Misure di sicurezza avanzate
Usabilità (10% del punteggio totale)
Per valutare l’usabilità di ciascun sistema, ho considerato i seguenti aspetti:
- Interfaccia intuitiva
- Navigazione semplice
- Opzioni di personalizzazione
- Accesso rapido alle funzionalità
- Meccanismi di feedback degli utenti
Onboarding (10% del punteggio totale)
Per valutare l’esperienza di onboarding su ciascuna piattaforma, ho considerato i seguenti aspetti:
- Disponibilità di video formativi
- Tour prodotto interattivi
- Accesso a template
- Webinar per nuovi utenti
- Supporto tramite chatbot per la configurazione
Assistenza clienti (10% del punteggio totale)
Per valutare i servizi di assistenza clienti di ciascun fornitore di software, ho considerato i seguenti aspetti:
- Disponibilità di supporto 24/7
- Opzioni di supporto multicanale
- Accesso a una knowledge base
- Tempi di risposta
- Disponibilità di account manager dedicati
Rapporto qualità-prezzo (10% del punteggio totale)
Per valutare il rapporto qualità-prezzo di ciascuna piattaforma, ho considerato i seguenti aspetti:
- Prezzi competitivi
- Piani di pagamento flessibili
- Sconti sulla fatturazione annuale
- Insieme di funzionalità completo
- Potenziale ROI
Recensioni dei clienti (10% del punteggio totale)
Per avere un quadro generale della soddisfazione dei clienti, ho considerato i seguenti aspetti nella lettura delle recensioni:
- Livello generale di soddisfazione
- Menzioni sui pro e contro specifici
- Frequenza di aggiornamenti e miglioramenti
- Segnalazioni di interruzioni del servizio
- Feedback sulle interazioni con il servizio clienti
Perché Cercare un’Alternativa a LogicMonitor?
Sebbene LogicMonitor sia una buona scelta come software di produttività, ci sono diversi motivi per cui alcuni utenti cercano soluzioni alternative. Potresti voler considerare un’opzione diversa perché:
- Hai bisogno di maggiori opzioni di personalizzazione
- Il tuo team necessita di una migliore scalabilità
- Vuoi risparmiare sui costi
- La tua azienda richiede integrazioni specifiche
- Stai cercando interfacce utente più semplici
- Hai bisogno di un migliore supporto regionale
Se ti ritrovi in una di queste situazioni, sei nel posto giusto. Il mio elenco include diverse soluzioni software di produttività più adatte ai team che trovano difficoltà con LogicMonitor e sono alla ricerca di alternative migliori.
Funzionalità
Ecco alcune delle principali funzionalità di LogicMonitor che ti aiuteranno a confrontare cosa offrono le soluzioni alternative:
- Monitoraggio unificato: Fornisce un monitoraggio esteso di infrastruttura, cloud e gestione dei log, supportando i principali provider cloud.
- Integrazione AIOps: Utilizza strumenti basati sull’IA per l’intelligenza degli eventi e l’automazione per migliorare l’efficienza operativa.
- Analisi predittiva: Fornisce analisi delle cause principali e approfondimenti sui servizi per migliorare la risoluzione degli incidenti.
- Integrazioni estese: Offre oltre 3.000 integrazioni tecnologiche per scalabilità dinamica e resilienza.
- Cruscotti personalizzabili: Permettono di creare e condividere dashboard in tempo reale adattate alle tue esigenze specifiche.
- Rilevamento anomalie: Identifica comportamenti insoliti in modo proattivo per prevenire un impatto sugli utenti.
- Soglie dinamiche: Imposta automaticamente soglie intelligenti basate sui dati storici.
- API e integrazioni: Estendi la funzionalità con API e integrazioni per molteplici tecnologie.
- Supporto cloud e multi-cloud: Monitora container e principali provider cloud come AWS, Google Cloud, Microsoft Azure e Oracle Cloud.
- Gestione dei log: Fornisce gestione e analisi dei log.
E ora?
Se sei alla ricerca di un software per la produttività, contatta gratuitamente un consulente SoftwareSelect per ricevere raccomandazioni su misura.
Compila un modulo e fai una breve chiacchierata in cui approfondiamo le tue esigenze specifiche. Poi riceverai una lista ristretta di software da valutare. Ti supporteremo anche durante l’intero processo d’acquisto, incluse le negoziazioni sui prezzi.