Le 12 migliori alternative a Datadog recensite nel 2026

Migliori alternative a Datadog - Shortlist


Se utilizzi Datadog per il monitoraggio del cloud, potresti aver incontrato delle difficoltà, come costi elevati o funzionalità complesse che non si adattano alle esigenze del tuo team. Non sei il solo. Molti esperti tecnologici cercano alternative a Datadog per soddisfare meglio i propri requisiti specifici.
Per esperienza, trovare lo strumento giusto può aumentare notevolmente l'efficienza del team. Per questo motivo, ho testato e recensito in autonomia diverse alternative a Datadog. Il mio obiettivo è fornirti una guida imparziale e ben documentata che ti aiuti a prendere una decisione informata.
In questo articolo condividerò le mie migliori scelte di alternative a Datadog, concentrandomi sulle caratteristiche e i vantaggi unici che potrebbero essere più adatti al tuo team. Vediamo quali opzioni potrebbero rispondere meglio alle esigenze della tua azienda.
Cos'è Datadog?
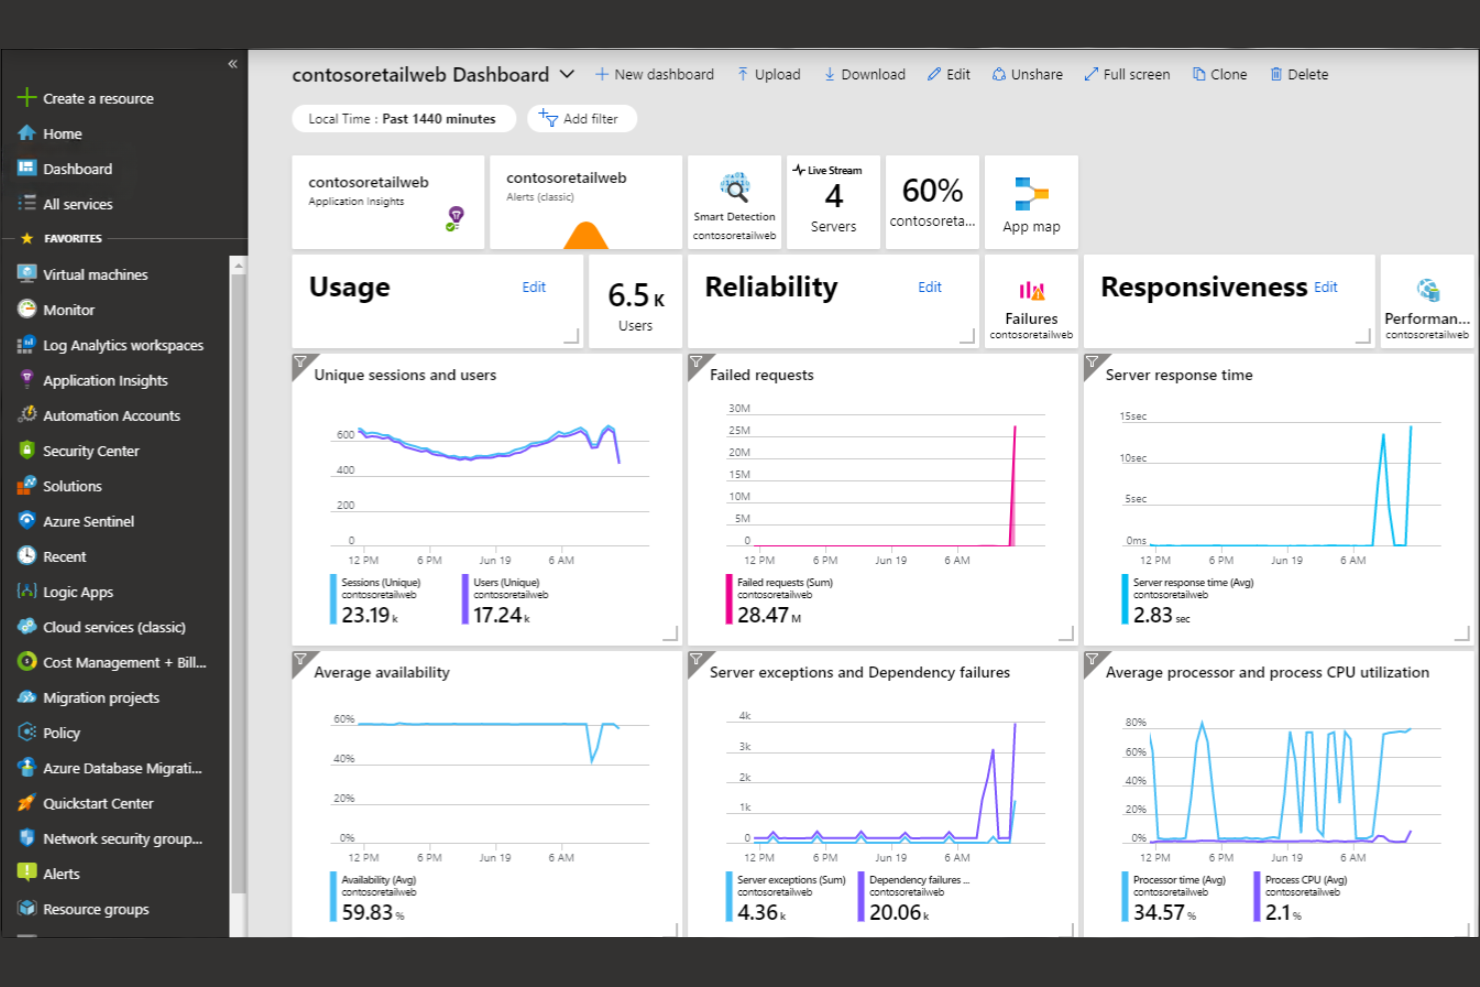
Datadog è una piattaforma di monitoraggio cloud che consente di tenere traccia in tempo reale delle applicazioni, dell'infrastruttura e dei log. Professionisti IT, sviluppatori e team operations usano normalmente Datadog per monitorare le prestazioni e risolvere rapidamente i problemi. Funzionalità come monitoraggio in tempo reale, gestione dei log e dashboard personalizzabili aiutano a individuare i colli di bottiglia delle performance e a mantenere la salute dei sistemi. Nel complesso, Datadog offre un modo semplice per garantire il corretto funzionamento dei tuoi sistemi.
Migliori alternative a Datadog - Riepilogo
Questa tabella comparativa riassume i dettagli sui prezzi delle mie migliori selezioni di alternative a Datadog, per aiutarti a trovare quella più adatta al tuo budget e alle esigenze della tua azienda.
| Tool | Best For | Trial Info | Price | ||
|---|---|---|---|---|---|
| 1 | Ideale per la conservazione flessibile dei dati | Prova gratuita di 14 giorni + demo gratuita disponibile | Da $0,05/GB | Website | |
| 2 | Ideale per la visualizzazione indipendente dalla fonte dei dati | Piano gratuito + prova gratuita disponibile | Da $19/mese + utilizzo | Website | |
| 3 | Miglior ecosistema unificato di telemetria full-stack | È disponibile un piano gratuito | Da $49/utente/mese | Website | |
| 4 | Ideale per l’analisi della sicurezza a livello enterprise | Prova gratuita di 14 giorni + demo gratuita disponibile | Prezzo su richiesta | Website | |
| 5 | Miglior motore pull-based per metriche in Kubernetes | Gratuito | Nessun costo di licenza | Website | |
| 6 | Ideale per la scoperta delle app in tempo reale | Demo gratuita disponibile | A partire da $21,20/MVS/mese | Website | |
| 7 | Ideale per ambienti AWS | Piano gratuito disponibile | Prezzo su richiesta | Website | |
| 8 | Ideale per la ricerca di log su larga scala | Prova gratuita + demo gratuita disponibile | A partire da $0,07/GB di dati ingeriti | Website | |
| 9 | Ideale per l'integrazione con Azure | Demo gratuita disponibile | Prezzo su richiesta | Website | |
| 10 | Ideale per la risoluzione dei problemi assistita dall'IA | Prova gratuita di 14 giorni + demo gratuita disponibile | Da $0,20/milione di punti dati metrici | Website |
Perché Fidarti delle Nostre Recensioni Software
Testiamo e recensiamo software dal 2023. Come leader tecnologici, sappiamo quanto sia cruciale e difficile prendere la decisione giusta nella scelta di un software.
Investiamo in una ricerca approfondita per aiutare il nostro pubblico a effettuare scelte migliori di acquisto software. Abbiamo testato oltre 2.000 strumenti per diversi casi d’uso tecnologici e scritto più di 1.000 recensioni complete. Scopri come restiamo trasparenti e la nostra metodologia di recensione del software.
-

TestDevLab
Visit Website -
Site24x7
Visit WebsiteThis is an aggregated rating for this tool including ratings from Crozdesk users and ratings from other sites.4.7 -
GitHub Actions
Visit WebsiteThis is an aggregated rating for this tool including ratings from Crozdesk users and ratings from other sites.4.8


Recensioni delle migliori alternative a Datadog
Qui sotto trovi i miei approfondimenti dettagliati sulle migliori alternative a Datadog che sono entrate nella mia shortlist. Le mie recensioni offrono una panoramica sui punti di forza, vantaggi e svantaggi, integrazioni e casi d’uso ideali di ciascun tool per aiutarti a trovare quella più adatta a te.
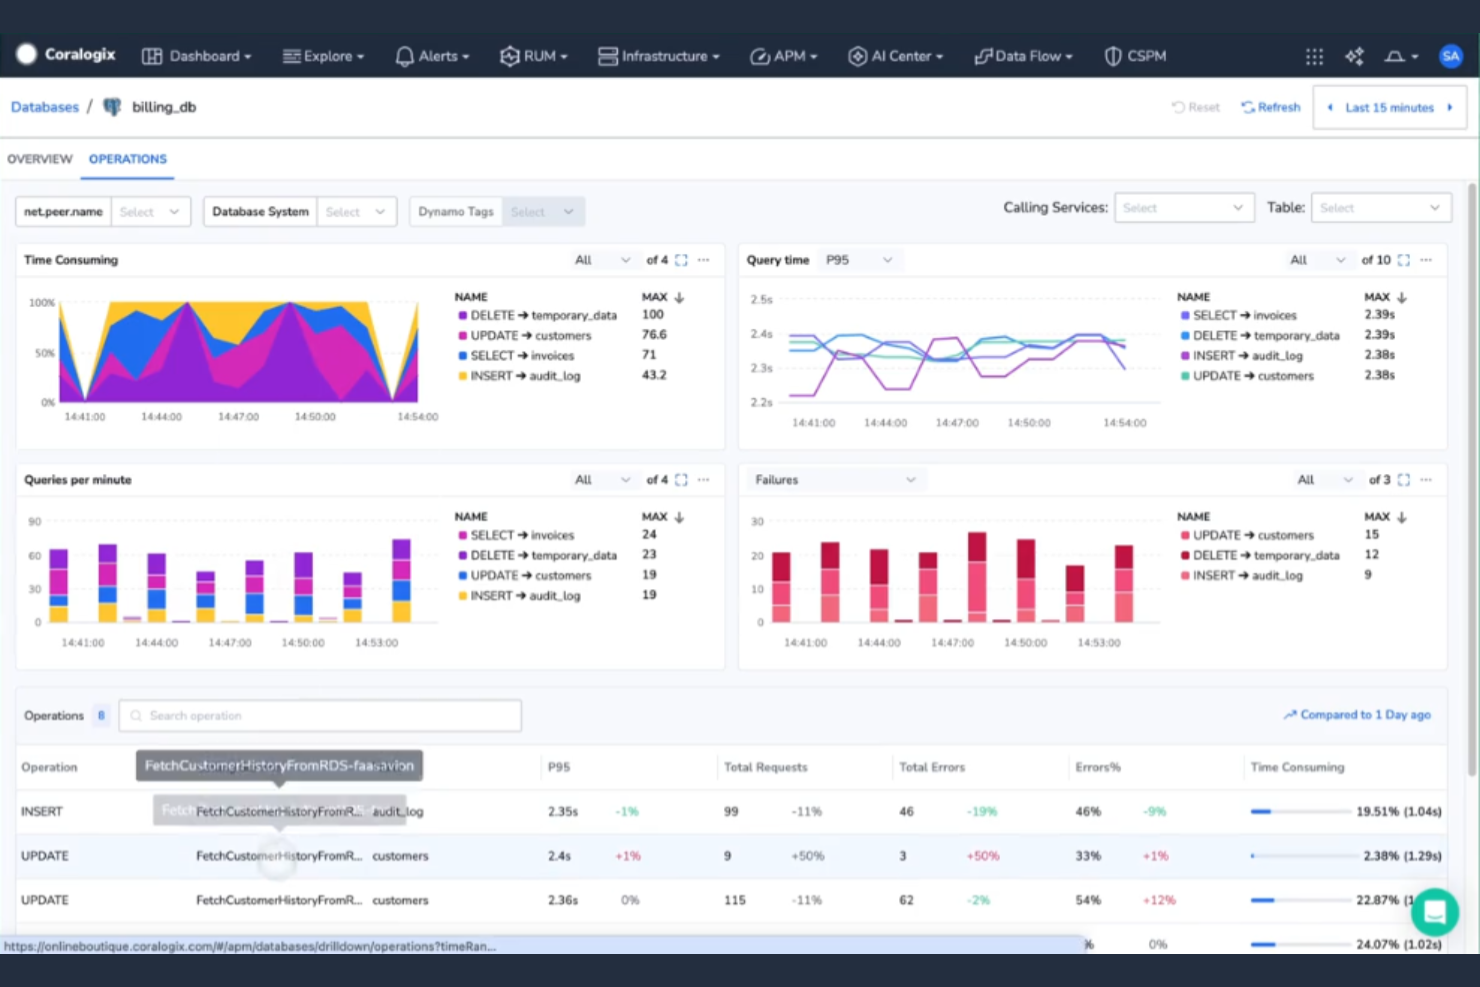
Coralogix è una piattaforma di analisi e monitoraggio dei log progettata per team DevOps e professionisti IT. Ti aiuta a gestire e analizzare i dati dei log per ottenere informazioni approfondite e migliorare le prestazioni del sistema.
Perché è una valida alternativa a Datadog: Coralogix offre opzioni flessibili di conservazione dei dati, permettendoti di controllare per quanto tempo conservare i tuoi dati. Le sue analisi in tempo reale forniscono informazioni immediate sui log. Grazie alle capacità di machine learning, Coralogix ti aiuta a identificare rapidamente schemi e anomalie. Questo è particolarmente utile per i team che desiderano ottimizzare la memorizzazione e il recupero dei dati.
Caratteristiche salienti e integrazioni:
Le funzionalità includono live tailing, che ti consente di visualizzare i dati dei log in tempo reale per intercettare problemi mentre accadono. Gli algoritmi di machine learning della piattaforma migliorano il rilevamento delle anomalie. Puoi anche utilizzare dashboard personalizzabili per concentrarti sulle metriche più importanti per il tuo team.
Le integrazioni includono AWS, Microsoft Azure, Google Cloud Platform, Kubernetes, Docker, GitHub, Slack, Jira, PagerDuty e altro ancora.
Pros and Cons
Pros:
- Conservazione dei dati flessibile
- Analisi dei log in tempo reale
- Informazioni tramite machine learning, incluso il rilevamento immediato delle anomalie
Cons:
- Interfaccia complessa e linguaggio di query proprietario
- Le configurazioni a livelli possono diventare costose
Grafana
Ideale per la visualizzazione indipendente dalla fonte dei dati
Grafana è una piattaforma di visualizzazione e monitoraggio dei dati utilizzata dai team IT e DevOps per creare dashboard interattive e condivisibili. Ti aiuta a monitorare e analizzare metriche provenienti da diverse fonti di dati.
Perché è una valida alternativa a Datadog: Grafana si distingue nella visualizzazione delle metriche grazie alla sua vasta gamma di dashboard personalizzabili. Puoi adattare queste dashboard per mostrare i dati più rilevanti per il tuo team. Il sistema di allerta flessibile della piattaforma ti tiene informato su cambiamenti critici. Essendo open source, puoi adattarla perfettamente alle tue esigenze specifiche.
Caratteristiche distintive e integrazioni:
Le funzionalità includono la creazione di template, che ti permette di creare dashboard riutilizzabili e dinamiche. La funzione di annotazione ti aiuta a segnare eventi importanti sui grafici per fornire contesto. Puoi inoltre sfruttare le sue capacità di allerta per ricevere notifiche basate su soglie specifiche.
Le integrazioni includono Grafana Labs stack, Prometheus, InfluxDB, Elasticsearch, AWS CloudWatch, Microsoft Azure Monitor, Google Cloud, MySQL, PostgreSQL, Graphite, OpenTSDB e molto altro.
Pros and Cons
Pros:
- Visualizzazione avanzata da fonti multiple
- Aggregazione dati efficiente
- Ottime capacità di visualizzazione
Cons:
- Elevata complessità operativa
- Analisi integrate limitate
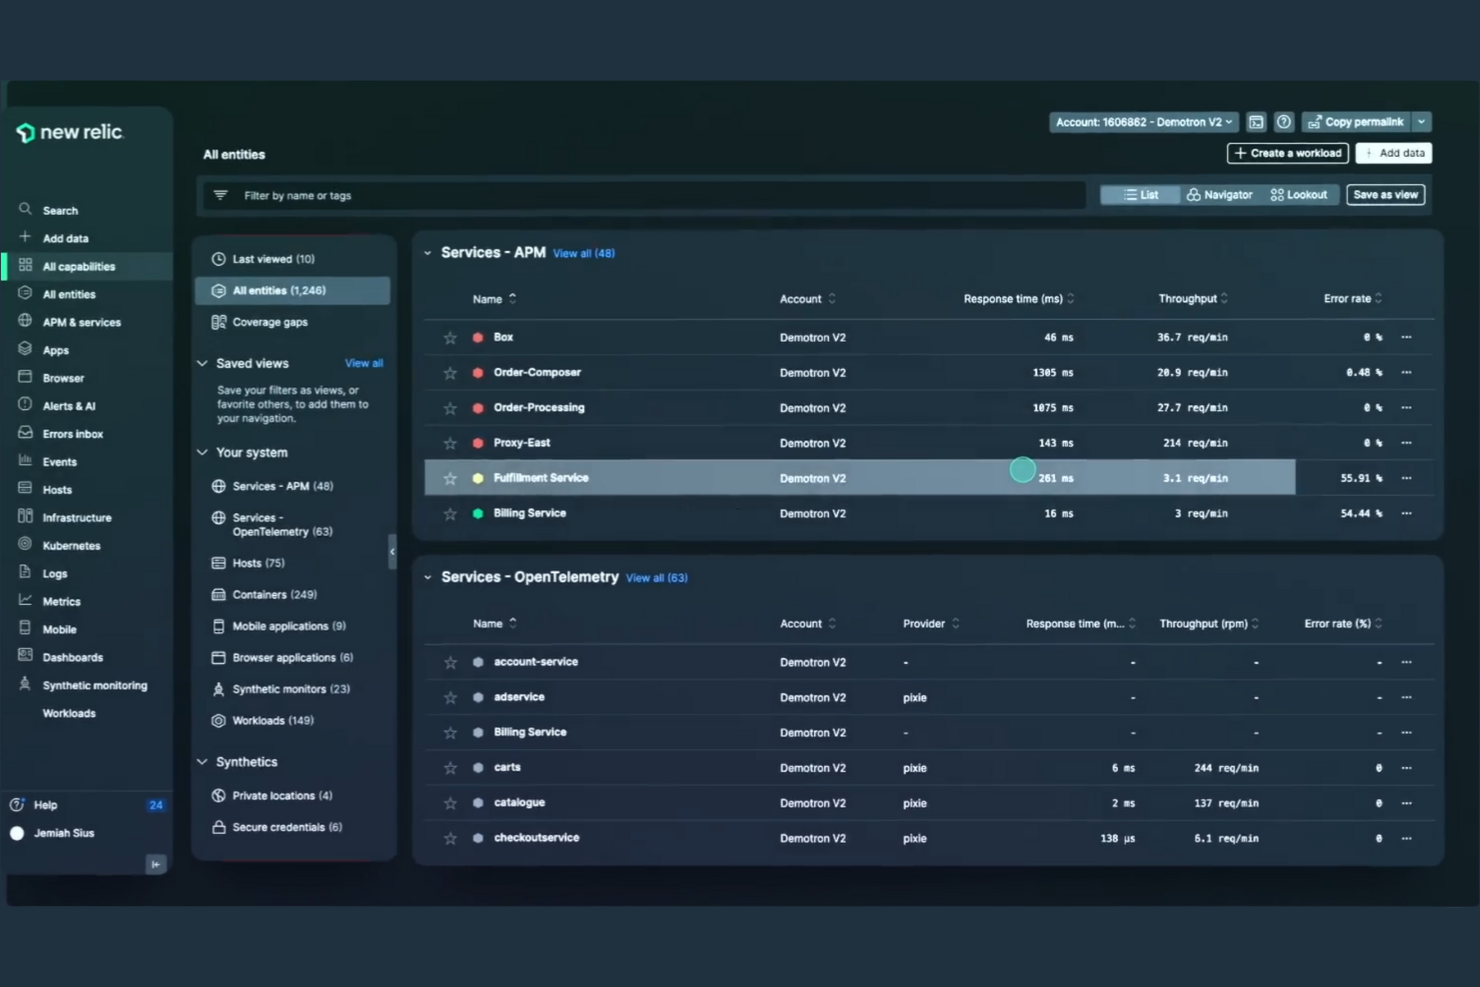
New Relic è uno strumento di monitoraggio delle prestazioni delle applicazioni (APM) utilizzato da sviluppatori e team IT per garantire prestazioni applicative ottimali. Fornisce informazioni dettagliate sul comportamento delle applicazioni e sulla salute dell'infrastruttura.
Perché è una buona alternativa a Datadog: Grazie alle estese integrazioni, New Relic consente di collegarsi a una vasta gamma di servizi e piattaforme. Le sue funzionalità di APM in tempo reale e di alerting ti aiutano a tenere sotto controllo i problemi di prestazioni. Le dashboard personalizzabili offrono la flessibilità di adattare le metriche alle esigenze del tuo team. Questo rende più semplice la gestione di ambienti complessi e di tecnologie diverse.
Funzionalità e integrazioni principali:
Le funzionalità includono il monitoraggio sintetico, che simula le interazioni degli utenti per rilevare i problemi precocemente. Il tracciamento distribuito ti aiuta a comprendere il flusso delle richieste nelle tue applicazioni. Puoi anche utilizzare analisi avanzate per ottenere una conoscenza più approfondita dei tuoi dati.
Le integrazioni includono AWS, Microsoft Azure, Google Cloud, Kubernetes, Docker, Slack, PagerDuty, Jenkins, GitHub, Jira e molte altre.
Pros and Cons
Pros:
- Ampie opzioni di integrazione
- Potente APM e tracciamento
- Vista consolidata e incentrata sulle entità
Cons:
- Modello di prezzo complesso
- Alcune funzionalità richiedono una configurazione avanzata
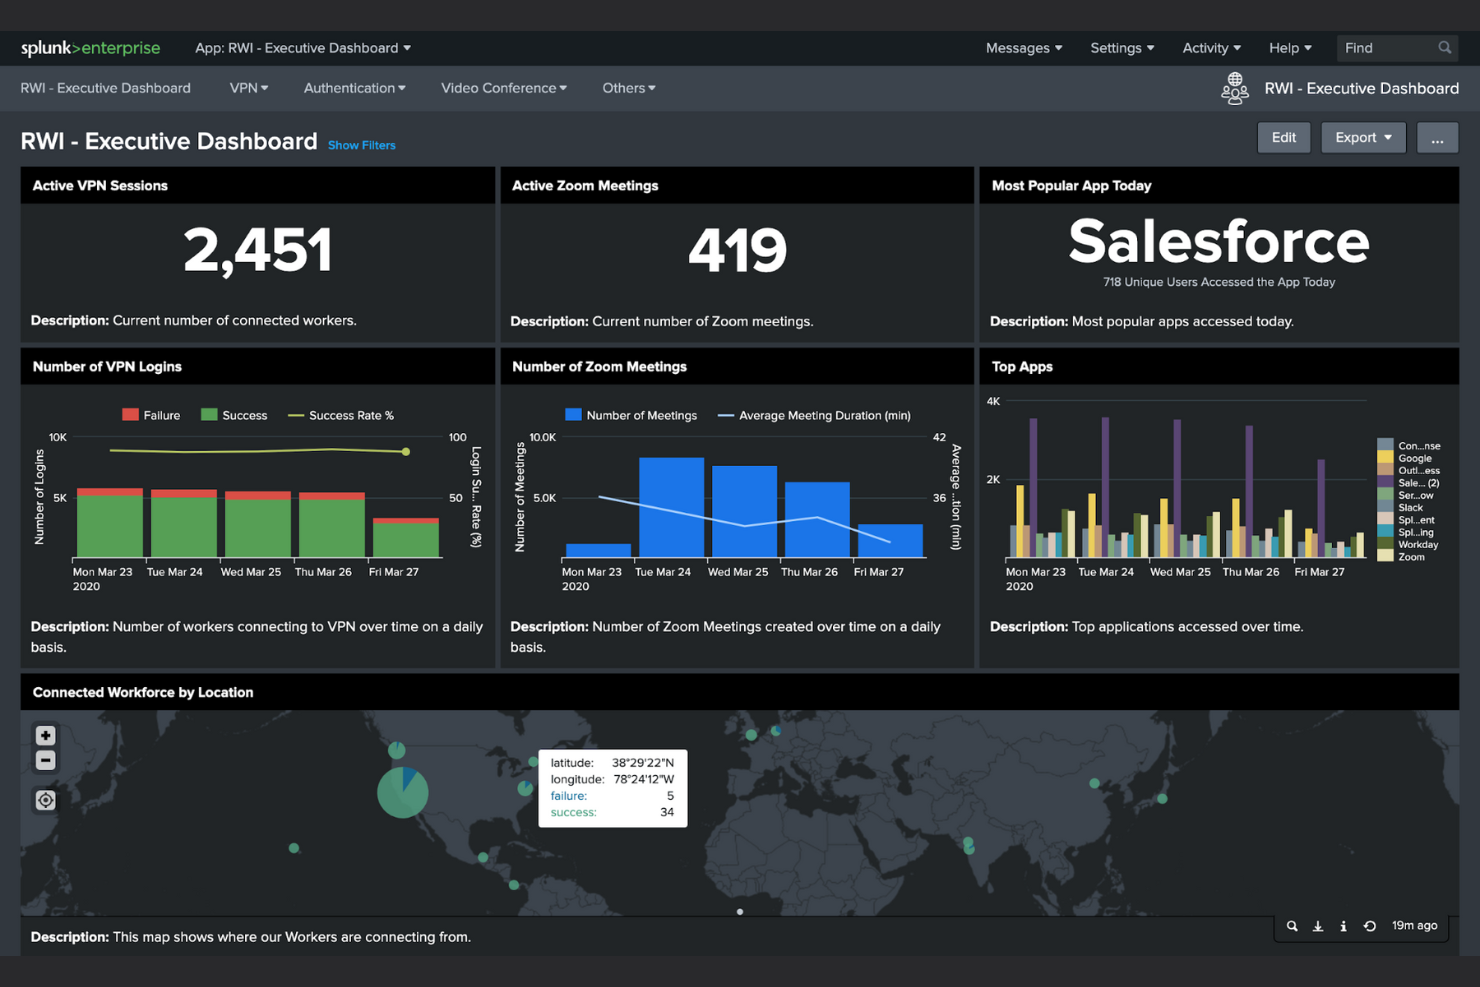
Splunk è una piattaforma di analisi dei dati utilizzata da professionisti IT e della sicurezza per monitorare e analizzare i dati generati dalle macchine. Ti aiuta a ottenere informazioni approfondite da log, metriche ed eventi per migliorare le prestazioni operative e la sicurezza.
Perché è una buona alternativa a Datadog: Splunk eccelle nell’analisi della sicurezza, incluso SIEM, offrendo capacità avanzate di rilevamento e risposta alle minacce. I suoi potenti strumenti di ricerca e visualizzazione ti permettono di identificare e mitigare rapidamente i rischi per la sicurezza. La capacità della piattaforma di gestire grandi volumi di dati la rende ideale per ambienti complessi. Puoi anche personalizzare le dashboard per concentrarti sui parametri di sicurezza più importanti per il tuo team.
Funzionalità e integrazioni principali:
Le funzionalità includono avanzate capacità di ricerca che ti consentono di esplorare i tuoi dati in dettaglio. Gli strumenti di machine learning della piattaforma migliorano le analisi predittive per un processo decisionale più efficace. Puoi inoltre beneficiare del monitoraggio in tempo reale per mantenere sicuri i tuoi sistemi.
Le integrazioni includono AWS, Microsoft Azure, Google Cloud Platform, AppDynamics, ServiceNow, Docker, Kubernetes, Salesforce, Cisco, Okta, Palo Alto Networks e altri ancora.
Pros and Cons
Pros:
- Analisi avanzata dei log
- Strumenti potenti per la sicurezza e SIEM
- Marketplace di integrazioni molto ampio
Cons:
- Manutenzione onerosa degli indexer
- Elevato costo totale di proprietà
Prometheus è una suite open-source per il monitoraggio e l'avviso, utilizzata principalmente da sviluppatori e team IT. Si concentra sulla raccolta di dati temporali per offrire approfondimenti sulle prestazioni e l'affidabilità dei sistemi.
Perché è una valida alternativa a Datadog: Prometheus offre una soluzione open-source che consente un alto grado di personalizzazione e flessibilità. Il suo potente linguaggio di query, PromQL, permette di esplorare e analizzare i dati in modo efficiente. L'attenzione ai dati temporali aiuta a monitorare e inviare avvisi su metriche chiave. Inoltre, la capacità di integrarsi con diversi sistemi lo rende adattabile a vari ambienti.
Funzionalità e integrazioni principali:
Le funzionalità includono un modello dati flessibile che supporta la raccolta multidimensionale. Il gestore di avvisi consente di definire e gestire efficacemente gli avvisi. Sono disponibili strumenti di visualizzazione integrati per creare dashboard approfondite.
Le integrazioni includono Kubernetes, Docker, Consul, etcd, Amazon EC2, Google Cloud Platform, Microsoft Azure, DigitalOcean e Grafana.
Pros and Cons
Pros:
- Flessibilità open-source
- Linguaggio di query personalizzabile
- Gestione efficiente dei dati temporali
Cons:
- Visualizzazione integrata limitata
- Nessun storage nativo a lungo termine
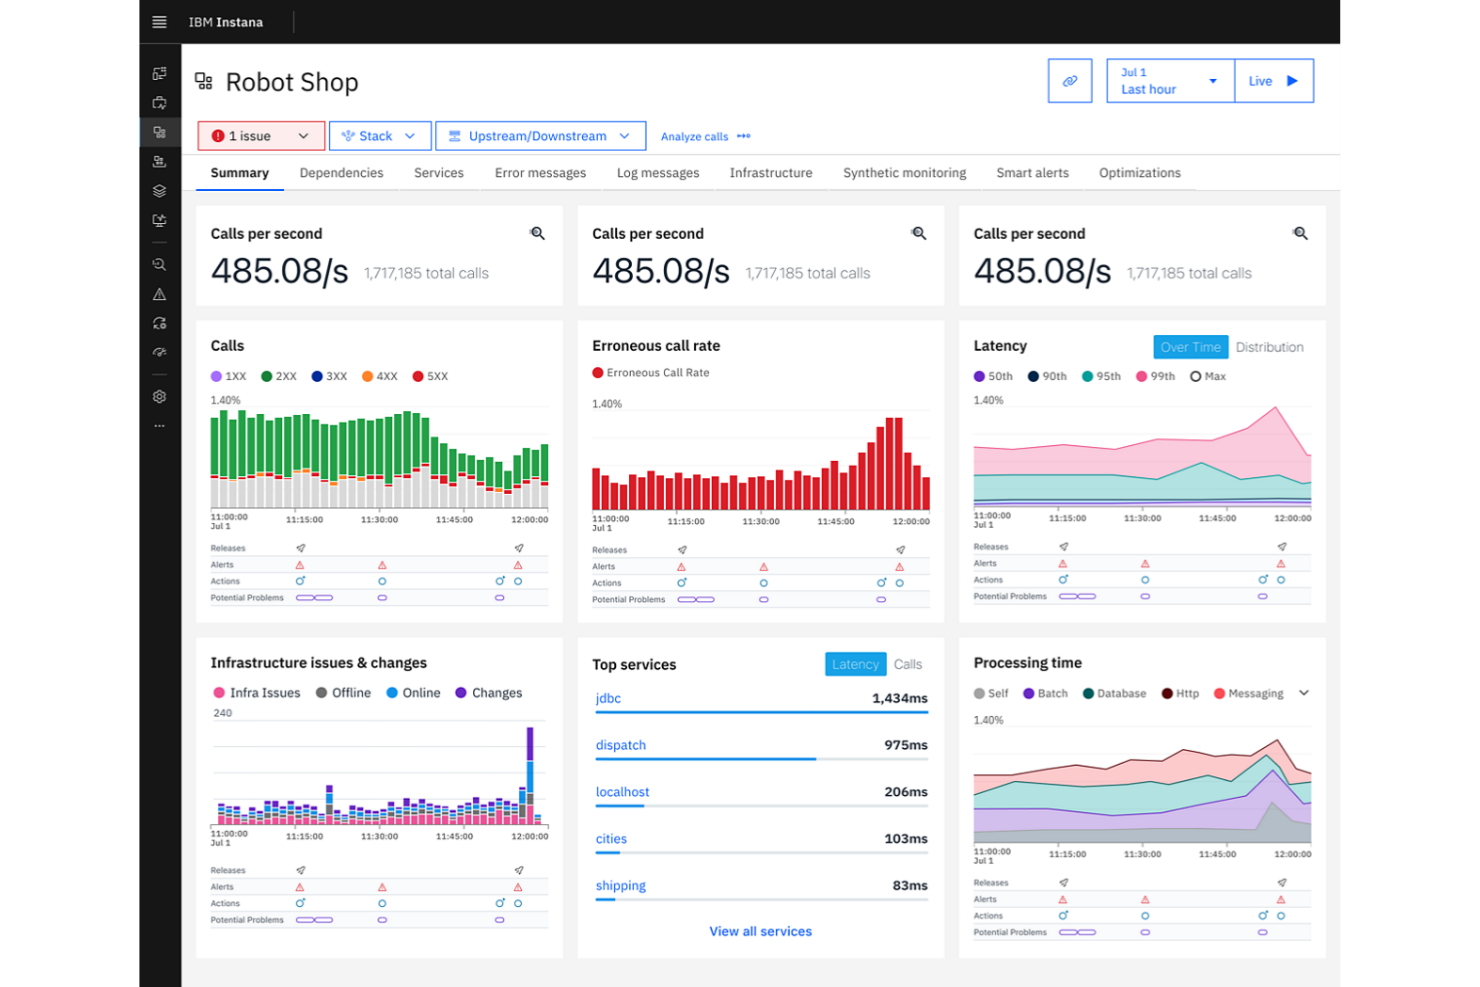
IBM Instana è uno strumento APM progettato per i team DevOps e le operazioni IT. Fornisce informazioni in tempo reale sulle prestazioni delle applicazioni e sulla salute dell'infrastruttura.
Perché è una buona alternativa a Datadog: Con approfondimenti in tempo reale basati su intelligenza artificiale e capacità di correlazione, IBM Instana rileva automaticamente i problemi e fornisce dati utili per risolverli. La sua scoperta e mappatura automatica dei servizi offre una panoramica completa del tuo ambiente. L'analisi delle cause alla radice guidata dall'IA aiuta a identificare e risolvere rapidamente i problemi. Aggiornamenti continui garantiscono che il tuo team abbia sempre le informazioni più recenti a portata di mano.
Funzionalità principali e integrazioni:
Le funzionalità includono l'integrazione continua con i flussi di lavoro DevOps per migliorare l'efficienza del team. La piattaforma offre il tracciamento delle transazioni end-to-end per monitorare l'esperienza utente. Puoi anche accedere a un monitoraggio dettagliato dell'infrastruttura per approfondire le prestazioni del sistema.
Le integrazioni includono Kubernetes, Docker, AWS, Microsoft Azure, Google Cloud Platform, IBM Cloud, Red Hat OpenShift, VMware, Jenkins, Grafana e altri.
Pros and Cons
Pros:
- Tracciamento e monitoraggio in tempo reale
- Mappatura automatica delle dipendenze
- Supporto avanzato per Kubernetes
Cons:
- Prezzi per MVS poco trasparenti
- Configurazione iniziale complessa
Amazon CloudWatch è un servizio di monitoraggio e gestione progettato per sviluppatori, operatori di sistema e responsabili IT che utilizzano risorse AWS. Aiuta a raccogliere e tracciare metriche, monitorare file di log e impostare allarmi.
Perché è una buona alternativa a Datadog: Grazie alla sua profonda integrazione con AWS, Amazon CloudWatch offre un monitoraggio coerente di tutte le risorse AWS. Fornisce dati dettagliati sulle prestazioni e informazioni sullo stato operativo. La possibilità di impostare allarmi basati su soglie metriche favorisce una gestione proattiva. Inoltre, la funzione di scalabilità automatica mantiene i livelli di performance dell'applicazione.
Funzionalità principali e integrazioni:
Le funzionalità includono il monitoraggio dettagliato, che permette di raccogliere e analizzare metriche a intervalli di un minuto. Il servizio offre anche archiviazione e gestione dei dati di log, facilitando la risoluzione rapida dei problemi. È possibile configurare dashboard personalizzate per visualizzare le metriche più rilevanti per il proprio team.
Le integrazioni includono AWS Lambda, Amazon EC2, Amazon S3, Amazon RDS, Amazon ECS, AWS Elastic Beanstalk, Amazon API Gateway, AWS CloudTrail, AWS Step Functions, AWS IoT e altro ancora.
Pros and Cons
Pros:
- Integrato con la sicurezza AWS
- Dati dettagliati sulle prestazioni
- Allarmi personalizzabili
Cons:
- Visibilità limitata tra cloud
- Richiede competenze AWS
Elastic è una piattaforma di analisi basata sulla ricerca che serve sviluppatori e team IT che hanno bisogno di cercare, analizzare e visualizzare dati in tempo reale. Supporta diverse funzioni, tra cui logging, sicurezza e osservabilità.
Perché è una buona alternativa a Datadog: Elastic eccelle nelle capacità di ricerca, rendendo più facile trovare e analizzare punti dati specifici. I suoi strumenti di osservabilità forniscono approfondimenti dettagliati sulle prestazioni delle applicazioni e sulla salute dell'infrastruttura. La scalabilità della piattaforma consente di gestire in modo efficiente grandi volumi di dati. Con dashboard personalizzabili, il tuo team può concentrarsi sulle metriche più rilevanti.
Caratteristiche e integrazioni principali:
Le funzionalità includono potenti capacità di ricerca che ti permettono di interrogare rapidamente grandi dataset. Le caratteristiche di machine learning della piattaforma ti aiutano a rilevare anomalie nei tuoi dati. Puoi anche utilizzare i suoi strumenti di visualizzazione per creare dashboard efficaci che evidenziano le metriche principali.
Le integrazioni includono Kubernetes, Docker, AWS, Microsoft Azure, Google Cloud Platform, Apache Kafka, Apache Hadoop, Logstash, Beats, MySQL e altro ancora.
Pros and Cons
Pros:
- Eccellenti capacità di ricerca full-text
- Analisi scalabile di log e metriche
- Metodi di acquisizione dati altamente flessibili
Cons:
- Potenziale rischio di lock-in operativo
- Può essere ad alto consumo di risorse
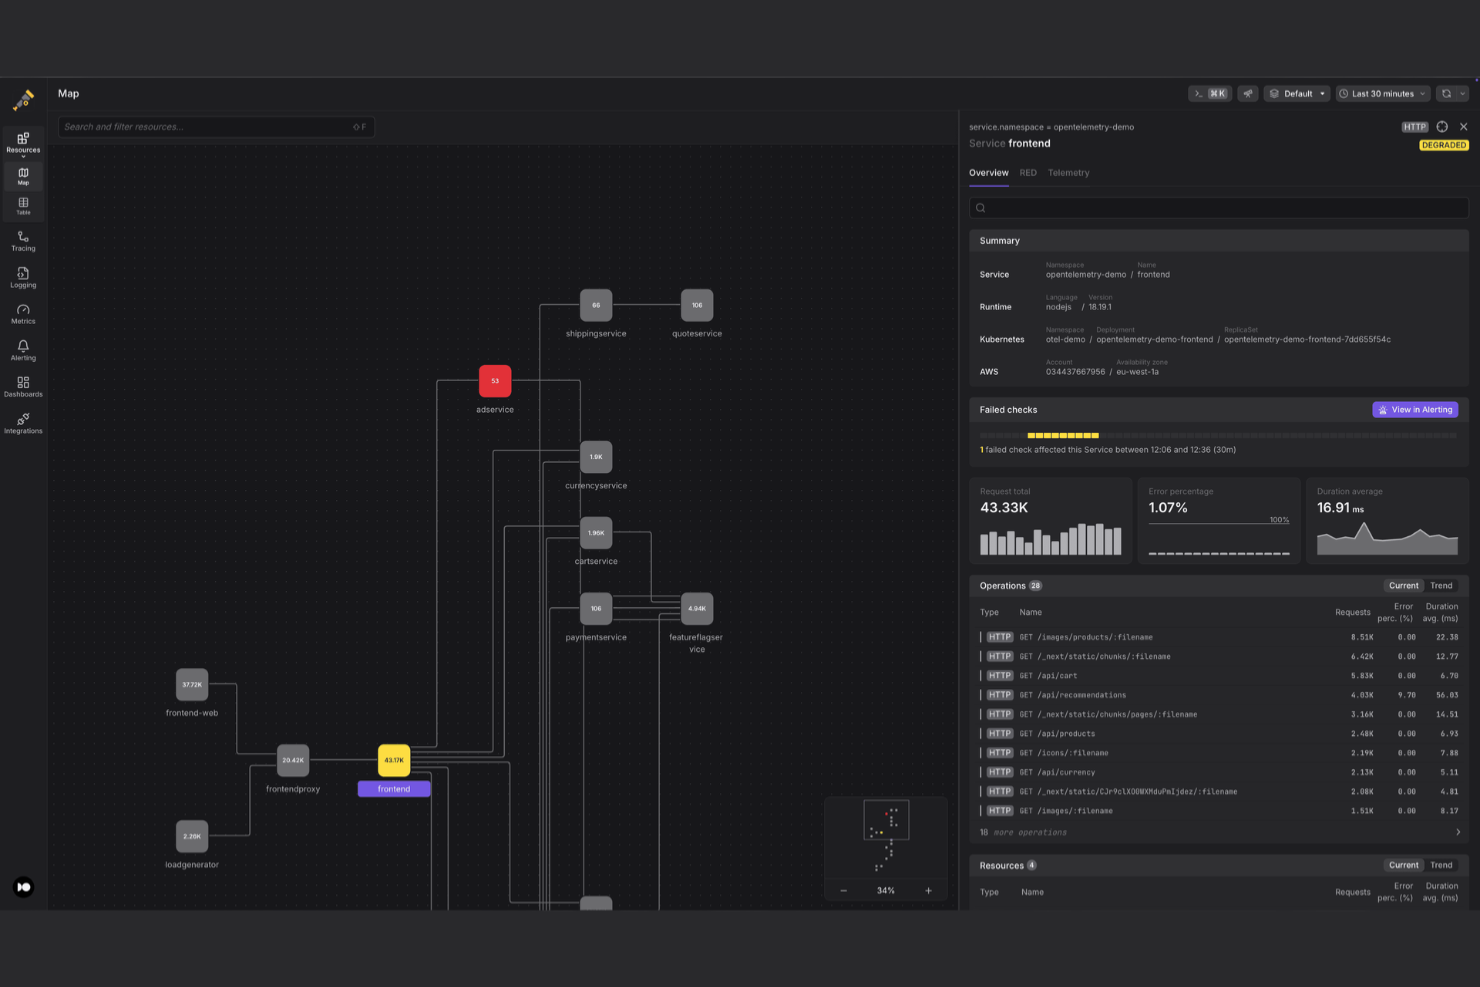
Azure Monitor è un servizio di monitoraggio completo progettato per professionisti IT e sviluppatori che utilizzano Microsoft Azure. Raccoglie, analizza e agisce sui dati di telemetria provenienti dai tuoi ambienti cloud e on-premises.
Perché è una buona alternativa a Datadog: Con l'integrazione nativa di Microsoft Azure, Azure Monitor offre un monitoraggio fluido su tutte le tue risorse Azure. Offre analisi integrate per approfondimenti dettagliati sulle tue applicazioni. La capacità del servizio di creare avvisi basati su metriche personalizzate ti informa tempestivamente su eventuali problemi delle pipeline. Inoltre, la sua scalabilità supporta ambienti ampi e dinamici, rendendolo ideale per aziende in crescita.
Funzionalità e integrazioni principali:
Le funzionalità includono log analytics, che ti permettono di interrogare e analizzare i dati dei log in modo efficiente. Application Insights offre un monitoraggio end-to-end delle tue applicazioni. Il servizio include anche il monitoraggio delle prestazioni di rete per tracciare e diagnosticare problemi di rete.
Le integrazioni comprendono Azure Automation, Azure Log Analytics, Azure Event Hubs, Azure Logic Apps, Azure Functions, Azure DevOps, Microsoft Graph, Power BI e altro ancora.
Pros and Cons
Pros:
- Integrazione e osservabilità native di Microsoft Azure
- Strumenti di log analytics integrati
- Supporta configurazioni cloud ibride
Cons:
- Configurazione manuale significativa per dashboard e avvisi
- Visibilità limitata sugli ambienti non Azure
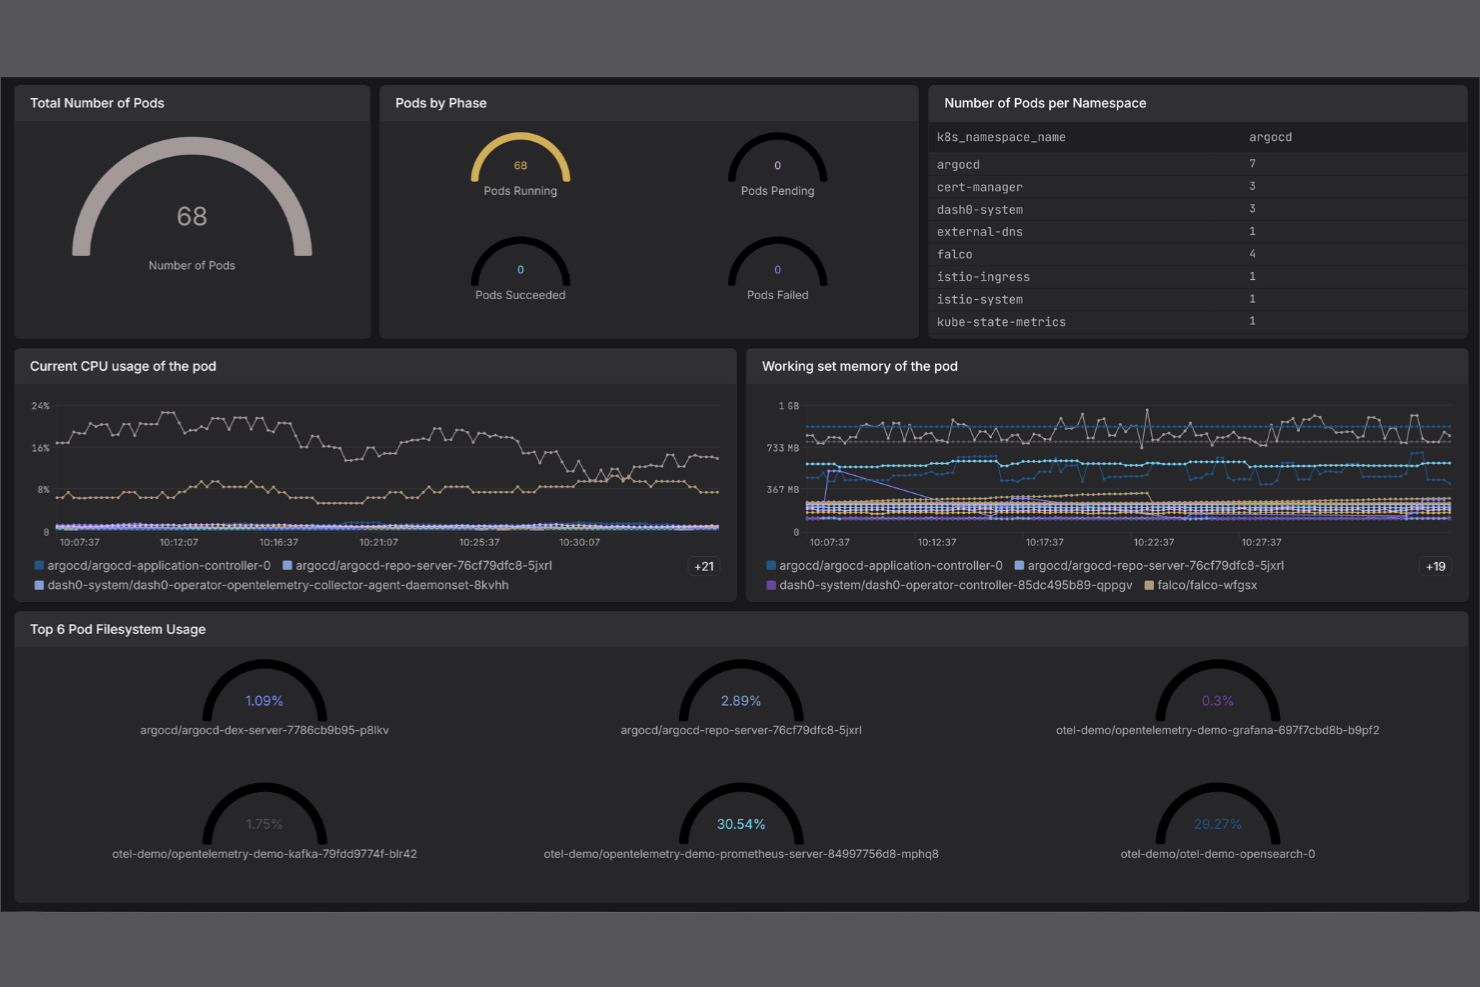
Dash0 è una piattaforma di osservabilità nativa per l'IA rivolta a sviluppatori, SRE e ingegneri di piattaforma. Aiuta a semplificare il monitoraggio e la gestione di log, metriche e tracce.
Perché è una buona alternativa a Datadog: Dash0 offre osservabilità nativa per l'IA, permettendo un monitoraggio semplificato senza configurazioni complesse. Il filtro istantaneo dei log e il monitoraggio centralizzato delle metriche garantiscono un tracciamento efficiente delle prestazioni. Il design nativo OpenTelemetry della piattaforma supporta l'instrumentazione, offre flessibilità e previene il lock-in con i fornitori. Tracciamento in tempo reale e dashboard personalizzabili consentono al tuo team di gestire e visualizzare i dati in modo più efficace.
Funzionalità principali e integrazioni:
Funzionalità includono il filtro istantaneo dei log, che rende facile trovare rapidamente log specifici. Il monitoraggio centralizzato delle metriche ti consente di tenere sotto controllo tutti i principali indicatori di prestazione in un’unica posizione. Puoi anche utilizzare il tracciamento in tempo reale per ottenere subito insight sulle prestazioni delle applicazioni.
Integrazioni includono Kubernetes, Prometheus, AWS, Google Cloud Platform, Microsoft Azure, Datadog, Grafana e altri.
Pros and Cons
Pros:
- Filtro istantaneo dei log
- Tracciamento in tempo reale
- Risoluzione dei problemi OTEL-first
Cons:
- Mancano alcune funzionalità avanzate
- Capacità di integrazione limitate
Altre alternative a Datadog
Ecco alcune altre alternative a Datadog che non sono entrate nella mia shortlist, ma che comunque meritano una visita:
- SigNoz
Ideale per il monitoraggio back-end nativo OpenTelemetry
- Dynatrace
Ideale per la mappatura delle dipendenze con IA su larga scala
- Chronosphere
Ideale per metriche cloud-native su larga scala


Criteri di selezione per le alternative a Datadog
Quando ho scelto le migliori alternative a Datadog da inserire in questa lista, ho tenuto conto delle necessità più comuni degli acquirenti e delle criticità legate alle piattaforme di monitoraggio cloud, come scalabilità e capacità di integrazione. Ho inoltre seguito il seguente schema di valutazione per mantenere il confronto equo e strutturato:
Funzionalità principali (25% del punteggio totale)
Per essere incluse in questa lista, tutte le soluzioni dovevano soddisfare questi casi d’uso comuni:
- Monitoraggio delle prestazioni di sistema
- Notifiche sugli anomalie
- Visualizzazione delle metriche dei dati
- Raccolta dei dati di log
- Supporto per ambienti cloud
Caratteristiche distintive aggiuntive (25% del punteggio totale)
Per selezionare ulteriormente i competitor, ho considerato anche funzionalità uniche come:
- Approfondimenti basati su AI
- Dashboard personalizzabili
- Analisi in tempo reale
- Analisi predittiva
- Supporto multi-cloud
Usabilità (10% del punteggio totale)
Per valutare l'usabilità di ciascun sistema, ho considerato i seguenti aspetti:
- Interfaccia utente intuitiva
- Navigazione semplice
- Opzioni di personalizzazione
- Accessibilità su diversi dispositivi
- Efficienza del flusso di lavoro
Onboarding (10% del punteggio totale)
Per valutare l’esperienza di onboarding su ciascuna piattaforma, ho preso in considerazione quanto segue:
- Disponibilità di video formativi
- Tour interattivi del prodotto
- Requisiti di curva di apprendimento
- Webinar dal vivo
- Assistenza tramite chatbot
Assistenza clienti (10% del punteggio totale)
Per valutare i servizi di assistenza clienti di ciascun fornitore, ho considerato i seguenti aspetti:
- Disponibilità di supporto 24/7
- Tempi di risposta
- Supporto multicanale
- Accesso alla knowledge base
- Assistenza personalizzata
Rapporto qualità-prezzo (10% del punteggio totale)
Per valutare il rapporto qualità-prezzo di ciascuna piattaforma, ho preso in esame i seguenti punti:
- Prezzi competitivi
- Set di funzionalità offerte
- Flessibilità delle licenze
- Costo degli add-on
- Ritorno sull'investimento
Recensioni dei clienti (10% del punteggio totale)
Per comprendere la soddisfazione generale dei clienti, ho prestato attenzione ai seguenti aspetti leggendo le recensioni:
- Soddisfazione degli utenti
- Lamentele ricorrenti
- Apprezzamento delle funzionalità
- Feedback sul supporto
- Affidabilità del prodotto
Perché cercare un'alternativa a Datadog?
Sebbene Datadog sia una buona scelta come piattaforma di monitoraggio cloud, esistono diversi motivi per cui alcuni utenti cercano soluzioni alternative. Potresti essere alla ricerca di un’alternativa a Datadog perché…
- Hai bisogno di opzioni tariffarie più economiche
- Il tuo team richiede una configurazione e una gestione più semplici
- Hai bisogno di una migliore integrazione con strumenti specifici
- La tua azienda necessita di maggiori funzionalità di personalizzazione
- Necessiti di supporto per una specifica area geografica
- Il tuo team ha bisogno di controlli migliori sulla privacy dei dati
Se ti riconosci in almeno uno di questi punti, sei nel posto giusto. Il mio elenco include diverse opzioni di piattaforme di monitoraggio cloud che sono meglio indicate per i team che affrontano queste criticità con Datadog e desiderano opzioni alternative.
Funzionalità principali di Datadog
Ecco alcune delle funzionalità principali di Datadog, per aiutarti a confrontare e valutare ciò che offrono le alternative:
- Monitoraggio dell’infrastruttura: Monitora metriche, container e reti per garantire che i tuoi sistemi funzionino correttamente.
- Monitoraggio delle prestazioni applicative: Offre informazioni sulle prestazioni delle applicazioni e sulla gestione dei database per ottimizzare l’esperienza utente.
- Gestione dei log: Gestisce i log con funzionalità come la scansione dei dati sensibili per aiutarti a mantenere sicurezza e conformità.
- Monitoraggio in tempo reale degli utenti: Traccia i percorsi degli utenti e le prestazioni del frontend per migliorare l’esperienza digitale.
- Monitoraggio sintetico: Simula le interazioni degli utenti per garantire operatività e disponibilità.
- Monitoraggio della sicurezza: Offre rilevamento delle minacce in tempo reale e gestione della compliance per proteggere i tuoi dati.
- Gestione dei servizi: Semplifica la risposta agli incidenti e i flussi di gestione dei casi per una maggiore efficienza operativa.
- Funzionalità di intelligenza artificiale: Utilizza strumenti AI per il rilevamento di anomalie e il monitoraggio delle prestazioni dei modelli per offrire approfondimenti più accurati.
- Monitoraggio delle applicazioni serverless: Fornisce analisi sulle applicazioni serverless per garantirne le prestazioni ottimali.
Cosa succede ora:
Se stai valutando piattaforme di monitoraggio cloud, contatta gratuitamente un consulente SoftwareSelect per raccomandazioni personalizzate.
Compili un modulo e fai una breve chiacchierata in cui ti chiedono i dettagli delle tue esigenze. Successivamente riceverai una lista ristretta di software da valutare. Ti supporteranno anche durante tutto il processo di acquisto, comprese le trattative sul prezzo.