10 Beste Systemüberwachungstools im Test 2026

10 Systemüberwachungstools – Die Besten auf einen Blick
Here's my pick of the 10 best software from the 17 tools reviewed.


Systemüberwachungstools helfen Ihnen, die Gesundheit und Leistung Ihrer Infrastruktur zu überwachen, sodass Sie Probleme erkennen und beheben können, bevor sie sich auf Anwender auswirken.
Viele Teams greifen auf diese Tools zurück, wenn sie mit unerwarteten Ausfällen, langsamen Systemen oder eingeschränkter Transparenz bei Netzwerkaktivitäten zu kämpfen haben. Ohne die richtige Lösung ist es schwer zu erkennen, was schiefläuft – oder überhaupt, wo man anfangen soll.
Ich habe mit SaaS- und MSP-Teams zusammengearbeitet, um Überwachungsplattformen auszuwählen und einzuführen, die Ausfallzeiten reduzieren und Reaktionszeiten verkürzen. Dieser Leitfaden fasst meine Erfahrungen zusammen und hilft Ihnen, ein Tool zu finden, das zu Ihrem System und Ihrem Workflow passt.
Why Trust Our Software Reviews
We’ve been testing and reviewing software since 2023. As tech leaders ourselves, we know how critical and difficult it is to make the right decision when selecting software.
We invest in deep research to help our audience make better software purchasing decisions. We’ve tested more than 2,000 tools for different tech use cases and written over 1,000 comprehensive software reviews. Learn how we stay transparent & our software review methodology.
Systemüberwachungstools – Zusammenfassung
Diese Vergleichstabelle fasst Preisinformationen meiner Top-Auswahl an Systemüberwachungstools zusammen und hilft Ihnen, das passende Tool für Ihr Budget und Ihren Geschäftsbedarf zu finden.
| Tool | Best For | Trial Info | Price | ||
|---|---|---|---|---|---|
| 1 | Am besten für Fernüberwachung und Verwaltung | 30-tägige kostenlose Testphase + kostenlose Demo verfügbar | Ab $149/Techniker/Monat (jährliche Abrechnung) | Website | |
| 2 | Am besten geeignet für die umfassende Überwachung komplexer IT-Strukturen | Kostenloser Tarif + 30-tägige kostenlose Testphase verfügbar | Ab $225/Monat (jährliche Abrechnung) | Website | |
| 3 | Am besten für Echtzeit-Fehlerverfolgung | Nein | Ab $26/Monat (jährlich abgerechnet) | Website | |
| 4 | Am besten für einfache, zentralisierte Systemüberwachung | Kostenlose Testversion verfügbar | Ab 2.149/Jahr | Website | |
| 5 | Am besten geeignet für Full-Stack-Infrastrukturüberwachung | Kostenlose Demo + 30-tägige kostenlose Testversion verfügbar | Ab $9/Monat (jährliche Abrechnung) | Website | |
| 6 | Am besten geeignet für die Überwachung verteilter Netzwerke | Kostenlose Demo verfügbar | Ab $245/25 Geräte | Website | |
| 7 | Am besten für KI-gesteuertes Full-Stack-Monitoring | Nein | Preise auf Anfrage | Website | |
| 8 | Am besten für umfassendes IT-Infrastruktur-Monitoring | Nein | Ab $1995 als Einmalgebühr (einmalig abgerechnet) | Website | |
| 9 | Am besten geeignet für Anwendungsleistungsmetriken | Nein | Ab $15/Host/Monat (jährliche Abrechnung) | Website | |
| 10 | Am besten für skalierbare Überwachungslösungen geeignet | Nein | Open-Source | Website |

-

Site24x7
Visit WebsiteThis is an aggregated rating for this tool including ratings from Crozdesk users and ratings from other sites.4.7 -
GitHub Actions
Visit WebsiteThis is an aggregated rating for this tool including ratings from Crozdesk users and ratings from other sites.4.8 -
Docker
Visit WebsiteThis is an aggregated rating for this tool including ratings from Crozdesk users and ratings from other sites.4.6


Systemüberwachungstools – Bewertungen
Nachfolgend finden Sie meine ausführlichen Zusammenfassungen der besten Systemüberwachungstools, die es auf meine Shortlist geschafft haben. Meine Bewertungen zeigen die wichtigsten Funktionen, Vor- u0026 Vorteile, Integrationen und idealen Anwendungsfälle jedes Tools, um Ihnen die Entscheidungsfindung zu erleichtern.
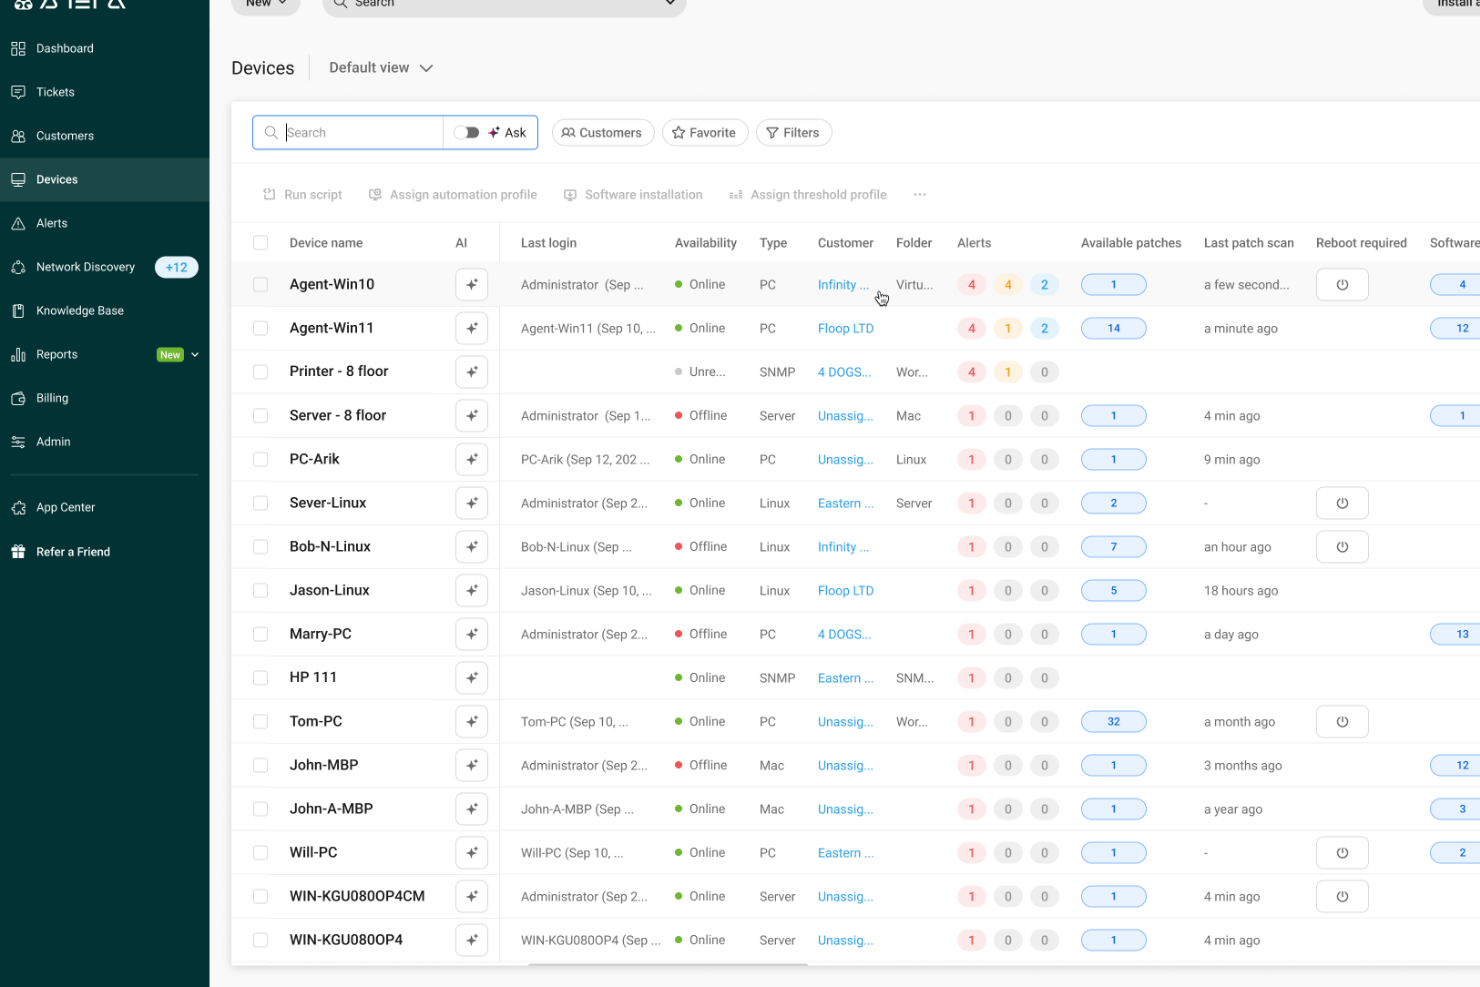
Atera bietet eine einheitliche Plattform, die Systemüberwachung, Benachrichtigungen, Patch-Management und Fernverwaltung zusammenführt—ideal, wenn Sie die IT-Infrastruktur für ein kleines Unternehmen oder einen MSP betreuen und einen besseren Überblick darüber wünschen, was Ihre Geräte tun. Besonders ansprechend ist das Tool für IT-Teams, die Server, Endpoints und Netzwerke verwalten und zeitnah benachrichtigt werden möchten, wenn etwa die CPU-Auslastung oder der Festplattenspeicher steigen.
Warum ich Atera gewählt habe
Ich habe Atera wegen seiner umfangreichen Fähigkeiten im Bereich Remote Monitoring und Management (RMM) ausgewählt, die für die Systemüberwachung entscheidend sind. Mit Atera können Sie kontinuierlich wichtige Kennzahlen wie Geräteverfügbarkeit, CPU-, RAM- und Festplattenauslastung überwachen. So bleibt Ihr Team dank Echtzeit-Benachrichtigungen und automatisierten Reaktionen potenziellen Problemen immer einen Schritt voraus und begegnet gängigen Herausforderungen rund um Systemleistung und Ressourcenmanagement proaktiv.
Atera Hauptfunktionen
Neben seinen RMM-Funktionen bietet Atera:
- Patch-Management: Aktualisiert und patcht Systeme automatisch, um Sicherheit und Leistung aufrechtzuerhalten.
- Netzwerkerkennung: Identifiziert und überwacht alle mit Ihrem Netzwerk verbundenen Geräte und sorgt so für einen umfassenden Überblick.
- IT-Automatisierung: Eigene Skripte und Automatisierungs-Workflows reduzieren manuelle Aufgaben und steigern die Produktivität.
- Helpdesk-Integration: Nahtlose Integration mit Ticket-Systemen für eine effizientere Problemlösung.
Atera Integrationen
Atera lässt sich mit bekannten Plattformen wie Microsoft Teams, Slack, Zapier, Bitdefender, Acronis, Splashtop, Domotz und Cynet integrieren. Diese Schnittstellen erweitern den Funktionsumfang und sorgen für ein durchgängiges IT-Management-Erlebnis.
Pros and Cons
Pros:
- Grenzwert-Warnungen und Fernwartungstools verkürzen die Reaktionszeit bei Gerätevorfällen.
- Integriertes Asset- und Software-Inventar ermöglicht Transparenz bei Hard- und Softwarebereitstellungen.
- Bündelt das IT-Management auf einer Plattform und vereinfacht die Abläufe.
Cons:
- Projektmanagement und komplexes SLA-Tracking sind relativ eingeschränkt.
- Weniger granulare Steuerung bei hochkomplexen, individuellen Workflows oder Integrationen.
New Product Updates from Atera

Atera Enhances IT Autopilot With Automation and File Support
Atera’s IT Autopilot gets three major boosts: you can now attach common files for deeper analysis, automate IT tasks with clear workflows, and choose how the system follows up when users go silent. These updates help streamline IT operations and improve resolution efficiency. For more information, visit Atera’s official site.
Checkmk
Am besten geeignet für die umfassende Überwachung komplexer IT-Strukturen
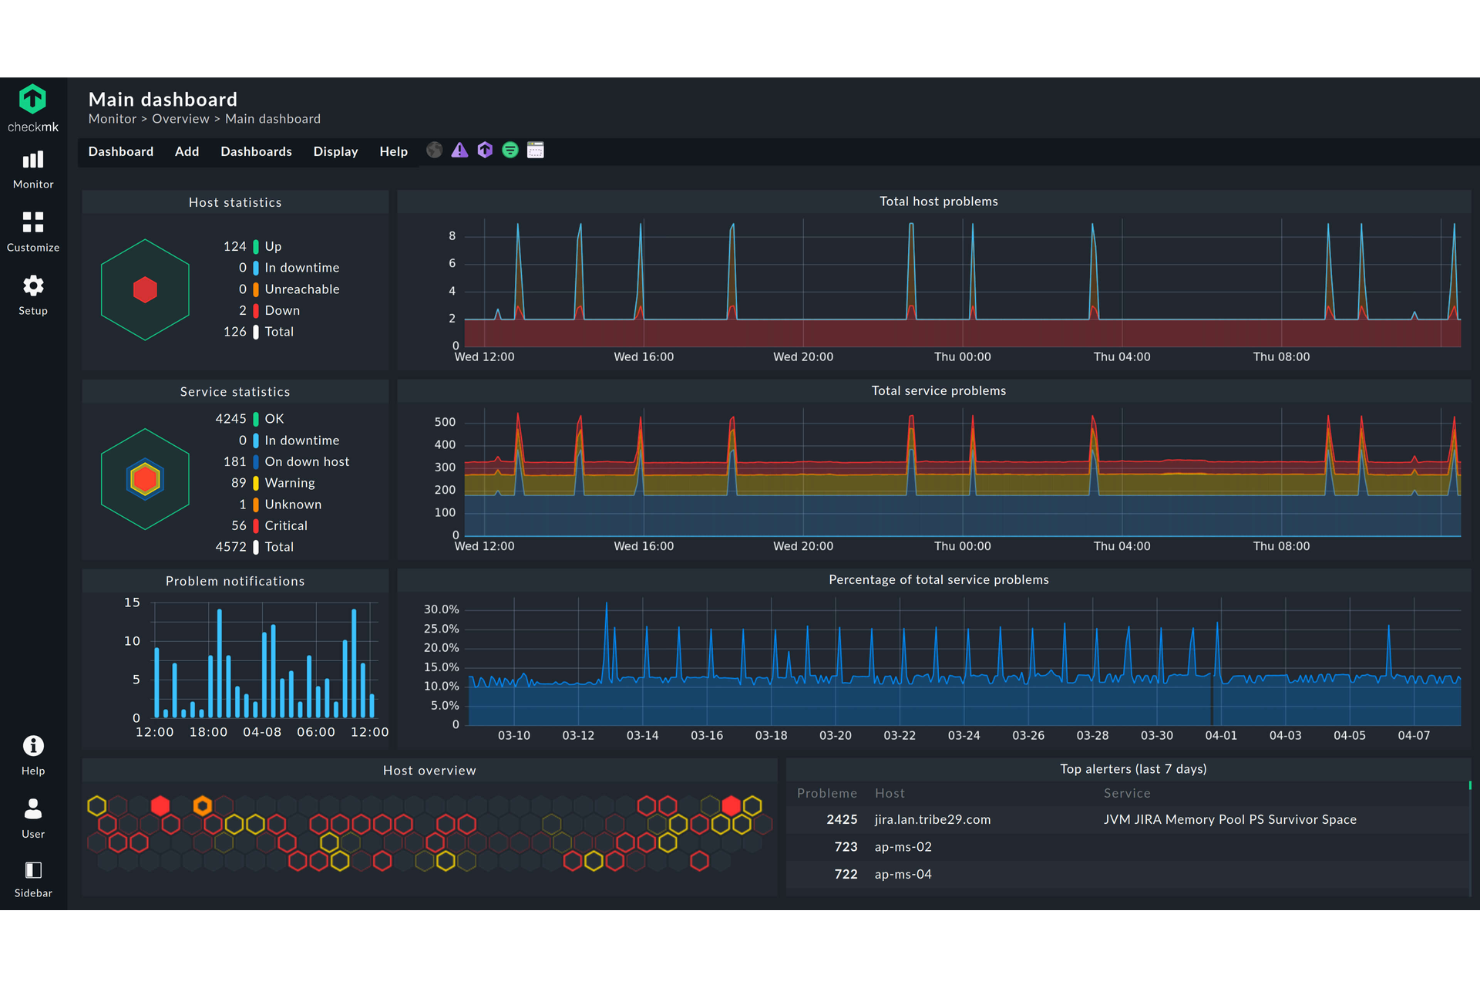
Checkmk bietet eine umfassende Lösung für IT-Fachkräfte, die ein zuverlässiges Systemüberwachungstool suchen, das sowohl Cloud- als auch On-Premises-Umgebungen unterstützt. Checkmk ist darauf ausgelegt, unterschiedliche IT-Infrastrukturen zu bedienen, und spricht Unternehmen an, die Anwendungen, Netzwerke und Server einfach überwachen möchten. Durch die Automatisierung von Überwachungsprozessen und die Bereitstellung tiefergehender Einblicke begegnet Checkmk Herausforderungen wie unerwarteten Ausfällen und Ressourcenineffizienzen.
Warum ich Checkmk gewählt habe
Ich habe mich für Checkmk entschieden, weil es eine durchgängige Überwachung in komplexen IT-Umgebungen ermöglicht. Die Automatisierungsfunktionen des Tools, wie zum Beispiel das Host-Lifecycle-Management und die automatische Registrierung, vereinfachen die Einrichtung und Wartung dynamischer Systeme. Darüber hinaus sorgt der umfangreiche Plugin-Support mit über 2.000 Plugins für eine nahtlose Überwachung auf verschiedenen Plattformen. Diese Fähigkeiten machen Checkmk zu einer ausgezeichneten Wahl für Organisationen, die eine hohe Performance und Verfügbarkeit ihrer IT-Infrastruktur gewährleisten möchten.
Checkmk Hauptfunktionen
Neben der durchgängigen Überwachung komplexer IT-Systeme bietet Checkmk:
- Log-Überwachung: Kombiniert Metrik- und Protokolldaten, um Probleme schnell zu erkennen und die Überlastung von Bedienern zu reduzieren.
- Geschäftsprozessüberwachung: Stellt Abhängigkeiten von Anwendungen dar, um zentrale Geschäftsprozesse zu überwachen und liefert Echtzeit- sowie historische Einblicke.
- Individuelle Dashboards: Ermöglicht die Erstellung interaktiver Grafiken und angepasster Ansichten zur besseren Visualisierung des IT-Zustands.
- Intelligente Alarmierung: Bietet gezielte Benachrichtigungen und lässt sich in ITSM-Systeme integrieren, um Vorfälle effektiv zu verwalten.
Checkmk Integrationen
Zu den nativen Integrationen gehören APC, Brocade, Cisco Systems, Dell, Fujitsu, Hewlett Packard Enterprise, IBM, Microsoft SQL Server, Oracle Database und VMware ESX.
Pros and Cons
Pros:
- Unterstützt angepasste Überwachungskonfigurationen für komplexe Umgebungen
- Echtzeit-Updates im Dashboard für bessere Transparenz der Infrastruktur
- Flexible Überwachungsoptionen, die individuelle Setups unterstützen
Cons:
- Begrenzte Hilfestellung und Dokumentation für Einsteiger
- Oberfläche wirkt anfangs verwirrend
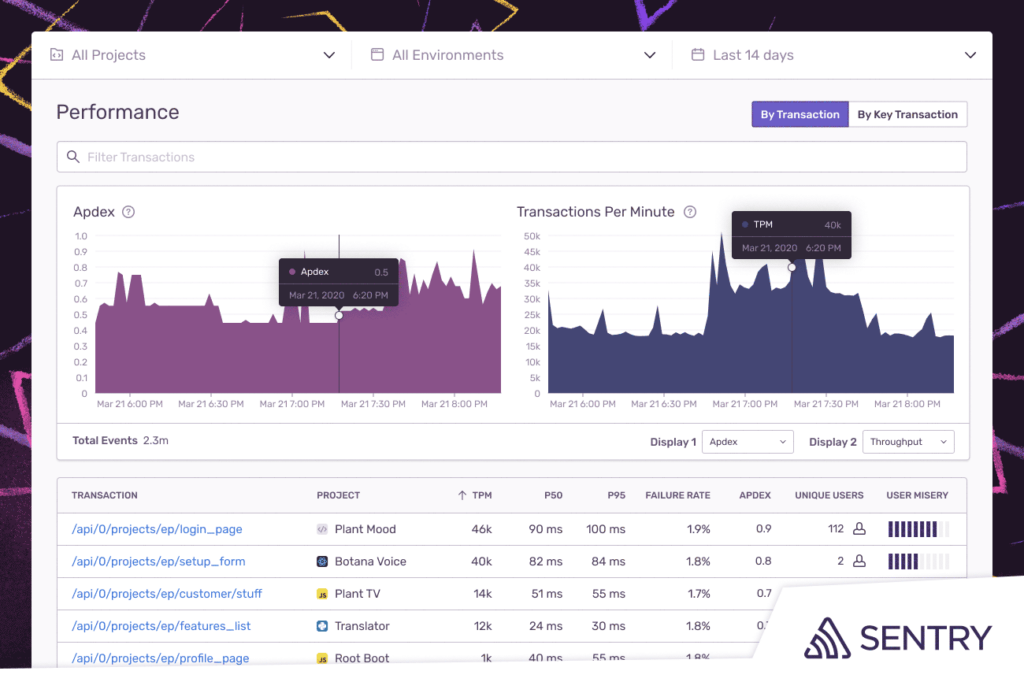
Sentry ist eine Open-Source-Plattform, die Fehlerverfolgung in verschiedenen Anwendungen ermöglicht und Entwicklern hilft, Probleme effizient zu erkennen, einzuordnen und zu lösen. Seine Fähigkeit, Echtzeit-Einblicke in Anwendungsfehler und deren Ursachen zu liefern, macht Sentry besonders geeignet für den Titel 'am besten für Echtzeit-Fehlerverfolgung'.
Warum ich Sentry ausgewählt habe: Bei der Auswahl der leistungsfähigsten Tools zur Fehlerverfolgung stach Sentry in meinen Bewertungen immer wieder hervor. Was das Tool besonders macht, ist die Möglichkeit, Fehler sofort sichtbar zu machen, wodurch das Debugging schneller und effizienter wird.
Ich bin zu dem Schluss gekommen, dass Sentry für Entwickler, die Wert auf Echtzeit-Einblicke und eine schnelle Behebung von Problemen legen, die beste Wahl für die Echtzeit-Fehlerverfolgung ist.
Herausragende Funktionen & Integrationen:
Sentry überzeugt mit detaillierten Stacktraces, die dabei helfen, die genaue Codezeile des Problems zu finden. Die Release-Tracking-Funktion verschafft einen klaren Überblick darüber, wann neue Fehler auftreten, was das Monitoring nach dem Deployment verbessert.
Darüber hinaus bietet Sentry Integrationen mit beliebten Plattformen und Tools wie GitHub, Slack und Jira, was ein reibungsloses Fehlermanagement gewährleistet.
Pros and Cons
Pros:
- Detaillierte Stacktraces liefern präzise Fehlerstellen
- Kontextbezogene Daten unterstützen das Nachstellen und Lösen von Problemen
- Integriert sich mit vielen gängigen Entwicklungs- und Kommunikationstools
Cons:
- Kann durch seinen großen Funktionsumfang Einsteiger überfordern
- Größere Teams müssen eventuell upgraden, um mehr Ereignisse zu erfassen
- Einige Nutzer wünschen sich flexiblere Benachrichtigungsoptionen
New Product Updates from Sentry

Sentry Enhances Alerting Across Uptime and Metrics
Sentry introduces expanded alert configuration for Uptime Monitors and adds alerting support to its Metrics open beta. These updates improve issue detection by enabling more flexible monitoring conditions and proactive alerts. For more information, visit Sentry’s official site.
 .
.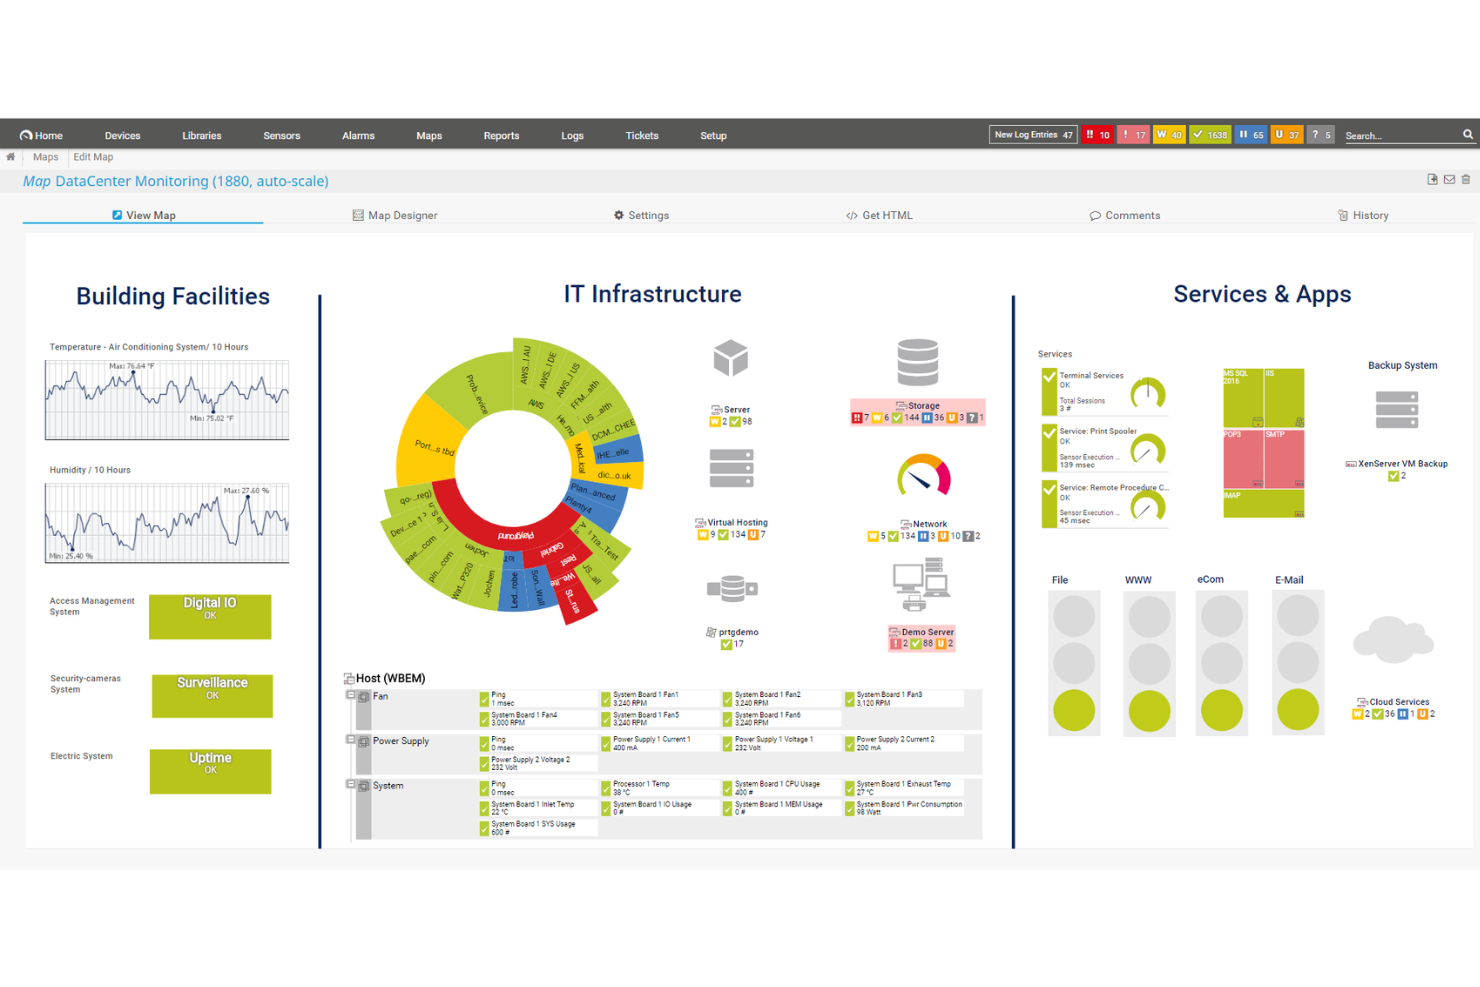
PRTG ist ein umfassendes Systemüberwachungstool, das entwickelt wurde, um Ihnen die Überwachung Ihrer gesamten IT-Infrastruktur zu ermöglichen. Es bietet Echtzeiteinblicke in den Zustand, die Leistung und die Sicherheit Ihres Netzwerks, sodass Sie Probleme frühzeitig erkennen und umgehend beheben können.
Warum ich PRTG ausgewählt habe: Eines der Hauptmerkmale von PRTG sind die anpassbaren Warnmeldungen und die Datenvisualisierung. Sie können spezifische Schwellenwerte für verschiedene Kennzahlen festlegen und PRTG benachrichtigt Sie sofort, wenn diese überschritten werden. Dieser proaktive Ansatz ermöglicht es Ihrem Team, schnell auf potenzielle Probleme zu reagieren, Ausfallzeiten zu minimieren und die Systemzuverlässigkeit zu gewährleisten.
Mir gefällt auch die einfache, zentralisierte Systemüberwachung: Sie erhalten einen ganzheitlichen Überblick über Systemzustand und -leistung. Das PRTG-Tool ermöglicht Ihnen die Überwachung aller Aspekte Ihrer IT-Infrastruktur – von einzelnen Geräten bis hin zu kompletten Netzwerken. Diese umfassende Kontrolle erleichtert das Erkennen von Problemen, die bei der isolierten Betrachtung einzelner Komponenten möglicherweise übersehen werden, und unterstützt eine effektivere Fehlersuche und Wartung.
Hervorstechende Funktionen & Integrationen:
Weitere Funktionen umfassen Echtzeitüberwachung, anpassbare Dashboards, historische Datenanalyse, verteiltes Monitoring, flexible Warnmeldungsoptionen, mobilen Zugriff, Remote-Sensoren, automatische Geräteerkennung, SNMP-Monitoring, WMI- und Windows-Leistungsindikatoren, SSH-Monitoring und HTTP-Anfragenüberwachung.
Zu den Integrationen gehören AWS, Cisco, Dell Technologies, HPE, VMware, ServiceNow, Check Point, Sonicwall, NetApp, Fujitsu, Lansweeper und Martello.
Pros and Cons
Pros:
- Unterstützt verschiedene Überwachungstechnologien
- Anpassbare Dashboards und Echtzeitwarnmeldungen
- Skalierbar für wachsende Netzwerkansprüche
Cons:
- Die Ersteinrichtung kann zeitaufwändig sein
- Lizenzierung basierend auf Sensoren kann bei größeren Netzwerken teuer werden
New Product Updates from PRTG
PRTG Introduces New Monitoring Sensors In Beta
This week, PRTG introduces three BETA sensors that broaden your monitoring scope for Proxmox VE clusters and SIMATIC S7-300/400 PLCs, giving you deeper operational insights. For more information, visit PRTG’s official site.
 .
.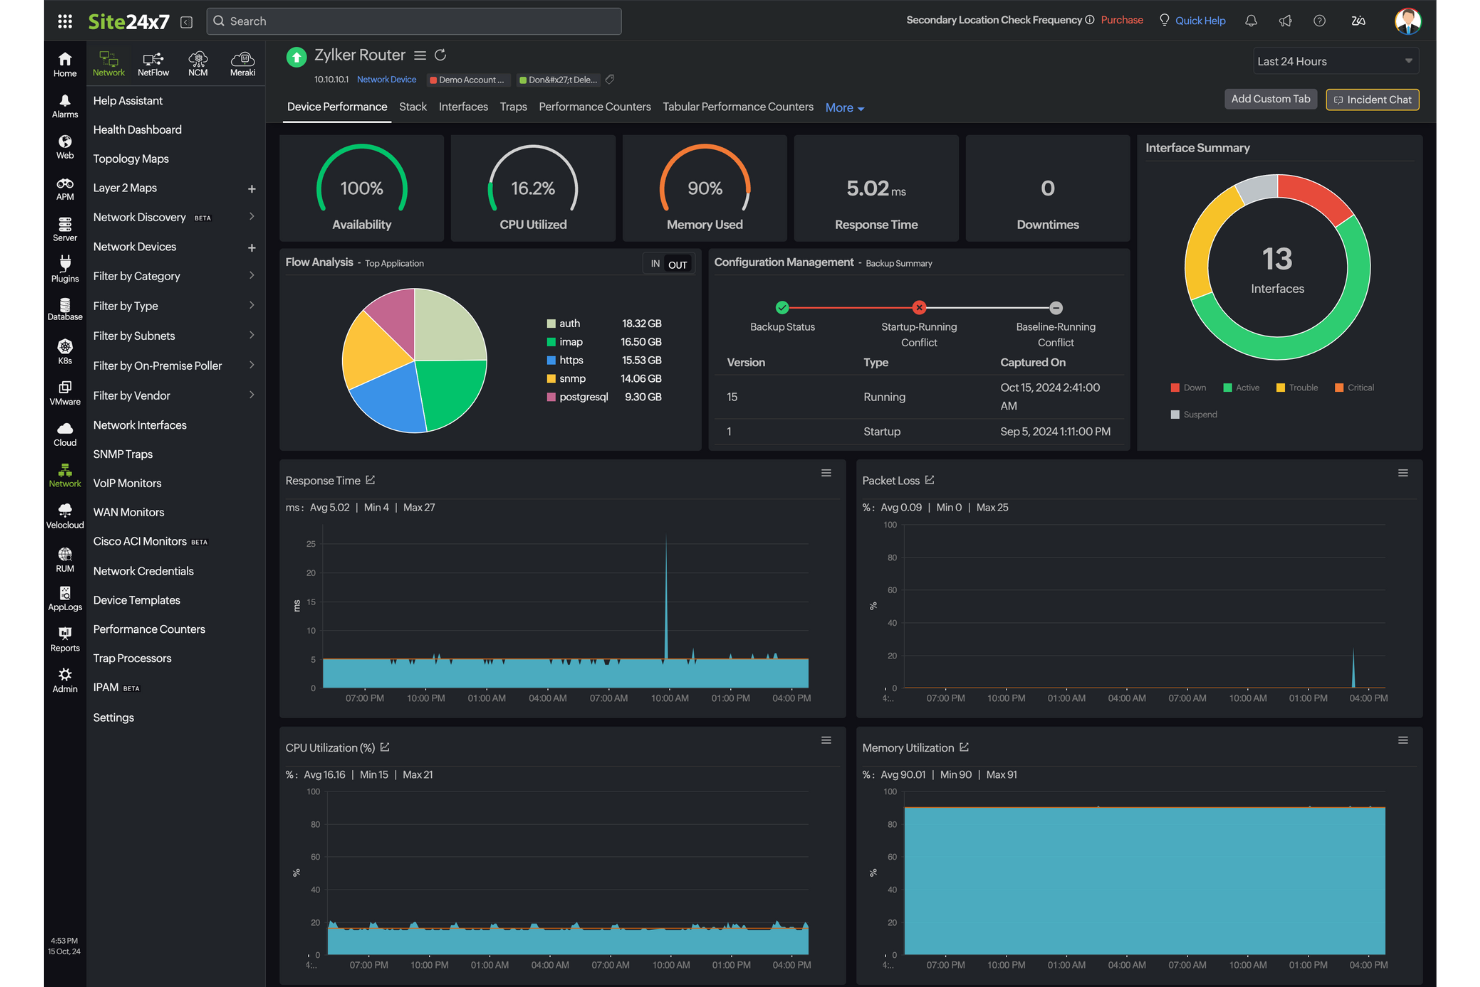
Für IT-Fachleute, die nach einer zuverlässigen Systemüberwachungslösung suchen, bietet Site24x7 eine Full-Stack-Infrastrukturüberwachung, die den Herausforderungen des modernen Infrastrukturmanagements gerecht wird. Das Angebot richtet sich an Unternehmen jeder Größe, vom Kleinunternehmen bis zum Großkonzern, und bietet Überwachungsfunktionen, die zur Aufrechterhaltung der Leistungsfähigkeit digitaler Ressourcen beitragen. Egal, ob Sie Cloud-Dienste, Netzwerkgeräte oder Anwendungen verwalten – Site24x7 stellt die Werkzeuge bereit, um Probleme schnell zu erkennen und zu beheben und so Systeme stabil und zugänglich zu halten.
Warum ich Site24x7 ausgewählt habe
Ich habe Site24x7 aufgrund seiner umfassenden Infrastrukturüberwachungsfunktionen ausgewählt, die für Unternehmen, die eine gesunde IT-Umgebung aufrechterhalten möchten, unerlässlich sind. Die einzigartige Fähigkeit, sowohl Server-, Cloud- als auch Virtualisierungsüberwachung abzudecken, gewährleistet einen vollständigen Überblick über die IT-Ressourcen. Die Plattform überzeugt außerdem durch ihr Application Performance Monitoring, das es ermöglicht, Applikationsgesundheit und Leistungskennzahlen zu verfolgen und gezielt zu optimieren. Diese Eigenschaften sind besonders vorteilhaft für Teams, die potenzielle Probleme proaktiv verwalten und lösen möchten, bevor sie Endnutzer beeinträchtigen.
Site24x7 Hauptfunktionen
Neben der Full-Stack-Infrastrukturüberwachung bietet Site24x7:
- Real User Monitoring (RUM): Diese Funktion liefert Einblicke in Echtzeit zu Nutzerinteraktionen und hilft Ihnen, das Nutzererlebnis zu verstehen und zu verbessern.
- Log-Management: Ermöglicht zentrale Verwaltung und Analyse von Protokolldaten, um operative Einblicke und eine bessere Fehlerbehebung zu ermöglichen.
- AIOps: Nutzt künstliche Intelligenz, um operative Einblicke zu liefern und Routineaufgaben zu automatisieren, was die Effizienz steigert.
- Cloud Kostenmanagement: Unterstützt bei Verwaltung und Optimierung der Cloud-Ausgaben, um Ressourcen kosteneffektiv zu nutzen.
Site24x7 Integrationen
Zu den Integrationen gehören ServiceNow, PagerDuty, Slack, Microsoft Teams, Jira, Zoho Analytics, Google Cloud Platform, ManageEngine ServiceDesk Plus, 6clicks und mehr.
Pros and Cons
Pros:
- KI-gestützte Full-Stack-Überwachung unterstützt Multicloud-Infrastrukturmanagement
- Schnelle Inbetriebnahme deckt Website- und Cloudressourcen-Überwachung ab
- Flexible Überwachung lässt sich problemlos mit verschiedenen Infrastrukturkomponenten integrieren
Cons:
- Fehler bei Benachrichtigungen führen zu Problemen beim Hinzufügen neuer Überwachungskonfigurationen
- Die Preisstruktur wird aufgrund verschiedener Überwachungstypen teuer
New Product Updates from Site24x7

Site24x7 Enhances Network Monitoring With Device and Visibility Updates
Site24x7 introduces proactive hardware health monitoring, expanded device support, centralized network controls, and enhanced SD-WAN visualization to improve network monitoring and management. For more information, visit Site24x7’s official site.
 .
.Am besten geeignet für die Überwachung verteilter Netzwerke
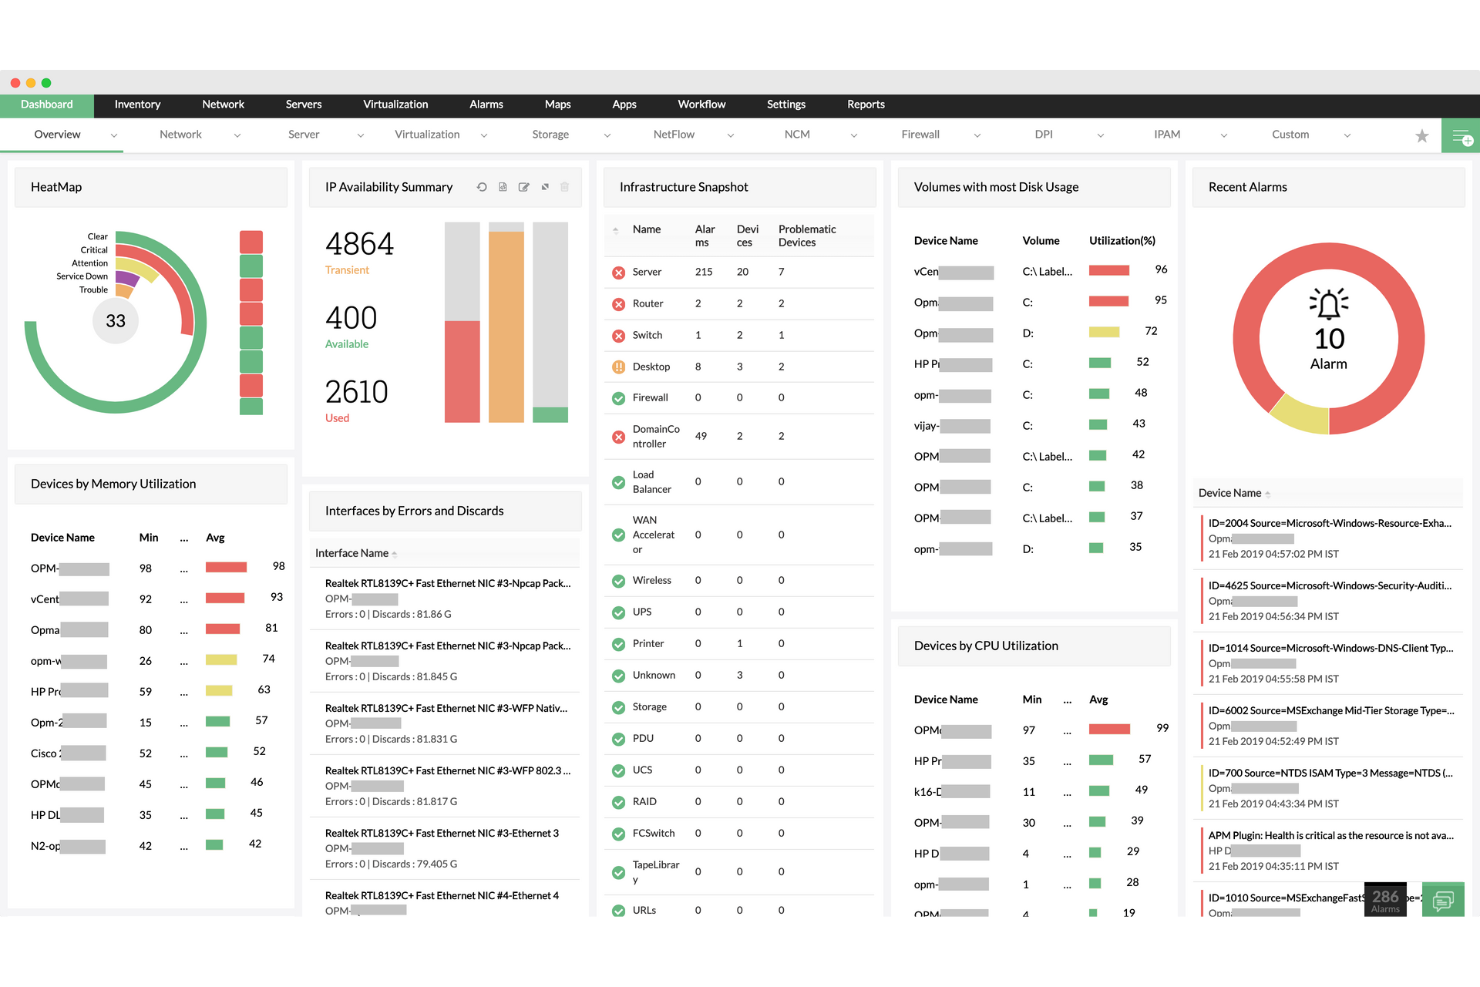
ManageEngine OpManager ist eine leistungsstarke Netzwerküberwachungslösung, die Echtzeit-Einblicke in die gesamte IT-Infrastruktur bietet. Sie überwacht den Zustand, die Verfügbarkeit und die Performance von Netzwerkgeräten, Servern und Anwendungen, um einen zuverlässigen Betrieb in verteilten Netzwerken sicherzustellen.
Warum ich ManageEngine OpManager gewählt habe: Ich habe mich für ManageEngine OpManager aufgrund seines starken Fokus auf die Überwachung verteilter Netzwerke und seiner umfassenden Integrationsmöglichkeiten entschieden. Die Unterstützung für Remote-Probes und zentrale Dashboards macht es besonders effektiv für Unternehmen, die komplexe, standortübergreifende Umgebungen verwalten. Die Kombination aus Echtzeit-Benachrichtigungen, detaillierten Visualisierungstools und Hardwareüberwachung empfand ich als besonders nützlich für proaktive Problemlösungen und Kapazitätsplanung.
Hervorstechende Funktionen & Integrationen:
ManageEngine OpManager bietet Funktionen wie die Überwachung verteilter Netzwerke mit Remote-Probes, fortschrittliche Visualisierungstools (Layer2-Maps, Topologie-Maps und 3D-Rack-Ansichten) sowie Speicherüberwachung für ein effektives Kapazitätsmanagement. Es beinhaltet Netzwerkpfadanalyse und AIOps-basierte Funktionen zur intelligenten Anomalie-Erkennung und automatisierten Workflows.
ManageEngine OpManager integriert sich mit einer Vielzahl von IT-Management- und Sicherheitstools, darunter ADManager Plus, ServiceDesk Plus, Endpoint Central, Patch Manager Plus, Mobile Device Manager Plus, Log360, EventLog Analyzer, Firewall Analyzer, Analytics Plus und CloudSpend.
Pros and Cons
Pros:
- Automatisierte, geplante Netzwerkerkennung
- Unterstützt verschiedene Anbieterumgebungen
- Echtzeit- und automatisch aktualisierte Netzwerkübersichten
Cons:
- Preisgestaltung kann für kleine Teams hoch sein
- Ersteinrichtung kann komplex sein
New Product Updates from ManageEngine OpManager
ManageEngine OpManager Vendor Templates and NCM XML Import
ManageEngine OpManager introduces enhanced vendor template integration and device template import for the NCM module using XML files. This update helps teams improve device classification and speed up configuration workflows. For more information, visit ManageEngine OpManager’s official site.
 .
.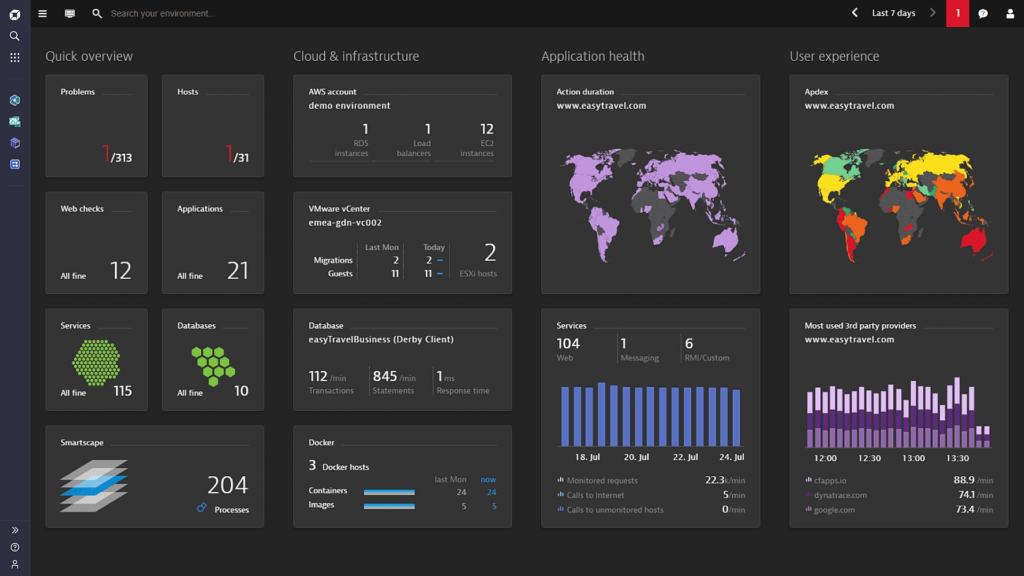
Dynatrace bietet eine umfassende Monitoring-Lösung, die den gesamten Stack einer digitalen Umgebung abdeckt. Mit seinem KI-gesteuerten Ansatz identifiziert Dynatrace Leistungsprobleme, Anomalien und andere relevante Kennzahlen, was es für Unternehmen, die stark auf die Performance ihrer digitalen Ressourcen angewiesen sind, unabdingbar macht.
Warum ich Dynatrace gewählt habe: Unter den zahlreichen Überwachungslösungen habe ich Dynatrace aufgrund seiner robusten KI-Funktionen ausgewählt, die es von seinen Wettbewerbern abheben. Nach Prüfung und Vergleich mehrerer Tools bin ich der Ansicht, dass Dynatrace präzise Einblicke liefert.
Angesichts der steigenden Komplexität digitaler Umgebungen habe ich festgestellt, dass ein KI-gesteuertes Tool wie Dynatrace am besten für Unternehmen geeignet ist, die eine Full-Stack-Überwachung benötigen.
Hervorstechende Funktionen & Integrationen:
Eine der zentralen Funktionen von Dynatrace ist seine Davis AI, die eigenständig in Echtzeit Probleme erkennt, priorisiert und diagnostiziert. Darüber hinaus bietet die Plattform Überwachung von Cloud-Infrastrukturen und Einblicke in die digitale Nutzererfahrung.
Dynatrace lässt sich nahtlos mit beliebten Plattformen wie AWS, Azure und Google Cloud integrieren, sodass Unternehmen Daten aus verschiedenen Umgebungen erfassen können.
Pros and Cons
Pros:
- Davis AI ermöglicht autonome Problemerkennung und -diagnose in Echtzeit
- Bietet einen ganzheitlichen Überblick über digitale Umgebungen, von der Cloud bis zur Nutzererfahrung
- Umfangreiche Integrationen mit führenden Cloud-Plattformen
Cons:
- Das Fehlen einer transparenten Preisgestaltung könnte potenzielle Nutzer abschrecken
- Könnte für kleinere Unternehmen oder einfachere Setups zu umfassend sein
- Einige Nutzer empfinden die Ersteinrichtung und Konfiguration als herausfordernd
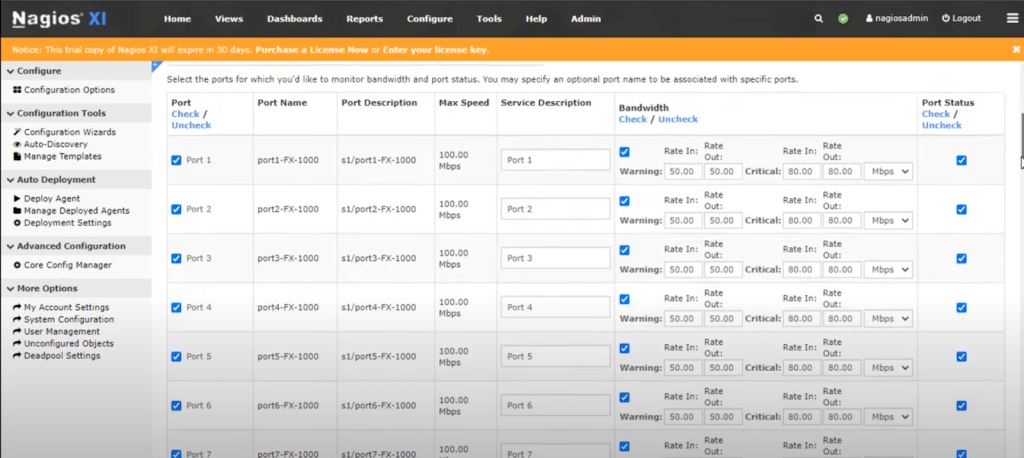
Nagios hat sich als Branchenführer in der Überwachung von IT-Infrastrukturen positioniert. Bekannt für seine Breite und Tiefe sorgt Nagios dafür, dass Systeme, Anwendungen, Dienste und Geschäftsprozesse innerhalb eines Unternehmens wie erwartet funktionieren.
Warum ich Nagios ausgewählt habe: Bei der Auswahl eines Tools für umfassendes IT-Infrastruktur-Monitoring hat sich Nagios bei meinem Vergleich als Spitzenreiter herauskristallisiert. Besonders überzeugend fand ich die Flexibilität bei der Überwachung sowohl großer als auch kleiner Netzwerkumgebungen.
Meiner Einschätzung nach steht Nagios für Unternehmen, die einen ganzheitlichen Überblick über ihre gesamte IT-Landschaft benötigen, an der Spitze und verdient daher die Auszeichnung „am besten für umfassendes IT-Infrastruktur-Monitoring“.
Herausragende Funktionen & Integrationen:
Nagios überzeugt durch die Fähigkeit, Hosts über mehrere Plattformen hinweg zu überwachen und Ausfälle sowie Anomalien eindeutig zu identifizieren. Die ausführlichen Berichte bieten Administratoren detaillierte Einblicke, die ein proaktives Handeln ermöglichen.
Zur Erweiterung seiner Funktionalität bietet Nagios Integrationen mit einer Reihe von Plugins und Add-ons, um die Überwachungsmöglichkeiten auszubauen.
Pros and Cons
Pros:
- Umfassende Überwachungsmöglichkeiten in unterschiedlichsten IT-Umgebungen
- Umfangreiche Plugin-Architektur ermöglicht individuelle Monitoring-Lösungen
- Detaillierte Berichts- und Alarmierungsmechanismen
Cons:
- Die Benutzeroberfläche wirkt im Vergleich zu manchen Mitbewerbern veraltet
- Die Konfiguration kann für Einsteiger komplex sein
- Kommerzielle Versionen können für kleinere Organisationen teuer sein
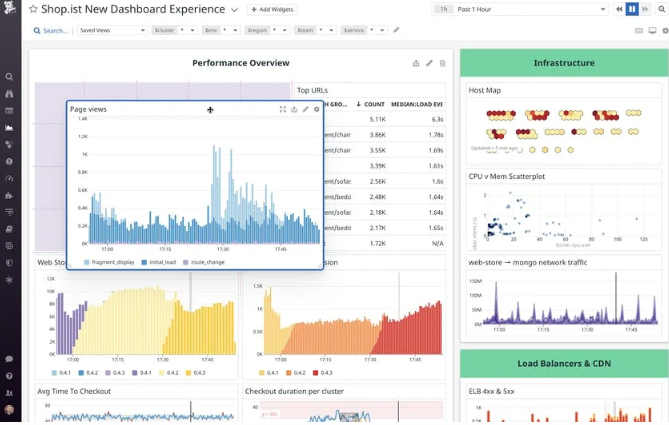
Datadog ist eine cloudbasierte Überwachungs- und Analyseplattform, die tiefe Einblicke in die Performance von Anwendungen bietet. Sie konsolidiert Metriken, Traces und Logs in einer einheitlichen Plattform und ist damit besonders stark im Bereich der Anwendungsleistungsüberwachung und in der präzisen Messung von Metriken.
Warum ich Datadog gewählt habe: Bei der Auswahl der besten Tools zur Überwachung fiel Datadog in meiner Analyse besonders auf. Ich bewertete die Fähigkeit, präzise und granulare Echtzeiteinblicke in Anwendungen zu bieten, als einen Hauptunterscheidungsfaktor. Aufgrund der Tiefe und Breite der Funktionen halte ich Datadog für besonders geeignet für Leistungsmetriken von Anwendungen.
Hervorstechende Funktionen & Integrationen:
Datadog ist bekannt für sein APM (Application Performance Monitoring), das detaillierte Performance-Einblicke und Ursachenanalysen ermöglicht. Das verteilte Tracing und die Echtzeitanalyse helfen Teams, Engpässe im Anwendungsablauf zu erkennen. Ergänzend zur Kernfunktionalität lässt sich Datadog mit einer Vielzahl von Diensten wie AWS, Azure und Google Cloud integrieren und bietet eine breite Palette von API-Integrationen.
Pros and Cons
Pros:
- Leistungsstarkes APM mit aufschlussreicher Datenvisualisierung
- Breite Palette an Integrationen mit Cloud-Anbietern und anderen Diensten
- Anpassbare Dashboards für individuelle Überwachungsbedürfnisse
Cons:
- Kann für kleinere Teams oder Projekte kostspielig sein
- Steilere Lernkurve für die vollständige Nutzung aller Funktionen
- Einige Nutzer berichten über gelegentliche Verzögerungen bei der Aktualisierung von Metriken
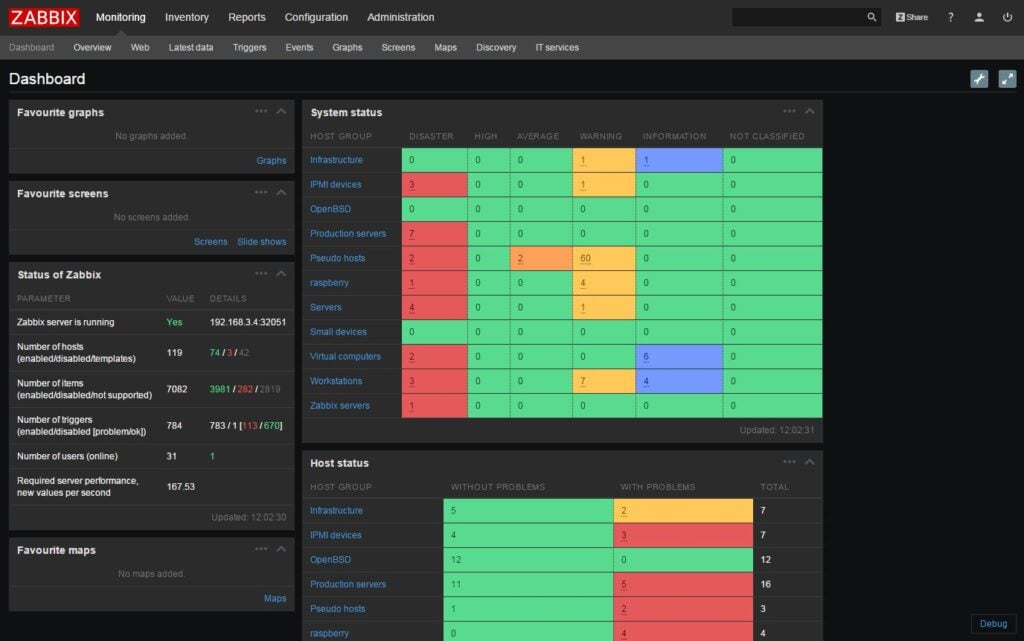
Zabbix ist eine ausgereifte Open-Source-Überwachungslösung, die entwickelt wurde, um den Status verschiedener Netzwerkdienste, Server-Überwachungen und anderer Netzwerkhardware zu überwachen und zu verfolgen. Aufgrund seiner Skalierbarkeit eignet es sich für Unternehmen jeder Größe und bietet sowohl detaillierte als auch umfassende Einblicke, was es zu einer führenden Wahl für skalierbare Überwachungslösungen macht.
Warum ich Zabbix gewählt habe: Ich habe Zabbix in diese Liste aufgenommen, nachdem ich es gründlich mit seinen Mitbewerbern verglichen habe. Meiner Meinung nach liegt seine Stärke in der Fähigkeit, große Netzwerke zu verwalten und dabei detaillierte Analysen bereitzustellen. Dieses Unterscheidungsmerkmal passt perfekt zu Organisationen, die Skalierbarkeit in ihren Überwachungsmaßnahmen benötigen.
Herausragende Funktionen & Integrationen:
Zabbix bietet Echtzeit-Überwachung und stellt sicher, dass Systeme stets funktionsfähig sind. Die fortschrittliche Problemerkennung ermöglicht zügige Fehlerbehebung. Bei den Integrationen unterstützt Zabbix eine breite Palette von Plattformen, darunter Linux, Solaris, HP-UX, AIX, FreeBSD, OpenBSD, OS X und Windows, was seine Vielseitigkeit in unterschiedlichen Umgebungen beweist.
Pros and Cons
Pros:
- Open-Source-Plattform, was sie für Unternehmen kostengünstig macht.
- Bietet Unterstützung für eine Vielzahl von Betriebssystemen.
- Fortschrittliche Problemerkennung unterstützt bei der schnellen Fehlerbehebung
Cons:
- Die Benutzeroberfläche kann für manche Nutzer etwas veraltet wirken.
- Die Ersteinrichtung kann für Personen, die mit Open-Source-Plattformen nicht vertraut sind, komplex sein.
- Offizieller technischer Support kann für kleinere Unternehmen teuer sein
Weitere Systemüberwachungstools
Hier sind einige zusätzliche Systemüberwachungstools, die es zwar nicht in meine Shortlist geschafft haben, die aber dennoch einen Blick wert sind:


Systemüberwachungstool – Auswahlkriterien
Bei der Auswahl der besten Systemüberwachungstools für diese Liste habe ich auf gängige Anforderungen und Herausforderungen von Käufern geachtet, wie beispielsweise die Überwachung der Systemleistung in Echtzeit und Integrationsmöglichkeiten. Zusätzlich habe ich den folgenden Bewertungsrahmen genutzt, um objektiv und strukturiert zu bleiben:
Kernfunktionalität (25% der Gesamtbewertung)
Um in diese Liste aufgenommen zu werden, musste jede Lösung folgende gängige Anwendungsfälle abdecken:
- Systemleistung überwachen
- Warnungen bei Systemproblemen
- Ressourcennutzung nachverfolgen
- Echtzeitdaten bereitstellen
- Leistungsberichte generieren
Zusätzliche herausragende Funktionen (25% der Gesamtbewertung)
Um die Auswahl weiter einzuschränken, habe ich nach einzigartigen Merkmalen gesucht, darunter:
- Prädiktive Analysen
- Anpassbare Dashboards
- KI-gestützte Einblicke
- Multi-Cloud-Unterstützung
- Automatisierte Incident-Response
Benutzerfreundlichkeit (10% der Gesamtbewertung)
Um ein Gefühl für die Bedienbarkeit jedes Systems zu bekommen, habe ich Folgendes berücksichtigt:
- Intuitive Benutzeroberfläche
- Einfache Navigation
- Anpassungsmöglichkeiten
- Lernkurve
- Barrierefreiheit
Onboarding (10% der Gesamtbewertung)
Um das Onboarding-Erlebnis jeder Plattform zu bewerten, habe ich folgende Punkte angeschaut:
- Verfügbarkeit von Schulungsvideos
- Interaktive Produkttouren
- Zugang zu Vorlagen
- Unterstützende Chatbots
- Live-Webinare
Kundensupport (10 % der Gesamtpunktzahl)
Um die Kundensupport-Dienste jedes Softwareanbieters zu beurteilen, habe ich Folgendes berücksichtigt:
- 24/7-Verfügbarkeit
- Reaktionszeit
- Support-Kanäle
- Zugang zur Wissensdatenbank
- Personalisierte Unterstützung
Preis-Leistungs-Verhältnis (10 % der Gesamtpunktzahl)
Um das Preis-Leistungs-Verhältnis jeder Plattform zu bewerten, habe ich Folgendes berücksichtigt:
- Konkurrenzfähige Preisgestaltung
- Funktionsumfang im Verhältnis zum Preis
- Lizenzierungsoptionen
- Verfügbarkeit einer kostenlosen Testversion
- Rabatte oder Angebote
Kundenbewertungen (10 % der Gesamtpunktzahl)
Um einen Eindruck von der allgemeinen Kundenzufriedenheit zu gewinnen, habe ich beim Lesen von Kundenbewertungen Folgendes beachtet:
- Benutzerzufriedenheitsbewertungen
- Feedback zur Leistung
- Kommentare zur Benutzerfreundlichkeit
- Support-Erfahrungen
- Wahrgenommener Nutzen
Wie wählt man ein Systemüberwachungstool aus?
Es ist leicht, sich in langen Funktionslisten und komplexen Preisstrukturen zu verlieren. Damit Sie während Ihres individuellen Auswahlprozesses fokussiert bleiben, finden Sie hier eine Checkliste von Faktoren, die Sie im Hinterkopf behalten sollten:
| Faktor | Worauf achten? |
|---|---|
| Skalierbarkeit | Kann das Tool mit Ihrem Unternehmen mitwachsen? Suchen Sie nach Lösungen, die wachsende Datenmengen und Benutzerzahlen verarbeiten, ohne an Leistung zu verlieren. Berücksichtigen Sie auch zukünftige Anforderungen. |
| Integrationen | Funktioniert es mit Ihrer aktuellen Technologielandschaft? Prüfen Sie die Kompatibilität mit vorhandener Software, um einen reibungslosen Datenfluss sicherzustellen und Insellösungen zu vermeiden. |
| Anpassbarkeit | Können Sie es an Ihren Workflow anpassen? Bewerten Sie, ob das Tool Anpassungen zulässt, damit Sie Ihre Prozesse beibehalten können und keine starren Lösungen verwenden müssen. |
| Benutzerfreundlichkeit | Ist die Oberfläche für Ihr Team intuitiv? Ein zu komplexes Tool kann die Effizienz beeinträchtigen. Bevorzugen Sie benutzerfreundliche Lösungen, um den Schulungsaufwand zu minimieren. |
| Implementierung und Onboarding | Wie lange dauert die Inbetriebnahme? Prüfen Sie den Zeit- und Ressourcenaufwand für die Einführung inklusive Schulungen und Support während der Übergangsphase. |
| Kosten | Ist die Preisgestaltung transparent und im Budget? Berücksichtigen Sie sowohl einmalige als auch laufende Kosten. Seien Sie wachsam bei versteckten Gebühren, die die Gesamtausgaben erhöhen können. |
| Sicherheitsmaßnahmen | Schützt das Tool Ihre Daten? Stellen Sie sicher, dass das Tool Sicherheitsstandards erfüllt und Funktionen wie Verschlüsselung sowie Zugriffskontrollen zum Schutz sensibler Informationen bietet. |
Was sind Systemüberwachungstools?
Systemüberwachungstools sind Softwarelösungen, die die Leistung und den Zustand von IT-Systemen überwachen und verwalten. IT-Administratoren, Netzwerkingenieure und Systemanalysten nutzen diese Tools in der Regel, um sicherzustellen, dass Systeme reibungslos und effizient laufen. Funktionen wie Echtzeitüberwachung, Warnmeldungen und Berichte helfen dabei, Probleme zu identifizieren, Ressourcen zu optimieren und die Betriebszeit zu gewährleisten. Diese Tools liefern essenzielle Einblicke, um Systeme zuverlässig und sicher zu halten – insbesondere beim Einsatz spezialisierter Hardware-Überwachungssoftware.
Funktionen
Wenn Sie Systemüberwachungstools auswählen, sollten Sie auf folgende Schlüsselfunktionen achten:
- Echtzeit-Überwachung: Überwacht kontinuierlich die Systemleistung, um Probleme schnell zu erkennen und zu lösen, sobald sie auftreten.
- Alarmierung: Sendet Benachrichtigungen an Benutzer, wenn bestimmte Schwellenwerte überschritten werden, und ermöglicht so eine schnelle Reaktion auf potenzielle Probleme.
- Berichtswesen: Erstellt detaillierte Leistungsberichte, die helfen, Trends zu analysieren und fundierte Entscheidungen zu treffen.
- Integrationsfähigkeit: Verbindet sich mit bestehender Software und Systemen, um einen nahtlosen Datenfluss und umfassende Überwachung zu gewährleisten.
- Anpassbare Dashboards: Ermöglichen es Anwendern, die Oberfläche individuell zu gestalten und die relevantesten Daten für ihre jeweiligen Anforderungen anzuzeigen.
- Prädiktive Analysen: Nutzt historische Daten, um potenzielle zukünftige Probleme vorherzusagen und Ausfallzeiten vorzubeugen, bevor sie entstehen.
- Sicherheitsmaßnahmen: Bietet Funktionen wie Verschlüsselung und Zugriffskontrollen, um sensible Systemdaten zu schützen.
- Skalierbarkeit: Passt sich wachsenden Daten- und Benutzeranforderungen an, ohne die Leistung zu beeinträchtigen.
- Benutzerfreundliche Oberfläche: Sorgt für eine einfache Bedienung, verkürzt die Einarbeitungszeit und minimiert den Schulungsaufwand.
- Automatisierte Reaktion auf Vorfälle: Stellt Werkzeuge zur Verfügung, um häufige Probleme automatisch zu beheben und manuellen Eingriff zu reduzieren.
Vorteile
Die Implementierung von Systemüberwachungstools, einschließlich moderner Nagios-Alternativen, bietet zahlreiche Vorteile für Ihr Team und Ihr Unternehmen. Hier sind einige, auf die Sie sich freuen können:
- Verbesserte Betriebszeit: Echtzeitüberwachung und Alarmierung ermöglichen eine schnelle Reaktion auf Probleme, reduzieren Ausfallzeiten und sorgen für einen reibungslosen Betrieb der Systeme.
- Erhöhte Sicherheit: Schutzmaßnahmen wie Verschlüsselung und Zugriffsbeschränkungen sichern sensible Daten und minimieren das Risiko von Sicherheitsverletzungen.
- Fundierte Entscheidungsfindung: Detaillierte Berichte und prädiktive Analysen liefern Erkenntnisse, die Ihre Ressourcenplanung und Zukunftsentscheidungen unterstützen.
- Höhere Effizienz: Automatisierte Reaktionen auf Vorfälle verringern den manuellen Arbeitsaufwand, sodass Ihr Team sich auf strategisch wichtigere Aufgaben konzentrieren kann.
- Besseres Ressourcenmanagement: Die Überwachung der Ressourcennutzung hilft, die Systemleistung zu optimieren und unnötige Ausgaben zu vermeiden.
- Unterstützung der Skalierbarkeit: Die Fähigkeit, wachsende Anforderungen zu bewältigen, stellt sicher, dass Ihre Systeme mit Ihrem Unternehmen wachsen, ohne an Leistung zu verlieren.
- Nutzerzufriedenheit: Eine benutzerfreundliche Oberfläche erleichtert Ihrem Team die Einarbeitung und effektive Nutzung des Tools, was Frustration minimiert.
Kosten & Preise
Die Auswahl von Systemüberwachungstools erfordert ein Verständnis der verschiedenen Preismodelle und -pläne. Die Kosten variieren je nach Funktionen, Teamgröße, Erweiterungen und weiteren Faktoren. Die folgende Tabelle fasst die gängigen Pläne, deren durchschnittliche Preise und typische Merkmale von Systemüberwachungslösungen zusammen:
Vergleichstabelle für Systemüberwachungstools
| Plan-Typ | Durchschnittlicher Preis | Gemeinsame Merkmale |
|---|---|---|
| Kostenloser Plan | $0 | Grundlegende Überwachung, begrenzte Warnmeldungen und Community-Support. |
| Persönlicher Plan | $5-$15/user/month | Echtzeitüberwachung, grundlegende Berichte und E-Mail-Benachrichtigungen. |
| Business-Plan | $20-$50/user/month | Erweiterte Berichte, Integrationen und anpassbare Dashboards. |
| Enterprise-Plan | $60-$100/user/month | Vollständige Analysesuite, prädiktive Analysen und dedizierter Kundensupport. |
Systemüberwachungs-Tools – Häufig gestellte Fragen
Hier finden Sie Antworten auf häufig gestellte Fragen zu Systemüberwachungs-Tools:
Können Systemüberwachungs-Tools mit Ticketing-Systemen integriert werden?
Ja, viele Tools lassen sich mit Ticketing-Plattformen wie Jira oder ServiceNow verbinden. Das bedeutet, dass Alarme automatisch Tickets erstellen können, sodass Ihrem Team nichts entgeht. Dies hilft dabei, Workflows organisiert zu halten und gewährleistet eine zügige Problemlösung. Die Einrichtung erfolgt meist über Webhooks oder native Plugins.
Welche Arten von Alarmen kann man in Systemüberwachungs-Tools einstellen?
Sie können Alarme für Grenzwerte, Anomalien oder bestimmte Ereignisse wie Serviceausfälle konfigurieren. Manche Tools unterstützen benutzerdefinierte Alarme für Protokollmeldungen oder fehlgeschlagene Prüfungen. Sie bestimmen, wie Alarme ausgelöst werden—zum Beispiel durch einen Wert, einen Zeitraum oder durch Trends. Die Benachrichtigung erfolgt per E-Mail, SMS, Slack oder anderen Kanälen.
Können Systemüberwachungs-Tools sowohl Server als auch Anwendungen überwachen?
Ja, viele Tools überwachen Hardwaremetriken und kontrollieren zugleich die Performance auf Anwendungsebene. Dazu gehören Verfügbarkeit, Reaktionszeit und Nutzerverhalten von Anwendungen. Sie erhalten Einblick darin, wie sich der Zustand der Server auf die Performance der Anwendungen auswirkt. Manche Tools bieten separate Module für Infrastruktur- und Anwendungsüberwachung.
Wie unterstützen Systemüberwachungs-Tools Multi-Cloud-Umgebungen?
Die meisten Tools ermöglichen eine Anbindung an AWS, Azure und Google Cloud über APIs oder Agenten. Sie sammeln Daten über diese Plattformen hinweg und stellen sie in einem einzigen Dashboard dar. Dadurch hat Ihr Team eine zentrale Übersicht über die Performance, selbst wenn Systeme in unterschiedlichen Clouds betrieben werden. So entfällt die Notwendigkeit, mehrere Anbieter-Tools parallel zu verwalten.
Was kommt als Nächstes:
Wenn Sie gerade Systemüberwachungs-Tools recherchieren, lassen Sie sich kostenlos von einem SoftwareSelect-Berater Empfehlungen geben.
Sie füllen ein Formular aus und führen ein kurzes Gespräch, in dem Ihre Anforderungen im Detail besprochen werden. Anschließend erhalten Sie eine Shortlist mit geeigneter Software. Auf Wunsch begleitet Sie der Berater während des gesamten Beschaffungsprozesses, einschließlich Preisverhandlungen.