10 Best Big Data Analytics Tools Reviewed in 2026

Best Big Data Analytics Tools Shortlist
Here’s my shortlist of the best Big Data Analytics Tools:


The best big data analytics tools help teams process large datasets efficiently, run advanced queries at scale, and generate clear insights that support faster, more informed business decisions. They enable organizations to move beyond raw data and uncover patterns, trends, and predictions that directly impact operations and strategy.
Many teams start looking for these tools after facing challenges like spending hours running slow queries on legacy systems, struggling to visualize data across disconnected platforms, or wasting time manually cleaning and preparing datasets. Without the right platform, it becomes difficult to turn data into meaningful insights that decision-makers can trust.
I’ve evaluated big data analytics tools in live production environments, tested their performance with real-time data pipelines, and worked with teams migrating from traditional databases to modern distributed systems. These experiences revealed which platforms actually handle scale, deliver usable insights, and integrate with the broader analytics stack.
In this guide, you’ll see which big data analytics tools excel at real-time analysis, simplify collaboration across teams, and provide the most actionable insights to improve decision-making and efficiency.
Why Trust Our Software Reviews
We’ve been testing and reviewing SaaS development software since 2023. As tech experts ourselves, we know how critical and difficult it is to make the right decision when selecting software. We invest in deep research to help our audience make better software purchasing decisions.
We’ve tested more than 2,000 tools for different SaaS development use cases and written over 1,000 comprehensive software reviews. Learn how we stay transparent & check out our software review methodology.
Best Big Data Analytics Tools Summary
This comparison chart summarizes pricing details for my top Big Data Analytics Tools selections to help you find the best one for your budget and business needs.
| Tool | Best For | Trial Info | Price | ||
|---|---|---|---|---|---|
| 1 | Best for scalable marketing data | Free demo available | Pricing upon request | Website | |
| 2 | Best for small businesses | 15-day free trial + free plan + free demo available | From $48/2 users/month (billed annually) | Website | |
| 3 | Best for data warehousing | Free demo available | From $37/month (billed annually) | Website | |
| 4 | Best for live spreadsheet reporting | Free plan available | From $49/month (billed annually) | Website | |
| 5 | Best for multi-source data aggregation | Free demo available | Pricing upon request | Website | |
| 6 | Best for IT operations | 30-day free trial + free demo available | From $10/month (billed annually) | Website | |
| 7 | Best for data visualization | Free trial available | From $75/user/month (billed annually) | Website | |
| 8 | Best for collaborative data analysis | Free plan available | From $22/user/month (billed annually) | Website | |
| 9 | Best for log management | 60-day free trial | Pricing upon request | Website | |
| 10 | Best for embedded analytics | 30-day trial available | Pricing upon request | Website |
-

Site24x7
Visit WebsiteThis is an aggregated rating for this tool including ratings from Crozdesk users and ratings from other sites.4.6 -
GitHub Actions
Visit WebsiteThis is an aggregated rating for this tool including ratings from Crozdesk users and ratings from other sites.4.8 -
Docker
Visit WebsiteThis is an aggregated rating for this tool including ratings from Crozdesk users and ratings from other sites.4.6


Best Big Data Analytics Tool Reviews
Below are my detailed summaries of the best Big Data Analytics Tools that made it onto my shortlist. My reviews offer a detailed look at the key features, pros & cons, integrations, and ideal use cases of each tool to help you find the best one for you.

Adverity is an integrated data platform designed to help businesses automate the connectivity, transformation, and governance of marketing data at scale.
Why I picked Adverity: I picked Adverity because of its strong data transformation and quality monitoring features that are key for big data analytics. It automates data cleansing and harmonization so your team can ensure data quality and consistency across various sources. Its AI-powered monitoring tools also catch data quality issues early, helping ensure your insights are reliable. These features make it easier to scale and work with complex, high-volume datasets without compromising accuracy.
Standout features & integrations:
Features include smart naming conventions that automatically detect and enforce naming patterns in your data, ensuring consistency and reducing errors. Additionally, automated currency conversion allows you to harmonize financial data from different regions, making global analysis more straightforward.
Integrations include Google Ads, Facebook Ads, Amazon Advertising, Shopify, Salesforce, Adobe Experience Platform, LinkedIn, Microsoft, SAP, Snowflake, and Tableau.
Pros and Cons
Pros:
- Offers AI-powered data quality monitoring
- Provides advanced data transformation features
- Automates data integration from multiple sources
Cons:
- Integration with certain niche data sources may require additional configuration
- Some advanced features might require extra training to utilize fully
New Product Updates from Adverity
Adverity Adds Real-Time Authorization Status for API Connections
Adverity has introduced an
is_authorized
flag in the Management API that provides more accurate, real-time visibility into connection authorization status. For more information, visit Adverity's official site.
 .
.
Zoho Analytics is a business intelligence and analytics tool designed for small businesses. It enables users to create insightful reports and dashboards, helping them make data-driven decisions.
Why I picked Zoho Analytics: It's tailored for small businesses by offering a user-friendly interface and cost-effective pricing. Zoho Analytics provides drag-and-drop functionalities for easy report creation. It includes pre-built visualizations that save time for your team. You can also use its AI assistant, Zia, for quick data queries.
Standout features & integrations:
Features include data blending, which allows you to combine data from different sources. It offers collaborative analytics, so your team can work together on reports. You can also enjoy scheduled data imports to keep your reports updated.
Integrations include Salesforce, Microsoft Dynamics, Mailchimp, Google Workspace, Dropbox, Slack, Zendesk, HubSpot, QuickBooks, and Shopify.
Pros and Cons
Pros:
- Suitable for small teams
- AI assistant for queries
- Customizable dashboards
Cons:
- Some features require premium plans
- Limited advanced analytics
New Product Updates from Zoho Analytics

Zoho Analytics Enhances Analysis, Reporting, and Real-Time Data
Zoho Analytics brings richer PDF exports, smarter multi-table auto analysis, and real-time data connections. These updates help teams generate deeper insights, preserve report accuracy, and analyze data in real time with less manual effort. For more information, visit Zoho Analytics’ official site.
 .
.
Supermetrics is a data warehousing solution designed for marketers and data analysts. It helps users integrate data from over 150 marketing sources into platforms like Google Sheets and BigQuery.
Why I picked Supermetrics: It focuses on data warehousing by enabling seamless integration from various marketing platforms. Supermetrics allows you to connect data from Facebook Ads, Google Ads, and more. Its ability to transfer data into tools like Looker Studio and Power BI sets it apart. You can visualize and analyze marketing performance efficiently.
Standout features & integrations:
Features include automated data transfers, historical data analysis, and secure data management. Your team can easily compile data from different sources and visualize it using BI tools. The platform ensures compliance with regulations like GDPR and CCPA.
Integrations include Facebook Ads, Google Ads, TikTok Ads, Google Sheets, BigQuery, Looker Studio, Power BI, LinkedIn Ads, Microsoft Excel, and Instagram Insights.
Pros and Cons
Pros:
- Compliance with GDPR
- Suitable for marketers
- Secure data transfers
Cons:
- Can be expensive for small teams
- Limited customization options
New Product Updates from Supermetrics
Supermetrics Updates Ahrefs and Database Data Sources
Supermetrics has updated its Ahrefs and Database data sources to ensure smoother performance and stronger connection reliability. Users may need to reconnect or adjust their configurations to continue syncing data without interruptions. For more information, visit Supermetrics' official site.
 .
.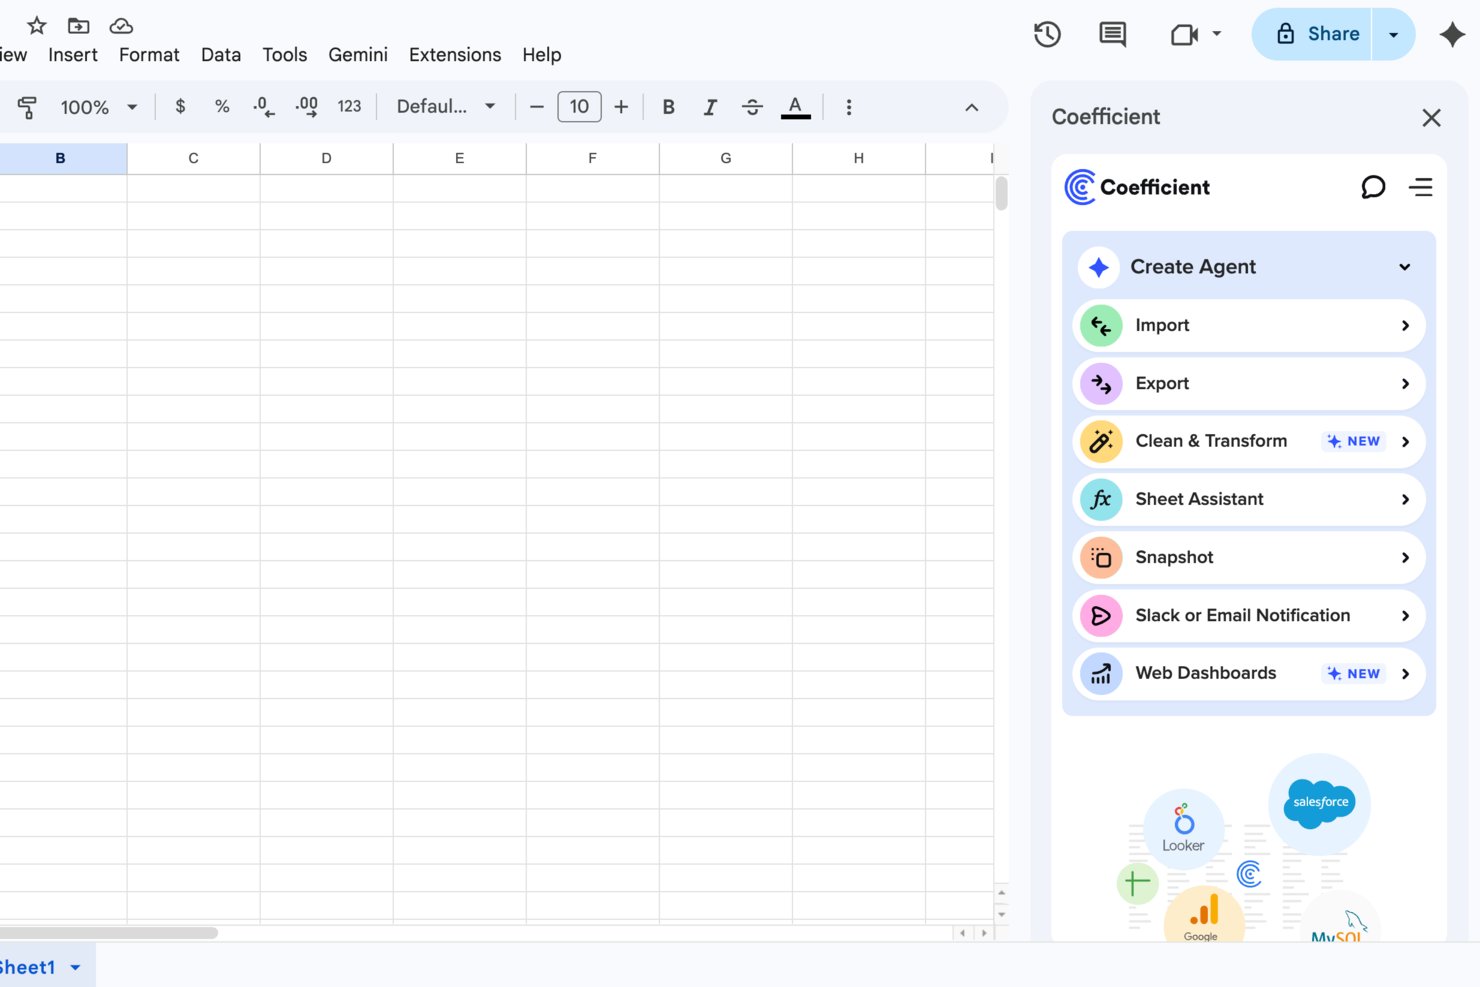
Coefficient is a no-code connectivity tool that links your spreadsheets directly to your live business systems and databases. It eliminates the friction of manual data exports by turning Google Sheets or Excel into a real-time analytics hub. By integrating with 100+ data sources, Coefficient unifies disparate data, enabling your team to create real-time analyses and dashboards that drive informed decision-making.
Why I Picked Coefficient
I picked Coefficient for its unique ability to transform everyday spreadsheets into dynamic data applications, a feature that sets it apart in the field of big data analytics tools. It bridges the gap between massive data warehouses and the spreadsheets your team already uses, ensuring your reports are always backed by real-time data without the need for manual CSV uploads. Additionally, the AI-powered analytics enhance your ability to generate actionable insights without complex coding, making it an ideal choice for teams looking to leverage data effectively. As a result, these capabilities align perfectly with the needs of businesses looking to elevate their data-driven strategies.
Coefficient Key Features
In addition to its standout integration capabilities, I also found several features that enhance its value as a big data analytics tool:
- AI-Driven Live Data Analysis: This feature allows you to perform real-time data analysis, providing immediate insights and facilitating quick decision-making.
- Automated Reporting: With this feature, you can set up reports to be generated automatically, saving time and ensuring consistent data updates.
- Customizable Dashboards: You can create tailored dashboards that reflect your specific data needs, enhancing the visualization and understanding of complex data sets.
- Automated Alerts: This feature lets you set up notifications via Slack or email, ensuring your team stays informed about critical data changes or insights.
Coefficient Integrations
Integrations include Google Sheets, Excel, Salesforce, QuickBooks, Looker, Tableau, PostgreSQL, Snowflake, Slack, HubSpot, Google Analytics, and MySQL, with additional connections available via custom API integrations. Coefficient’s custom API agent enables you to build your own integrations directly into Google Sheets or Excel.
Pros and Cons
Pros:
- Connects live business data directly into familiar spreadsheet workflows
- Enables self-service reporting without building custom data pipelines
- Unifies CRM, finance, and warehouse data in a single reporting environment
Cons:
- Dependency on internet connectivity
- No standalone dashboard visualization
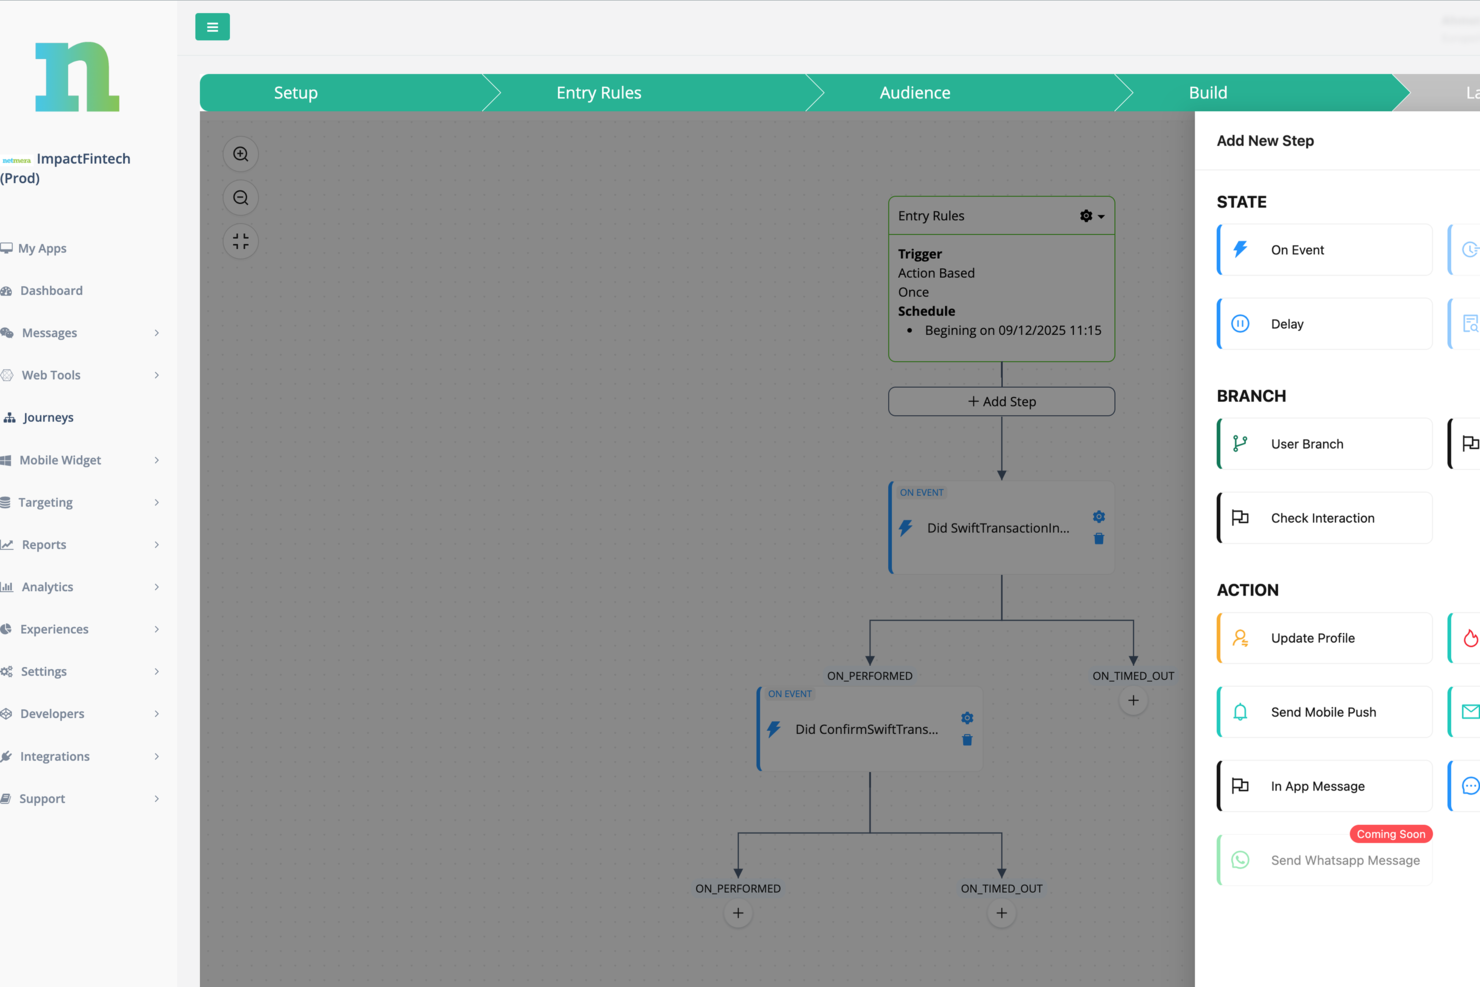
Netmera is an AI-powered customer engagement platform designed for businesses that want to turn customer data into more personalized, high-impact interactions. It supports omnichannel communication across mobile, web, email, and SMS, helping teams deliver consistent messaging throughout the customer journey. With built-in analytics and journey orchestration tools, Netmera enables industries such as retail, telecommunications, and banking to refine marketing strategies, improve targeting, and strengthen customer retention.
Why I Picked Netmera
I picked Netmera because of its strong data analytics capabilities that provide actionable insights into customer behavior. Its customer data platform aggregates data from multiple sources, allowing you to create comprehensive user profiles for targeted marketing. Additionally, Netmera's A/B testing feature lets you experiment with different strategies to determine the most effective approach, ensuring that your campaigns are always optimized for the best results.
Netmera Key Features
In addition to its data analytics and A/B testing capabilities, Netmera offers several other features that can enhance your team's marketing efforts:
- Web Personalization: This feature allows you to tailor web experiences for individual users based on their behavior and preferences.
- Tagless Data Capture: Automatically collect user data without needing manual tagging, simplifying data management.
- Customer Journey Mapping: Visualize and analyze the steps customers take, helping you optimize touchpoints and improve engagement.
- Feedback Collection: Gather insights directly from users to refine your strategies and address any issues promptly.
Netmera Integrations
Integrations include mobile and web push notifications, email and SMS marketing, WhatsApp, web pop-ups, Amazon SES, Setrow, and Uzman Posta.
Pros and Cons
Pros:
- Supports multi-channel engagement campaigns
- Built-in A/B testing tools
- Real-time campaign performance insights
Cons:
- Initial setup can be time-intensive
- Advanced features may require onboarding

Site24x7 is an IT operations management tool aimed at IT administrators and DevOps teams. It provides monitoring and analysis for websites, servers, and network infrastructure to ensure optimal performance.
Why I picked Site24x7: It's tailored for IT operations, offering comprehensive monitoring of your entire IT infrastructure. Site24x7 includes real-time user monitoring and server monitoring capabilities. It supports application performance management to ensure your applications run smoothly. Network monitoring features help you keep an eye on all your network devices.
Standout features & integrations:
Features include cloud cost management, which helps your team optimize cloud spending. You can use synthetic monitoring to simulate user interactions and identify potential issues. Log management allows you to analyze logs and troubleshoot problems quickly.
Integrations include Amazon Web Services, Microsoft Azure, Google Cloud Platform, Docker, Kubernetes, Slack, Microsoft Teams, PagerDuty, ServiceNow, and Zapier.
Pros and Cons
Pros:
- Cloud cost management
- Detailed performance insights
- Real-time monitoring
Cons:
- Some features need higher-tier plans
- Limited customization in lower plans
New Product Updates from Site24x7

Site24x7 Enhances Network Monitoring With Device and Visibility Updates
Site24x7 introduces proactive hardware health monitoring, expanded device support, centralized network controls, and enhanced SD-WAN visualization to improve network monitoring and management. For more information, visit Site24x7’s official site.
 .
.
Tableau is a data visualization tool tailored for analysts and business intelligence professionals. It allows users to create interactive and shareable dashboards that depict data insights in a visually engaging manner.
Why I picked Tableau: It's ideal for data visualization, providing a wide array of chart types and customization options. Tableau offers drag-and-drop functionality, making it easy for your team to build dashboards. It supports real-time data analysis, helping you make timely decisions. The tool's ability to handle large datasets with ease distinguishes it in the visualization space.
Standout features & integrations:
Features include storytelling, which lets you create narrative presentations from your data. You can use its data blending capability to combine data from different sources. Tableau also offers geospatial analytics, providing maps and location-based insights.
Integrations include Salesforce, Microsoft Excel, Google Analytics, Amazon Redshift, Microsoft SQL Server, Oracle, SAP HANA, Snowflake, Google BigQuery, and Dropbox.
Pros and Cons
Pros:
- Strong community support
- Real-time data analysis
- Wide range of visual options
Cons:
- Requires data preparation
- Limited mobile support

Observable is a data visualization and analysis platform aimed at data scientists and analysts. It allows users to create interactive, shareable visualizations and collaborate in real-time on data projects.
Why I picked Observable: It's focused on collaborative data analysis, letting teams work together on data projects seamlessly. Observable offers live collaboration features, allowing multiple users to edit and view data visualizations in real-time. Its notebook-style interface supports dynamic data exploration. You can also use custom code to create tailored visualizations, enhancing the collaborative process.
Standout features & integrations:
Features include version control, which keeps track of changes made to your data projects. Observable provides customizable templates for quick visualization setups. You can also embed visualizations directly into websites or applications, making data sharing easy.
Integrations include Google Sheets, GitHub, D3.js, Plotly, Vega-Lite, Mapbox, Leaflet, TopoJSON, Airtable, and AWS S3.
Pros and Cons
Pros:
- Easy embedding of visualizations
- Supports custom coding
- Real-time collaboration
Cons:
- Restricted to web-based use
- Limited offline functionality
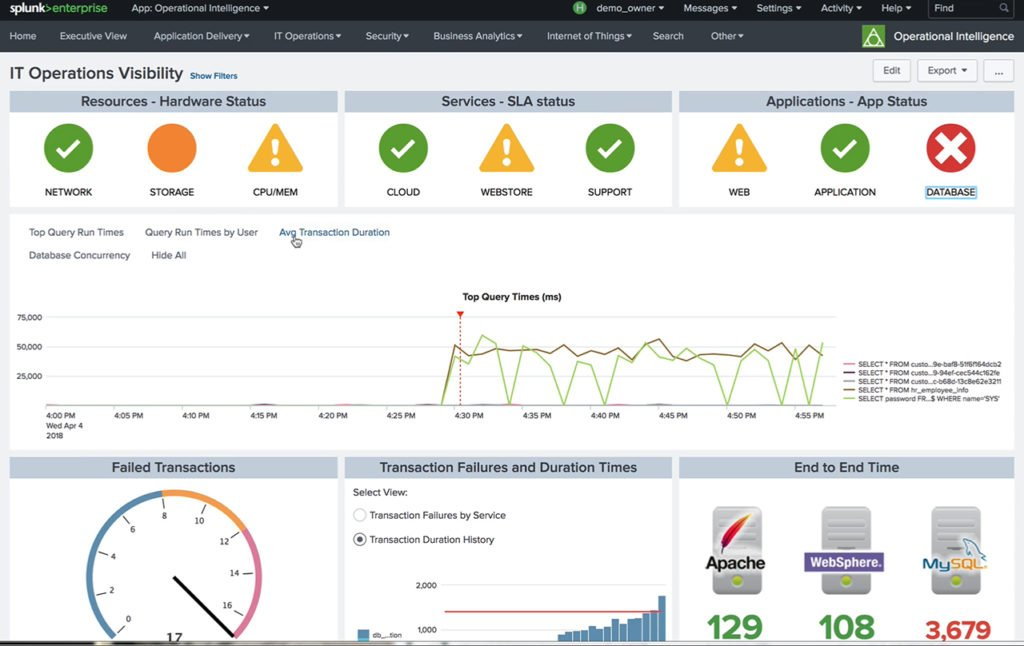
Splunk Enterprise is a data analytics platform primarily used by IT and security teams. It excels in log management and helps with real-time data analysis, enabling better decision-making.
Why I picked Splunk Enterprise: It's designed for log management, providing advanced search and indexing capabilities. Splunk Enterprise allows you to collect and analyze log data from various sources in real-time. It includes features for alerting and reporting that keep your team informed. The platform also offers scalability, making it suitable for growing businesses.
Standout features & integrations:
Features include machine learning capabilities that help in predictive analysis. You can use its customizable dashboards to visualize data in a way that suits your needs. Splunk Enterprise also offers an alerting system that notifies your team of critical issues.
Integrations include Amazon Web Services, Microsoft Azure, Google Cloud Platform, ServiceNow, Cisco, Palo Alto Networks, VMware, Salesforce, Docker, and Kubernetes.
Pros and Cons
Pros:
- Supports machine learning
- Strong alerting capabilities
- Scalable for large data volumes
Cons:
- Limited support for smaller teams
- Can be resource-intensive

GoodData is a business intelligence and analytics platform designed for enterprises and software companies. It specializes in providing embedded analytics solutions, allowing users to integrate analytics into their own applications.
Why I picked GoodData: It excels in embedded analytics, offering flexible deployment options for your team. GoodData allows you to embed dashboards and reports directly into your applications. It supports multi-tenant architectures, making it suitable for organizations with multiple clients. The platform offers white-labeling capabilities, so you can customize the analytics experience to match your brand.
Standout features & integrations:
Features include advanced data modeling, which helps your team create complex data schemas. You can use its scalable architecture to manage large volumes of data efficiently. GoodData also provides automated data distribution, ensuring your clients receive timely analytics.
Integrations include Salesforce, Snowflake, Google BigQuery, Amazon Redshift, Microsoft Azure, AWS S3, Oracle, MySQL, PostgreSQL, and Teradata.
Pros and Cons
Pros:
- Advanced data modeling features
- Scalable for large data volumes
- Offers white-labeling options
Cons:
- May need frequent updates
- Limited customization for visuals
Other Big Data Analytics Tools
Here are some additional Big Data Analytics Tools options that didn’t make it onto my shortlist, but are still worth checking out:
- IBM Cloud Pak for Data
For reducing ETL requests
- SAS Visual Analytics
Big data analytics tool with smart visualizations
- Qlik Sense
For self-service analytics
- Azure Data Lake Analytics
Pay-per-job big data solution
- Azure Databricks
For scalability
- Qrvey
Big data analysis for start-ups
- DNIF Security Information & Event Management (SIEM)
For security analytics
- Arcadia Enterprise
Telecommunications analytics solution
- Semrush
Big data analytics for ease of use + accessibility
- Sisense
API-first cloud technology
- Cloudera
Industrialized enterprise AI
- Talend
Data integration with governance
- MATLAB
Iterative analysis and design processes
- Bizintel360
For analytics without programming knowledge
- Exasol
For retail data analytics
- Qubole
For openness and data workload flexibility
- Apache Spark
Open-source big data analytics tool (with Apache Hadoop)
- iceDQ
For dataops testing and monitoring
- Azure Databricks
For Microsoft Suite users
- Omniscope EVO
For Chrome browser users
- DNIF Big Data Analytics
Event log management
- CloudMoyo
For CIOs and CTOs
- Altamira Lumify
For link analysis
- Plotly
To productionize Python analytics
- Jethro
For 1000+ concurrent users


Big Data Analytics Tool Selection Criteria
When selecting the best Big Data Analytics Tools to include in this list, I considered common buyer needs and pain points like handling large datasets and ensuring data security. I also used the following framework to keep my evaluation structured and fair:
Core Functionality (25% of total score)
To be considered for inclusion in this list, each solution had to fulfill these common use cases:
- Data visualization
- Real-time analytics
- Predictive analysis
- Data integration
- Reporting and dashboards
Additional Standout Features (25% of total score)
To help further narrow down the competition, I also looked for unique features, such as:
- Machine learning capabilities
- Customizable user interfaces
- Advanced security features
- Cloud compatibility
- Interactive data exploration
Usability (10% of total score)
To get a sense of the usability of each system, I considered the following:
- Intuitive navigation
- Clear layout and design
- Minimal learning curve
- Responsive interface
- Customization options
Onboarding (10% of total score)
To evaluate the onboarding experience for each platform, I considered the following:
- Availability of training videos
- Interactive product tours
- Access to templates
- Webinars and live sessions
- Supportive chatbots
Customer Support (10% of total score)
To assess each software provider’s customer support services, I considered the following:
- Availability of 24/7 support
- Multiple contact methods
- Knowledge base access
- Response time
- Quality of resolutions
Value For Money (10% of total score)
To evaluate the value for money of each platform, I considered the following:
- Pricing transparency
- Competitive pricing
- Features offered per price tier
- Discounts for long-term plans
- Free trial availability
Customer Reviews (10% of total score)
To get a sense of overall customer satisfaction, I considered the following when reading customer reviews:
- Overall satisfaction ratings
- Feedback on ease of use
- Comments on support quality
- User-reported bugs or issues
- Recommendations and referrals
How to Choose Big Data Analytics Tool
It’s easy to get bogged down in long feature lists and complex pricing structures. To help you stay focused as you work through your unique software selection process, here’s a checklist of factors to keep in mind:
| Factor | What to Consider |
| Scalability | Ensure the tool can grow with your data needs. Look for solutions that handle increasing data volumes without compromising performance, especially if your business is expanding. |
| Integrations | Check if the tool integrates with your existing software stack, like CRM systems or other blockchain tools. Seamless data flow between applications can save your team time and reduce errors. |
| Customizability | Consider if the tool allows customization to fit your specific business processes. Custom dashboards and reports can provide more relevant insights for your team. |
| Ease of Use | Evaluate the learning curve and user interface. Tools that are intuitive save your team time and reduce the need for extensive training. |
| Budget | Align the tool's cost with your budget constraints. Consider both upfront costs and long-term expenses like subscription fees or additional user licenses. |
| Security Safeguards | Verify the tool's data security measures, such as encryption and compliance with regulations like GDPR. Protecting your data should be a top priority. |
| Support Services | Look for available customer support options. Reliable support can help troubleshoot issues quickly, minimizing downtime for your team. |
| Performance | Assess the tool's speed and reliability. Consistent performance ensures your team can access and analyze data without interruptions. |
Trends in Big Data Analytics Tool
In my research, I sourced countless product updates, press releases, and release logs from different Big Data Analytics Tools vendors. Here are some of the emerging trends I’m keeping an eye on:
- Real-time analytics: Businesses want data insights on the fly. SQL analytics tools are focusing on providing real-time data processing to help companies make quick decisions. Vendors like Apache Kafka and Azure Stream Analytics are enhancing their real-time capabilities.
- Data democratization: More tools are enabling non-technical users to access and interpret data. This trend empowers all team members to make data-driven decisions. Qlik Sense and Tableau are leading the way with user-friendly interfaces.
- AI-driven insights: Artificial intelligence is being integrated to uncover patterns and predictions. This helps businesses anticipate trends and optimize strategies. Tools like IBM Watson Analytics are using AI to offer deeper insights.
- Self-service data preparation: Users want to prepare their data without relying on IT. Tools are offering self-service features that simplify data cleaning and transformation. Trifacta and Alteryx are examples of vendors focusing on this trend.
- Data privacy advancements: With data breaches on the rise, tools are focusing on enhancing data security features. This includes encryption and compliance with regulations like GDPR. Vendors like Splunk and GoodData are prioritizing data privacy measures.
What Are Big Data Analytics Tools?
Big Data Analytics tools are software solutions designed to process and analyze large volumes of data to uncover insights. These tools are commonly used by data scientists, analysts, and IT professionals who need to interpret complex datasets and derive actionable insights.
Real-time analytics, AI-driven insights, and data democratization features help with making informed decisions quickly and efficiently. Overall, these tools provide businesses with the ability to turn data into a strategic asset, enhancing decision-making and operational efficiency.
Features of Big Data Analytics Tools
When selecting Big Data Analytics Tools, keep an eye out for the following key features:
- Data visualization: Transforms complex data into easy-to-understand charts and graphs, helping users quickly grasp insights.
- AI-driven insights: Uses artificial intelligence to uncover patterns and predictions, enhancing strategic planning.
- Self-service data preparation: Enables users to clean and transform data without IT support, saving time and resources.
- Scalability: Handles increasing data volumes efficiently, supporting business growth and expansion.
- Real-time cloud analytics: Provides immediate insights from live data, allowing businesses to make timely decisions.
- Data integration: Connects with various data sources to provide a unified view, improving data accuracy and completeness.
- Customizability: Allows users to tailor dashboards and reports to fit their specific needs and preferences.
- Security safeguards: Ensures data protection through encryption and compliance with regulations like GDPR.
- Collaborative features: Facilitates teamwork by allowing multiple users to work on data projects simultaneously.
- Smart search capabilities: Data catalog tools can helps users find and analyze specific data quickly, improving productivity.
Benefits of Big Data Analytics Tools
Implementing Big Data Analytics Tools provides several benefits for your team and your business. Here are a few you can look forward to:
- Improved decision-making: Real-time analytics and AI-driven insights help your team make informed decisions quickly.
- Increased efficiency: Self-service data preparation reduces the need for IT support, speeding up data processing tasks.
- Enhanced collaboration: Collaborative features allow your team to work together on data projects, improving productivity.
- Scalability: The ability to handle large datasets means your tools can grow with your business needs.
- Better data accuracy: Data integration provides a unified view, ensuring decisions are based on complete and accurate information.
- Data security: Security safeguards protect sensitive information and help comply with regulations like GDPR.
- Customized insights: Customizability lets you tailor reports and dashboards, providing insights that are directly relevant to your business.
Costs and Pricing of Big Data Analytics Tools
Selecting Big Data Analytics Tools requires an understanding of the various pricing models and plans available. Costs vary based on features, team size, add-ons, and more. The table below summarizes common plans, their average prices, and typical features included in Big Data Analytics Tools solutions:
Plan Comparison Table for Big Data Analytics Tools
| Plan Type | Average Price | Common Features |
| Free Plan | $0 | Basic data visualization, limited data storage, and community support. |
| Personal Plan | $10-$30/user/month | Enhanced visualizations, real-time analytics, and self-service data preparation. |
| Business Plan | $50-$150/user/month | Advanced analytics, collaborative features, and integration with popular business tools. |
| Enterprise Plan | $200-$500/user/month | Customizable dashboards, AI-driven insights, scalability options, and dedicated customer support. |
Big Data Analytics Tool FAQs
Here are some answers to common questions about big data analytics tools:
What are the limitations of big data analytics?
Big data analytics can face challenges with data quality, integration, and high infrastructure costs. You might also encounter issues around processing speed, real-time analysis, and managing unstructured data. To minimize these limitations, invest in data governance frameworks, scalable cloud infrastructure, and automation tools. Regularly auditing your data pipelines for accuracy and efficiency also helps ensure reliable output.
What is the biggest issue in working with big data for analytics?
The biggest issue is often ensuring security and compliance across large, complex datasets. Protecting sensitive information, meeting regulatory requirements, and monitoring data access can get complicated at scale. You can mitigate risks by adopting strong encryption, access controls, and automated compliance checks, as well as maintaining up-to-date documentation.
How do big data analytics tools support scalability?
Many Databricks competitors support scalability by using distributed computing, cloud-native architectures, and auto-scaling features. If you expect rapid data growth, look for solutions with elastic compute and storage. Flexible APIs and modular services will help your team add capacity without downtime or performance loss.
How can CTOs ensure data privacy and compliance when implementing big data analytics tools?
You can ensure data privacy and compliance by selecting tools with built-in policy controls, audit trails, and encryption options. Always align workflows with relevant standards like GDPR or HIPAA. Regular compliance audits, employee training, and deploying data masking or anonymization techniques help protect sensitive information through every stage of analytics.
What are common pitfalls to avoid when migrating legacy systems to modern big data analytics platforms?
Common pitfalls include underestimating data cleaning needs, failing to map integrations, and ignoring hidden costs like retraining staff or updating security protocols. To avoid these, plan for incremental migration, thoroughly assess dependencies, and run pilot tests. Collaborate closely with IT and business teams to set clear goals and maintain system stability.
How do I evaluate the total cost of ownership for big data analytics tools?
To fully evaluate cost, look beyond licenses or subscriptions. Factor in infrastructure (cloud or on-prem), integration expenses, ongoing maintenance, training, and support. Assess how each tool’s resource requirements align with your traffic and storage expectations. Analyze contract terms for extra charges related to scaling, support, or custom add-ons.
What's Next?
Boost your SaaS growth and leadership skills. Subscribe to our newsletter for the latest insights from CTOs and aspiring tech leaders. We'll help you scale smarter and lead stronger with guides, resources, and strategies from top experts!